United Homes Group stock plunges after Nikki Haley, directors resign
It could well be time to short oil again.
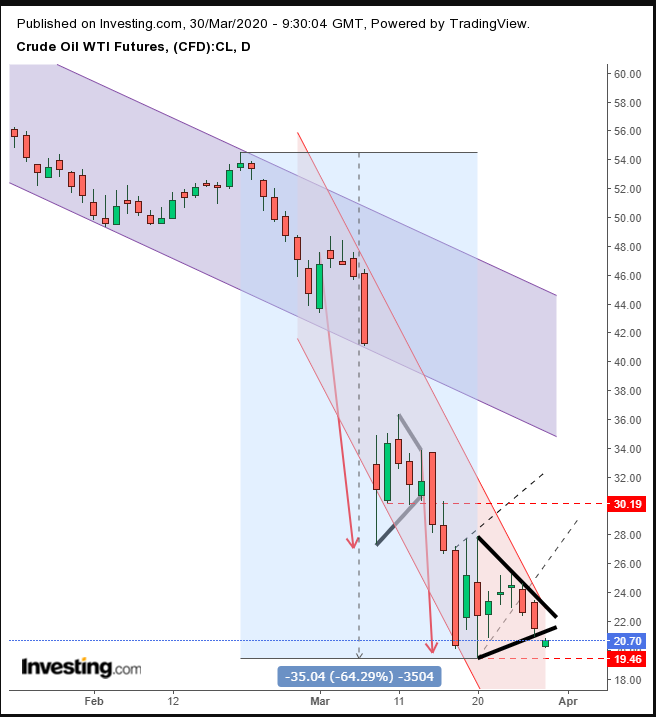
Last week, we expected oil to rebound toward $30, along with a rising flag. But conditions appear worse than we had anticipated after the commodity's heart-stopping 35% plunge. It's now clear we overstated a contrarian position, counting on a corrective move, which is always less reliable than the trend.
Prevailing conditions mean oil is being hit by four major events at once:
- The coronavirus outbreak has hamstrung the economy, reducing energy demand.
- Low prices have led to a war for marketshare.
- The spread of COVID-19 prompted lockdowns across the globe, disrupting the supply of, and demand, for oil.
- OPEC discipline is eroding, as members begin to ignore their group president's request for an emergency consultation meeting over the historically low prices.
And of course, the challenge of attempting forecasts at a time of extremely bad fundamentals is the possibility that these events are already priced in — thus reversing risk to the upside.
The bearish pennant has provided a downside breakout. It's the second pennant in a row. This means the circumstances that create a temporary pause before the underlying trend presumably continues are being repeated.
Some Investors made a lot of money fast. They think it’s too good to be true, so they quickly cash in profits. Then they wait. Did they go too far and will prices return — as we expected — or will prices go even lower?
Within the pattern, those who had already taken their spoils, rapidly exited their positions. Others, less quick to act, are envious and hope for the same. They come in to pick up the contracts dumped by the previous short sellers as well as liquidated longs. This is what presumptively takes place within a continuation pattern: contracts are changing hands between take-profits and newcomers.
The downside breakout happens when there are no contracts left for the prices within the pattern. That signals to the previous short sellers that the question posed by the equilibrium — are prices too low or too high — was settled to the downside and another leg down is in the making.
However, while the danger of bear traps is something to beware on any day, it is much more perilous during these wild times — especially considering that the price is coming back, after all the bad news has been dispensed.
Therefore it’s crucial to only enter trades that satisfy your pre-set trading requirements and to follow your plan, no matter what. When you enter a trade, do so, only if you’re comfortable with losing your investment.
Trading Strategies
Conservative traders should wait for a close below the psychological, round $20.00, followed by a return move that confirms the pattern’s resistance.
Moderate traders may follow the same breakout below 20.00, then they may wait for a corrective rally for a better entry, not necessarily for proof of trend.
Aggressive traders may enter a contrarian trade, hoping to catch the return move, understanding they are trading against the trend, and are prepared to risk whatever they put up for this trade.
Contrarian Trade Sample
- Entry: 20.45
- Stop-Loss: 19.45, below the March 20 low
- Risk: 1.00
- Target: 23.45
- Reward: 3.00
- Risk:Reward Ratio: 1:3
