Five things to watch in markets in the week ahead
WTI is falling for the second day following reports that Kuwait and Saudi Arabia are nearing a deal to restart production in the shared neutral zone along their border which has been untouched for four years.
For traders that means up to an additional 500,000 barrels a day on the market — plus weighing up this new reality. Are they done, or will prices keep falling?
Technical analysis of the charts can help determine what to look for next.

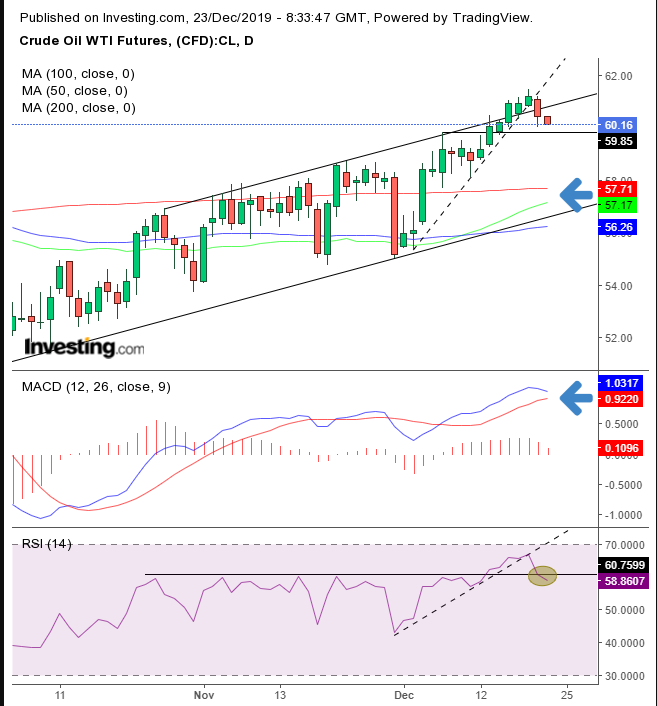
The price is retreating from the top of a rising channel since the Oct. 3 bottom. The pattern’s dynamics are constructed by a supply-demand balance that ultimately agrees that prices should rise. When oil reaches the bottom of the channel, demand kicks in, propelling prices back toward the top of the channel, at which point supply takes over, pushing prices back down toward the channel bottom.
These forces — supply and demand — are not necessarily driven by different investors. The same trader could contribute demand for the contract at the bottom of the channel, then take profit when it reaches the top of the pattern, joining with the supply side of the market.
Having said that, the impetus of the move is presumed to be in the direction of the trend — and this one is up, as attested by the fact that this is a rising channel. That means that trading against the trend always includes the risk of being smacked in the face, as prices fail to complete an expected pullback but rather resume in the direction of the trend.
For this reason, more conservative traders would wait for a full return move toward the channel bottom or for evidence of a channel blowout, using that top as a likely support. More aggressive traders may short, providing they understand the risks and have written their trade plan accordingly.
But there's more evidence on the chart. While the 50 DMA is climbing toward the 200 DMA for a potential “golden cross,” its bullishly predictive qualities have been diminished by the fact that prices have been moving sideways since the “death cross” in July. The MACD is the most overbought since May and is curving down for a likely sell signal. The RSI provided a negative divergence, when it dipped below its series of peaks since October, while the price is still above the Dec. 6 peak.
We see a pullback toward $57, maybe $58, though we’d be more comfortable with such a call upon a close below the $59.85, Dec. 6 high, which would include a close below the psychological round number.
Trading Strategies
Conservative traders should wait for evidence of support at the bottom of the channel or, upon a blowout, above the channel, for a long position, along with the medium-term rising trend.
Moderate traders may short upon a close below $59.85.
Aggressive traders may short now, providing they understand the risks and have their preset entries and exits in place that allow a worthwhile risk-reward ratio.
Trade Sample
