Walmart halts H-1B visa offers amid Trump’s $100,000 fee increase - Bloomberg

This article was written exclusively for Investing,com.
- Coal rises to a new record high
- Natural gas comes within a stone’s throw of the February 2014 peak before correcting
- Coal fundamentals are bullish - Tight supplies and rising demand
- Natural gas inventories are low going into the peak season
- Russia flexes its energy muscles - Natural gas “put in” a bearish reversal on the day President Putin promised supplies for Europe
Over the first nine months of 2021, energy commodity prices soared. It is hard to believe that crude oil, natural gas, and coal fell to unthinkable levels over the first half of 2020. NYMEX crude oil plunged in April 2020, briefly trading below zero for the first time and reaching under negative $40 per barrel. With no storage capacity, owners had to pay dearly to have others take the landlocked crude oil off their hands.
Seaborne Brent crude oil hit the lowest price of this century as the price found a bottom at $16 per barrel. Thermal coal for delivery in Rotterdam, the Netherlands, fell to a low of $38.45 per ton, the lowest level in decades. Natural gas dropped to $1.432 per MMBtu, a level not seen in a quarter of a decade since 1995.
The cure for low prices in commodities is those low prices. In 2021, energy prices have soared. Over the nine months from January through September 2021, the traditional energy commodities posted impressive gains:
- Coal moved 216.88% higher since the end of 2020
- Natural gas was up 131.08% over the past nine months
- NYMEX crude oil futures gained 54.64%, and Brent crude oil futures moved 51.52% higher over the period
The bull continued to roar in the energy sector that moved to even higher highs during the early days of October before correcting.
Coal rises to a new record high
Coal has been a four-letter word in the energy sector as the carbon footprint became a target for environmentalists. Meanwhile, coal was the best-performing fossil fuel in Q3 and so far in 2021.
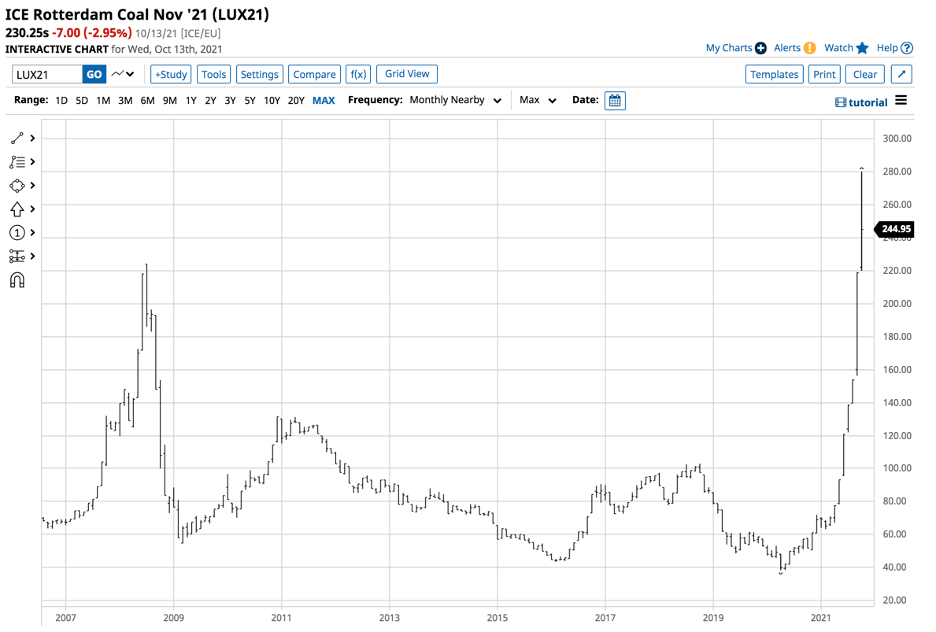
Source: Barchart
Thermal coal for delivery in Rotterdam, the Netherlands, rose to a high of $218.65 per ton in September. The high was just below the 2008 record peak at $224. In early October, coal blew through the 2008 high as a hot knife goes through butter, reaching the $280 level. On Oct. 13, the price was still above the 2008 peak after pulling back to the $230 per ton level.
Natural gas comes within a stone’s throw of the February 2014 peak before correcting
Trading natural gas futures can be like riding a psychotic horse through a burning barn. Since futures began trading on NYMEX in 1990, the price has been as low as $1.02 and as high as $15.65 per MMBtu.
After trading to a low of $1.432 per MMBtu in late June 2020, the price moved to its most recent high on Oct. 6.
Source: CQG
The chart shows the rise to a high of $6.466 per MMBtu on Oct. 6, which was only 2.70 cents below the February 2014 high of $6.493. Natural gas corrected from the high and was at the $5.59 level on Oct. 13. The energy commodity was still over 3.9 times the level at the June 2020 low.
Coal fundamentals are bullish - Tight supplies and rising demand
Coal is experiencing an almost perfect bullish storm. On the demand side, China and India, the world’s most populous countries, continue to depend on coal for power. Coal is a primary ingredient in electricity generation in the parts of the world that are home to over 2.8 billion people or over one-third of the global population.
On the supply side, addressing climate change has caused many mining companies to abandon production, creating a coal shortage. Rising crude oil and natural gas prices only put more upside pressure on coal demand as it is an inexpensive alternative to the other hydrocarbons. Tight supplies and increasing demand create a potent bullish cocktail for the most despised fossil fuel.
Natural gas inventories are low going into the peak season
Natural gas rose to its highest price since February 2014 as shortages in Europe and Asia have pushed the price to record levels. Meanwhile, the US has been shipping LNG abroad in increasing quantities, which siphons off the amounts going into storage for the upcoming winter season, the peak time of the year for natural gas demand. Natural gas futures prices tend to rise from November through February during the uncertainty of the winter temperatures. A cold start to the winter season tends to push natural gas prices higher. Winter came very early this year as the price moved to the $6.466 per MMBtu high. A cold winter may cause even more explosive action in the natural gas futures arena as we move into the peak season with lower supplies than in the past years.

Source: EIA
As the chart highlights, the Energy Information Administration reported that natural gas in storage across the US was 13.9% below last year’s level and 5.1% under the five-year average as of the week ending on Oct. 1. Inventories are below the levels in all regions, with the most significant gaps in the pacific states.
Below-average temperatures over the coming weeks would likely reignite natural gas on the upside after the recent decline.
Russia flexes its energy muscles - Natural gas 'put in' a bearish reversal on the day President Putin promised supplies for Europe
On Oct. 6, Russian President Putin pledged to supply Europe with natural gas over the coming winter season. However, the Russian leader neglected to tell Europeans how much he would be charging for the energy commodity. European and Asian natural gas prices have risen to record highs over the past weeks, far above the all-time $15.65 per MMBtu high in the US natural gas futures market.
Meanwhile, the pledge from Russia took some pressure off the futures market, which 'put in' a bearish reversal pattern on the daily chart on Oct. 6, the day of President Putin’s pledge.
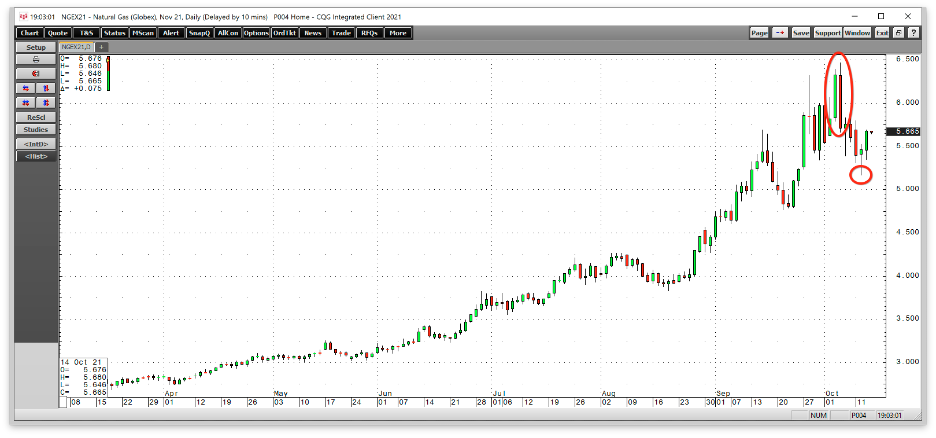
Source: CQG
As the chart highlights, natural gas rose to a new high on Oct. 6 and closed below the previous day’s lows, putting in a bearish key reversal trading pattern on the daily chart. The price followed through on the downside, correcting to below the $5.20 level on Oct. 12 before bouncing higher. Technical support for the November futures stands at the Sept. 21 $4.766 low, with resistance at the Oct. 6 high, and the February 2014 $6.493 per MMBtu long-term peak.
In Q3, the energy sector excluding coal moved 8.76% higher. Over the first nine months of 2021, it posted a 64.07% gain. Crude oil, oil products, and ethanol prices are higher than the September 30 closing levels in mid-October. Natural gas has corrected lower from the $5.867 to the $5.59 level. Meanwhile, energy commodities remain in bullish trends. Energy has been the leading sector in 2021, and that looks likely to continue. US energy policy is taking a greener path, weighing on output. Inflationary pressures continue to rise. OPEC and Russia are likely to look to squeeze consumers, and global demand continues to increase. Rising demand and falling supplies is a fundamentally bullish cocktail that could mean the rallies in fossil fuels and all energy products are just getting started.