Apple investigating outages affecting Apple TV+, Apple Music services
For almost as long as the terms precious metals and safe-haven have been around, gold has ruled the roost for both, with silver playing second fiddle. After gold’s struggle with $1,900 levels over the past month, silver has started marching somewhat to its own drummer, prompting the question: are the two metals divorcing?
It’s too early to tell.
If anything, silver’s relatively better performance against gold since mid-May may just fizzle over the next couple of weeks, or even faster.
But the numbers in silver’s favor—with two weekly losses out of three, and a net loss of 0.9%, compared with gold’s three weekly losses, and a net drop of 2.1%—may lend credence to something else: industrial demand.

All charts courtesy of S.K. Dixit Charting

Like gold, silver has a fundamental story too, an industrial one, really. It reigns as the number one metal for electrical and thermal conductivity.
And nowhere is the industrial emphasis on silver greater than in the Green New Deal of President Joseph Biden.
Biden is targeting net-zero emissions by 2050 and intends to spend $1.7 trillion in federal money, and leverage an additional $5 trillion in private sector and local investment funds for the so-called Green New Deal.
In that world, silver is the “real gold,” enabling a green economy of solar panels that will light up and power homes and buildings and serve as a conduit for batteries that will run our electric vehicles, just to name a few.
But that world is also a futuristic one built on hypothesis. The real deal is where silver is trading today versus gold. It's based on the price ratio between the two metals that tells of silver’s independent value—i.e., the smaller the ratio, the better for silver.
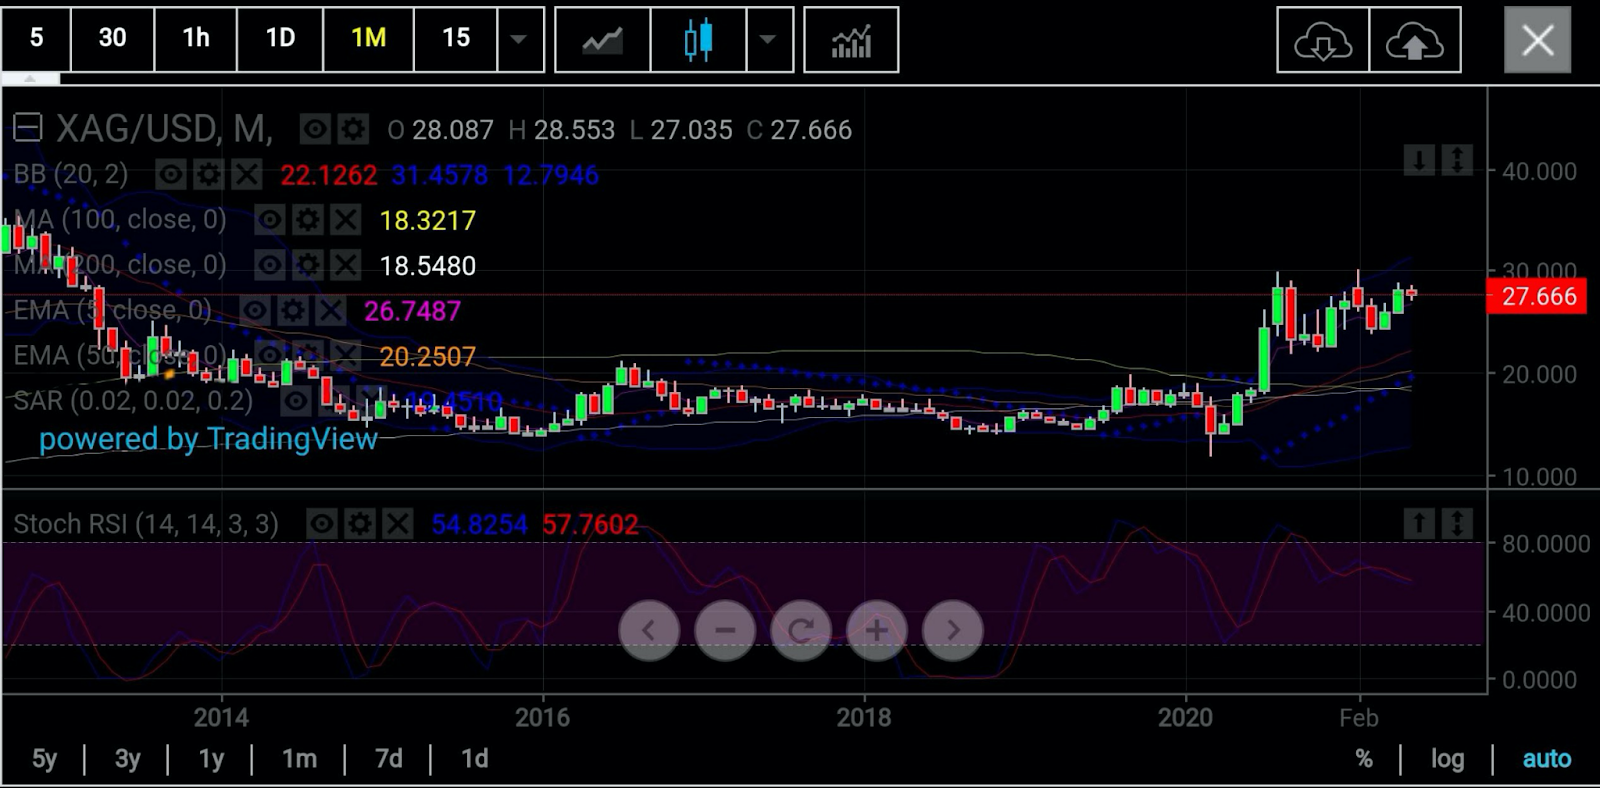
Silver has managed to hold on to the key $27 per ounce level during the turbulence of the past three weeks.
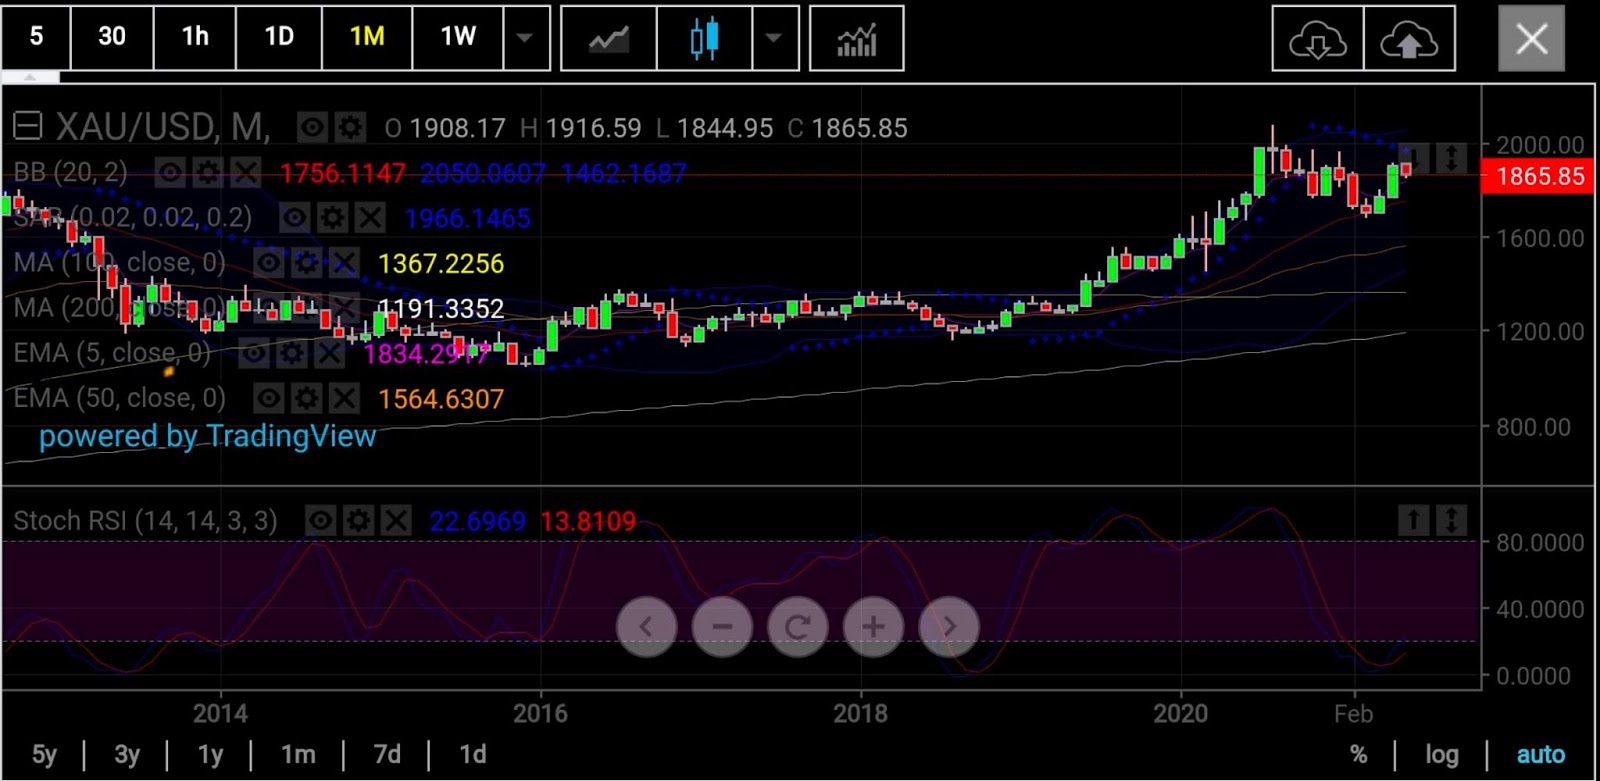
Gold, in contrast, hit one-month lows beneath $1,850 an ounce on Monday as speculators shorted the yellow metal on rising conviction that the Federal Reserve would indicate at its policy meeting this week some kind of timetable for the tapering of its asset purchases to support the US economy.
The gold-silver ratio (the amount of silver an ounce of gold could buy) was at 67, although its propensity to fall was a lot greater.
If silver continues climbing, how high can it go?
Investing.com’s Daily Technical Outlook has a “Neutral” call on the spot price of silver, which was trading at $27.71 at the time of writing.
It suggests near term peaks of between $27.92 and $28.87, depending on which of its top two variants—Fibonacci or Classic—that appeals to market participants. Under the Fibonacci model, the near-term high for silver is in a range of between $27.92 and $28.87. In the Classic mode, the peak could be between $27.92 and $28.51.
A technical analysis by consultancy S.K. Dixit Charting shows that if spot silver manages to prevent a breakdown, it could reach $31.50.
Sunil Kumar Dixit, chief chartist at the firm, told Investing.com:
“The weekly chart Stochastic RSI, or Relative Strength Index, is overbought with a reading 93/96."
“But it still has some room for further breaking above $28.50 to retest the $30 horizontal resistance and aim for $31.50. All the way, the weekly middle Bollinger® Band has been supportive at $26.60.”
With the spot price of gold, the Stochastic RSI in the daily chart was extremely oversold, said Dixit.
“The reading of 0/8 suggests imminent reversal with initial targets of $1,875-$1,888 before any new attempt to decline.”
He added that the 50-Day EMA, or Exponential Moving Average, of $1,843 is crossing the 200-Day SMA, or Simple Moving Average, of $1,838 from below which signals positive moves.
Disclaimer: Barani Krishnan uses a range of views outside his own to bring diversity to his analysis of any market. For neutrality, he sometimes presents contrarian views and market variables. He does not hold a position in the commodities and securities he writes about.
