Elastic launches GPU-accelerated inference service for AI workflows
- Palantir remains highly valued with a 460x P/E ratio and a 42.5x P/B ratio, far above its peers.
- The stock's beta of 2.81 signals high volatility, meaning sharp moves in both directions.
- Fair Value estimates place Palantir at $58.99, 33.7% below its recent close, with analysts targeting $87.38.
- Get the AI-powered list of stock picks that smashed the S&P 500 in 2024 for half price as part of our FLASH SALE.
After reaching an all-time high of $125 on February 18, Palantir (NASDAQ:PLTR) shares dropped over 28% in just a few sessions, falling to $90.68 by February 25. As of this writing, the stock is down 30% in just five sessions—a sharp drop, especially for recent buyers caught up in the market euphoria.
The spark came from news that the Pentagon plans to cut US military spending by 8% in the coming years. Since government contracts made up about 40% of Palantir's 2024 revenue, investors grew concerned about the impact of a smaller defense budget.
The big question now—should investors steer clear, given the risk of catching a falling knife, or is there a chance for a rebound?
How to Protect Your Portfolio from Sudden Sell-Offs
Judging a stock solely by its recent performance is risky. No one can predict whether it will plunge further or stage a comeback.
However, certain key indicators should always be considered before investing. Ignoring them and jumping in just because of market hype is no different from gambling.
With InvestingPro’s ProTips, identifying these crucial factors becomes much easier. Here are a few to keep in mind.
Understanding the Price/Earnings Ratio and What It Signals
Source: InvestingPro
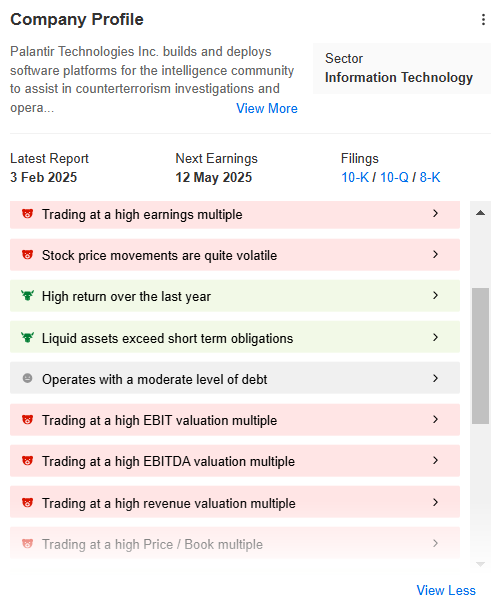
For instance, a high price-to-earnings (P/E) ratio means investors are paying a premium for each dollar of company earnings. Generally, a high P/E is seen as a bearish signal, suggesting the stock might be overvalued and vulnerable to a correction.
In Palantir’s case, even after its recent decline, the P/E ratio stands at 460x. By comparison, Tesla—often considered overinflated—has a P/E below 150x, while Nvidia’s sits at just 50x.
Understanding the P/B Ratio
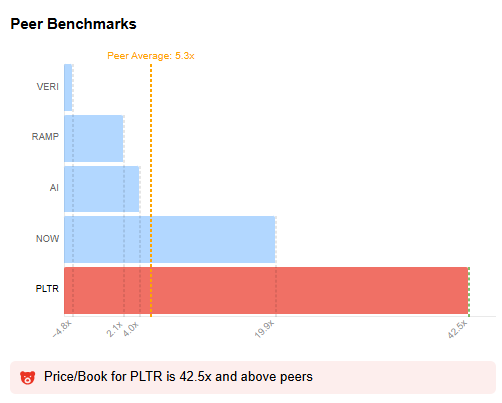
Another red flag is the stock's high price relative to its book value, reflected in an elevated Price-to-Book (P/B) ratio.
Source: InvestingPro
In Palantir's case, the P/B ratio stands at 42.5x, compared to 5.3x for its competitors.
Measuring Volatility
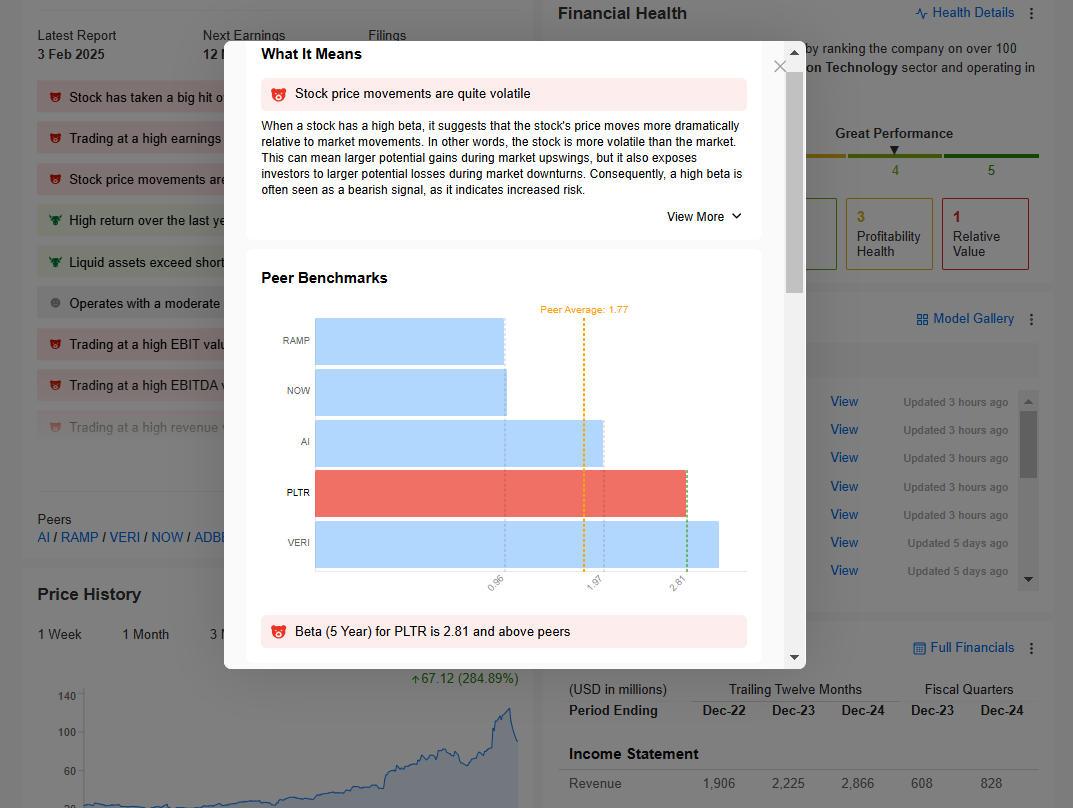
To assess the risk of investing in a stock, it is important to consider its beta. A high beta means the stock moves more dramatically than the market, leading to greater potential gains in uptrends but also higher losses during downturns. This heightened volatility signals increased investment risk.
Source: InvestingPro
Palantir's average beta is 2.81, significantly higher than its competitors' average of 1.77. This indicates that Palantir's stock is more volatile, making it riskier but also potentially more rewarding during market upswings.
What’s Next for Palantir Shares?
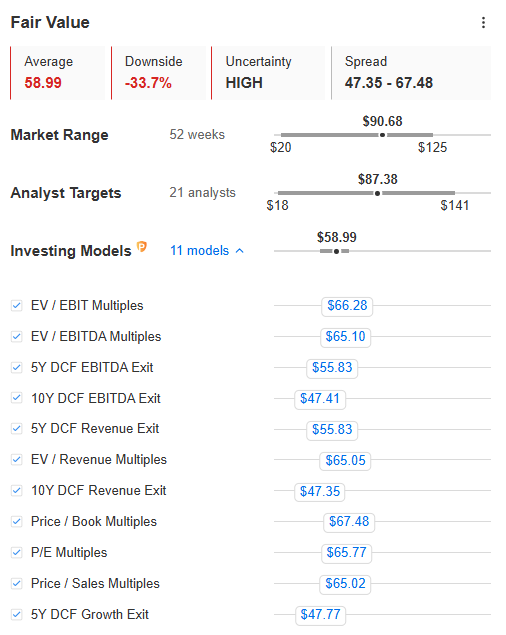
All of this data (which InvestingPro users can access here) suggests that Palantir remains overvalued. The most straightforward indicator to check is Fair Value, calculated by InvestingPro using 11 recognized financial models tailored to the stock.
Palantir Fair Value | Source: InvestingPro
As shown in the chart above, Palantir's intrinsic value is $58.99 per share, which is 33.7% lower than its February 24 closing price. Additionally, the 21 analysts covering the stock project further downside over the next 12 months, with a target price of $87.38.
Time to Hold or Head for the Exits?
The chart above highlights the high level of uncertainty surrounding Palantir. The future remains unpredictable, but the warning signs are clear. Entering now comes with significant risk—there is a chance of a rebound and solid gains, but the correction could continue. It is also worth noting that despite the recent drop, the stock is still up 280% over the past year.
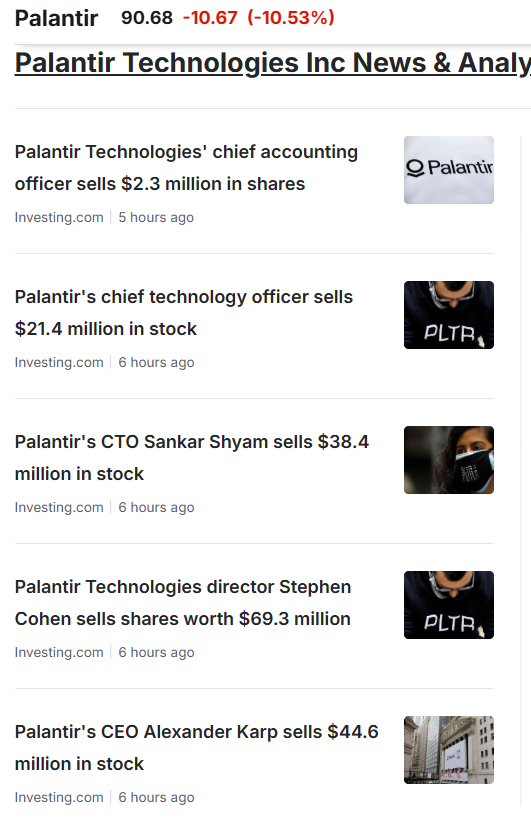
For risk-averse investors, staying on the sidelines might be the wiser choice. Many shareholders seem to share this sentiment, as evidenced by profit-taking in recent sessions, as reported by Investing.com. However, after Palantir’s remarkable 2024 rally, a 30% drop may not be cause for much regret.
Source: InvestingPro
The Importance of Diversifying
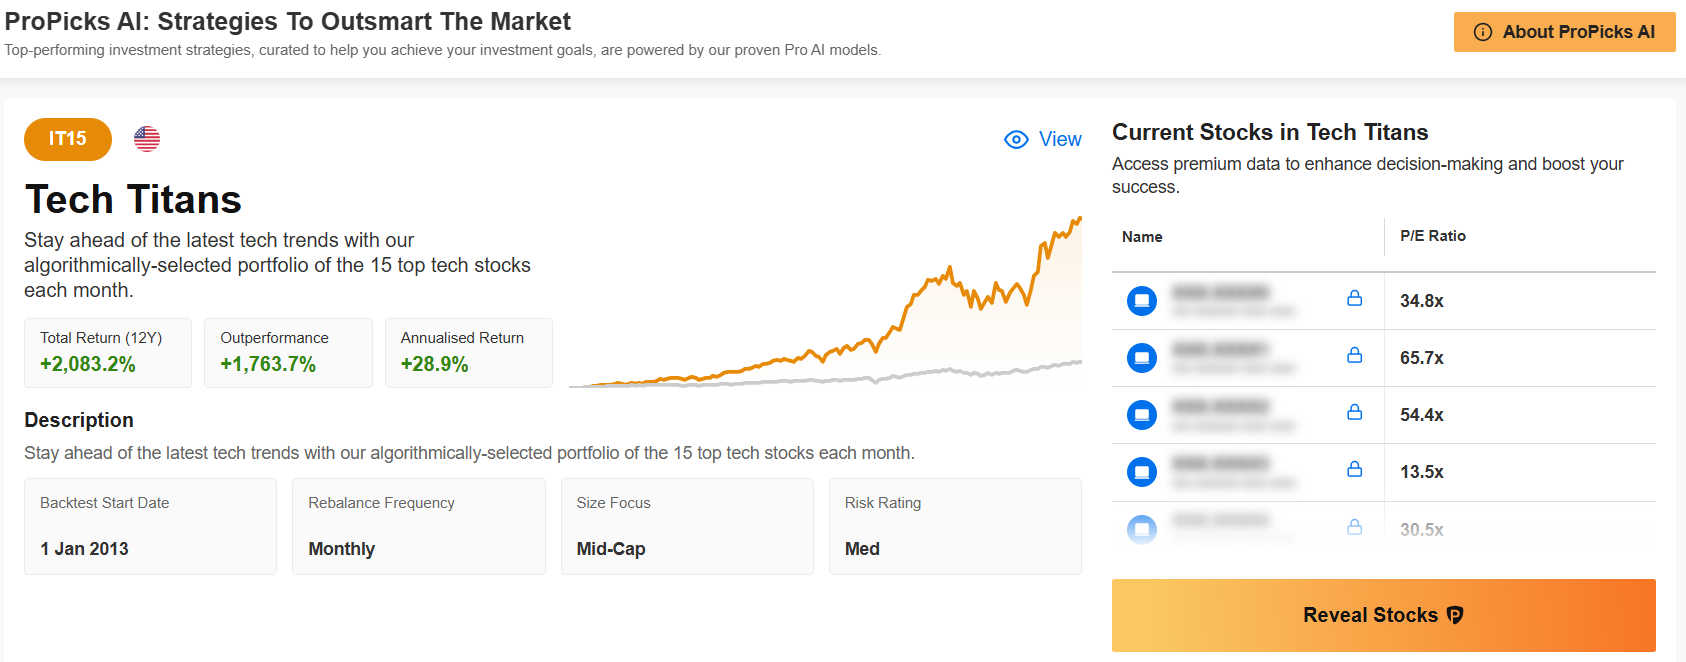
The best approach for investors is always diversification. For those looking to invest in top US tech companies, InvestingPro's ProPicks AI Tech Giants strategy offers a smart alternative. This strategy delivered a 42.7% return in 2024, outperforming the S&P 500's 23.3%. By updating its list of 15 stocks every month, it helps manage risk on high-beta stocks, identifying the best buys and the ones to avoid.
Want a tool to help you pick the best stocks to buy and sell when volatility rises? Try InvestingPro. Between advanced stock screeners, Fair Value and Propicks AI, the AI-driven strategies for beating the markets, InvestingPro is the tool for you.
Try it now, CLICK HERE and start investing like a PRO!
****
DISCLAIMER: This article is written for informational purposes only; it does not constitute a solicitation, offer, advice, counsel or recommendation to invest as such it is not intended to incentivize the purchase of assets in any way. As a reminder, any type of asset, is evaluated from multiple points of view and is highly risky and therefore, any investment decision and the associated risk remains with the investor
