Palantir shares slip by 7% despite posting record revenue in third quarter
- Today marks a year since the S&P 500 ended its bear market
- A lot has changed since then, but the US economy still hasn't entered recession
- The future might look bleak because of the current headwinds, but stocks still could end the year on a high
Exactly one year ago, the S&P 500 bottomed on the short-term bear market, which led it to fall by more than 20% from January to October 2022. On the following day (October 14, 2022), stocks reversed, closing with a +2.60% gain, and did not look back since.
The U.S. bond market has since gone from signaling an impending recession to signaling that interest rates will remain high for a longer period. This is due to a steepening yield curve, which is caused by long-dated yields rising faster than short-term yields.
Bonds Are the Greatest Risk Now
While a steepening yield curve is often seen as a sign of a recession, in this case, it is likely due to the still-strong U.S. economy and the Fed's outlook for higher rates. This is known as "bear steepening."
In other words, the bond market is signaling that the economy is still strong enough to withstand higher interest rates, but that those higher rates may eventually lead to a recession.
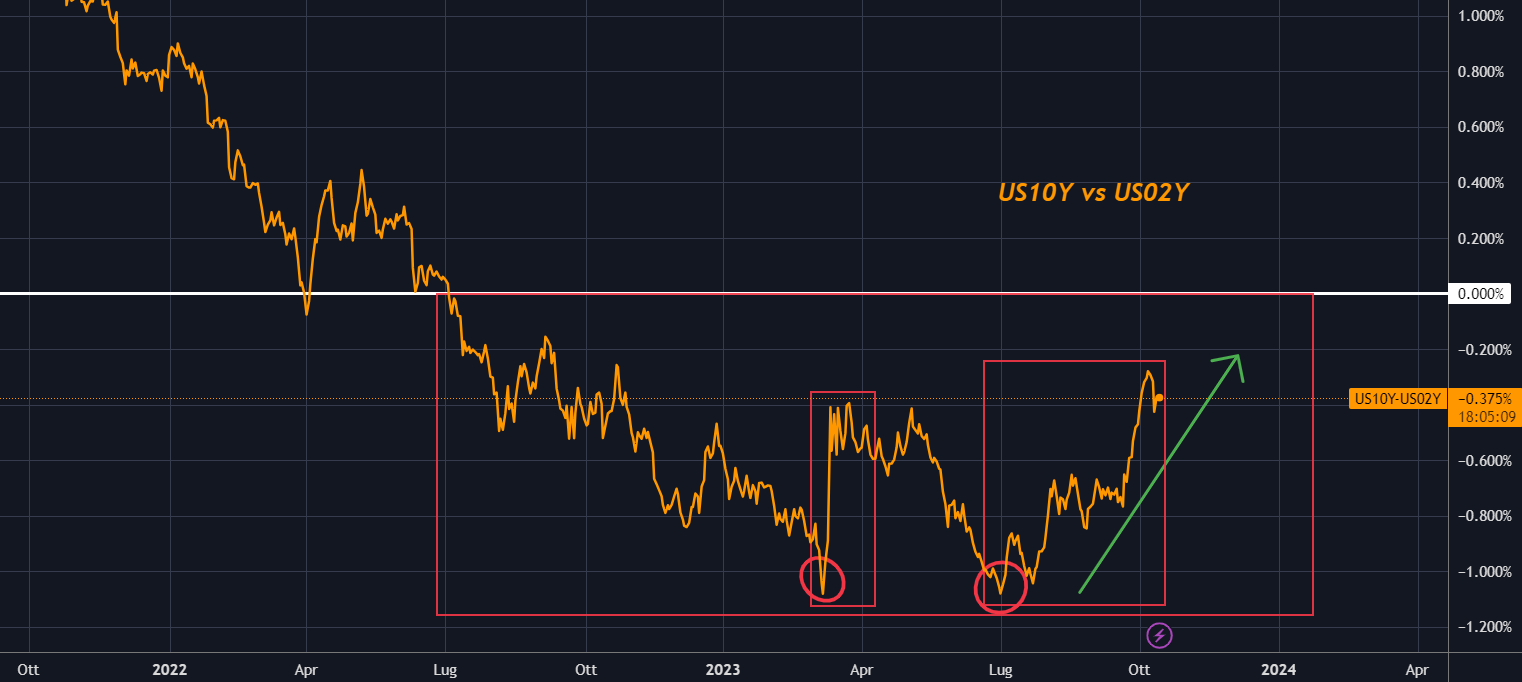
Visually, the steepening of the yield curve may appear as a positive sign, suggesting that the economy is at a relatively lower risk of a recession.
However, history offers a different perspective. In reality, when the yield curve experiences bear steepening, it typically implies that the market expects the Federal Reserve to delay interest rate cuts.
As a result, long-term yields, which reflect these expectations, rise at a faster pace compared to short-term yields.
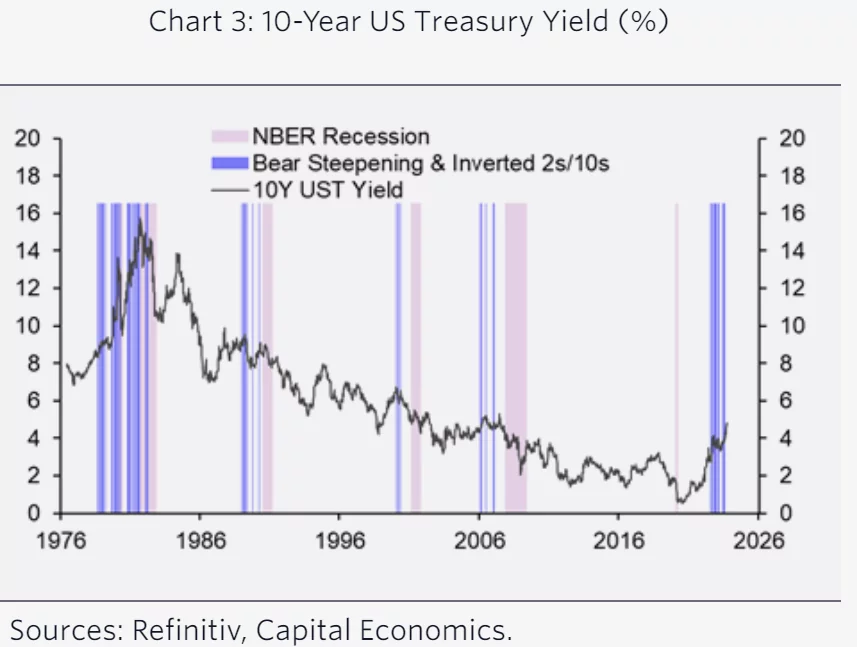
Source: Refinitiv, Cepital Economics
As depicted in the chart, this event is quite uncommon, and when it does happen, it has historically had a significantly higher likelihood of being followed by a recession.
In fact, these previous occurrences were typically succeeded by substantial decreases in long-term U.S. government bond yields and more stringent financial conditions.
Is the S&P 500 on Track for a New All-Time High?
Over the past few months, the negative correlation between stocks and the U.S. dollar has been particularly robust. Those who have attempted to go against this trend have generally faced unfavorable outcomes.
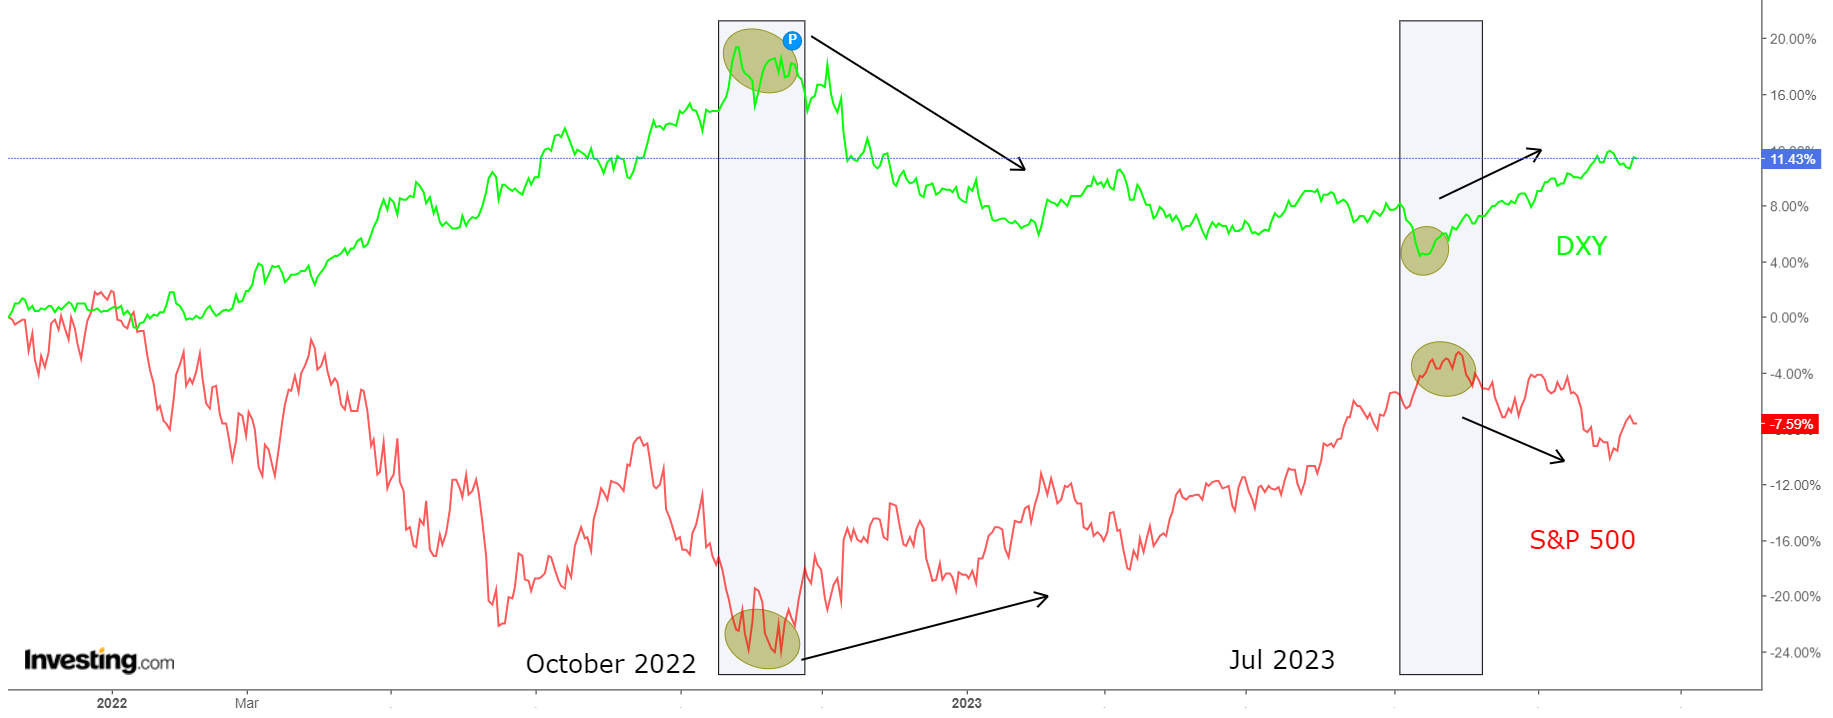
Suffice it to say that the S&P 500 recorded new 52-week highs in July, exactly the same period when the dollar hit lows.
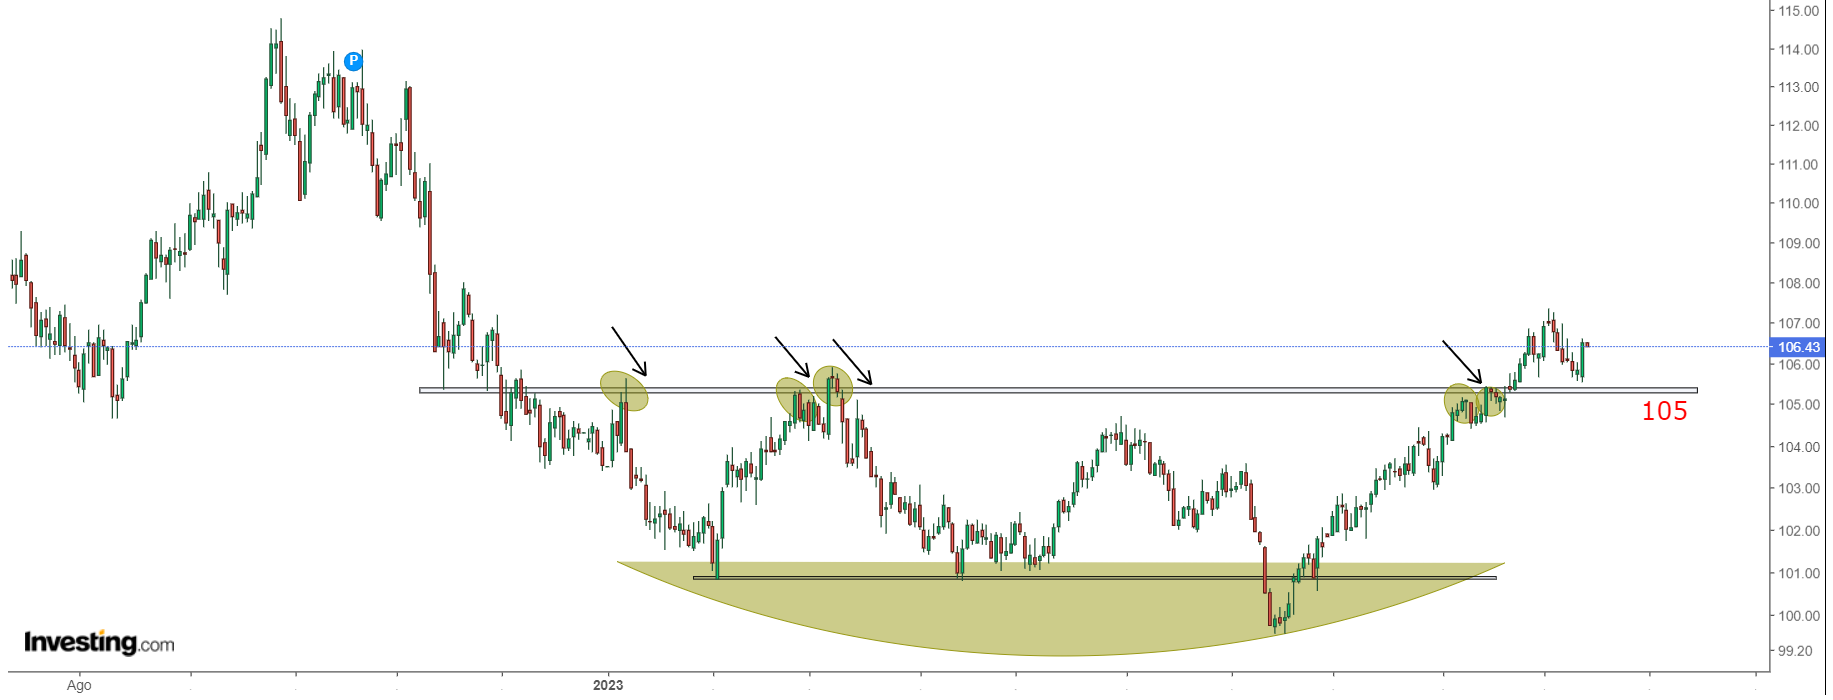
Subsequently, the dollar has managed to record positive gains for 11 consecutive weeks, and this trend, which has seen equities go down instead, will not abate until levels return below 105.
In addition, other sectors have also taken a definite direction, such as technology. The Invesco S&P 500 Equal Weight Technology ETF (NYSE:RSPT) index has broken through a 3-year resistance relative to the Invesco S&P 500® Equal Weight ETF (NYSE:RSP).

In fact, after lateralization, it recorded new highs compared to previous highs of 2020-2021 breaking resistance at the 0.20 level. If the trend is confirmed, we could expect outperformance and momentum in equities from tech stocks in the coming months.
This is also possible statistically; in fact, the S&P 500 Index has not recorded an all-time high since 2022. This period is equivalent to 445 trading days, a series that has been repeated only 7 other times since 1955. After this, it took an average of 18 months (547 days) for new all-time highs, and as of today, there are about 3 months still to go.
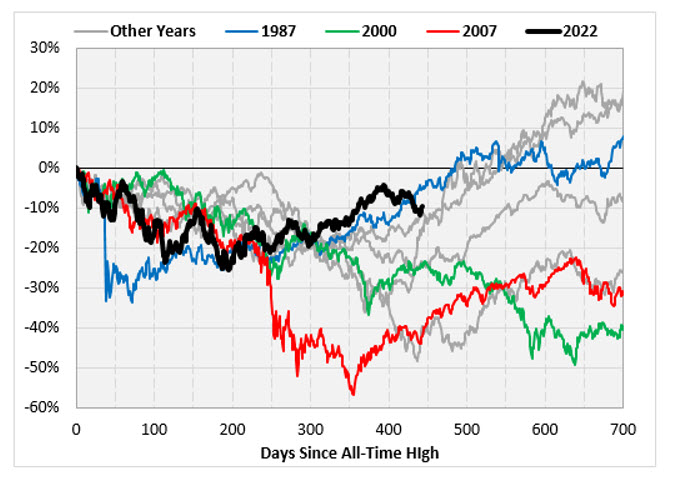
So how is the market doing?
Things are not as bad as some might have you believe. Based on this, it is not unreasonable to be positive for the coming months.
***
Disclaimer: This article is written for informational purposes only; it does not constitute a solicitation, offer, advice, or recommendation to invest as such it is not intended to incentivize the purchase of assets in any way. I would like to remind you that any type of asset, is evaluated from multiple points of view and is highly risky and therefore, any investment decision and the associated risk remains with the investor.

