Intel closes 23% higher after Nvidia takes $5B stake

In our previous update, see here, we observed the S&P 500 (SPX) ideally reaching $ 6,125 ± 25, $ 6,000 ± 25, and $6,150-$6,200 for a minor 3rd, 4th, and 5th wave, respectively, based on a standard Fibonacci Elliott Wave (EW) Principle roadmap. Since all we can do is “anticipate, monitor, and adjust if necessary,” we adapted an ending diagonal roadmap on June 6 as the price action progressed. This adjustment meant the price targets were modified to “Ideal target zones are, for W-iii: 6025-6060, W-iv, 5960+/-20, W-v, 6125-50.” The SPX reached $6059 on June 11, bottomed out at $5963, and stalled at $6051 on Monday.
However, the index has made little progress since then and is pretty much back to the price levels from around mid-May (5960s). This suggests that a slightly larger top, grey W-iii/c, as shown in Figure 1 below, may have been struck, which aligns with post-election year seasonality starting in 1928.
Figure 1. Post-election year seasonality vs. our preferred short-term Elliott Wave count.
 Specifically, 2025 is a post-election year for the U.S. presidency, and year-to-date, the index has closely followed the average of all post-election years since 1928, as indicated by the blue arrows. There are some timing differences, such as the late-February low compared to the actual mid-March low (green W-a) and the absence of the late-April (grey W-ii) low, which are to be expected; however, the overall pattern remains similar.
Moreover, closer to home, the seasonality forecast indicated a high between June 8 and June 12 and a low between June 16 and June 22, as illustrated by the red circles in Figure 1 above. As previously mentioned, the index peaked on June 11, hit a low on June 13, and has since returned to its prior level. So far, so good. Therefore, assuming the correlation holds, we can look further ahead, anticipating a low in the coming days followed by a 4- to 6-week rally.
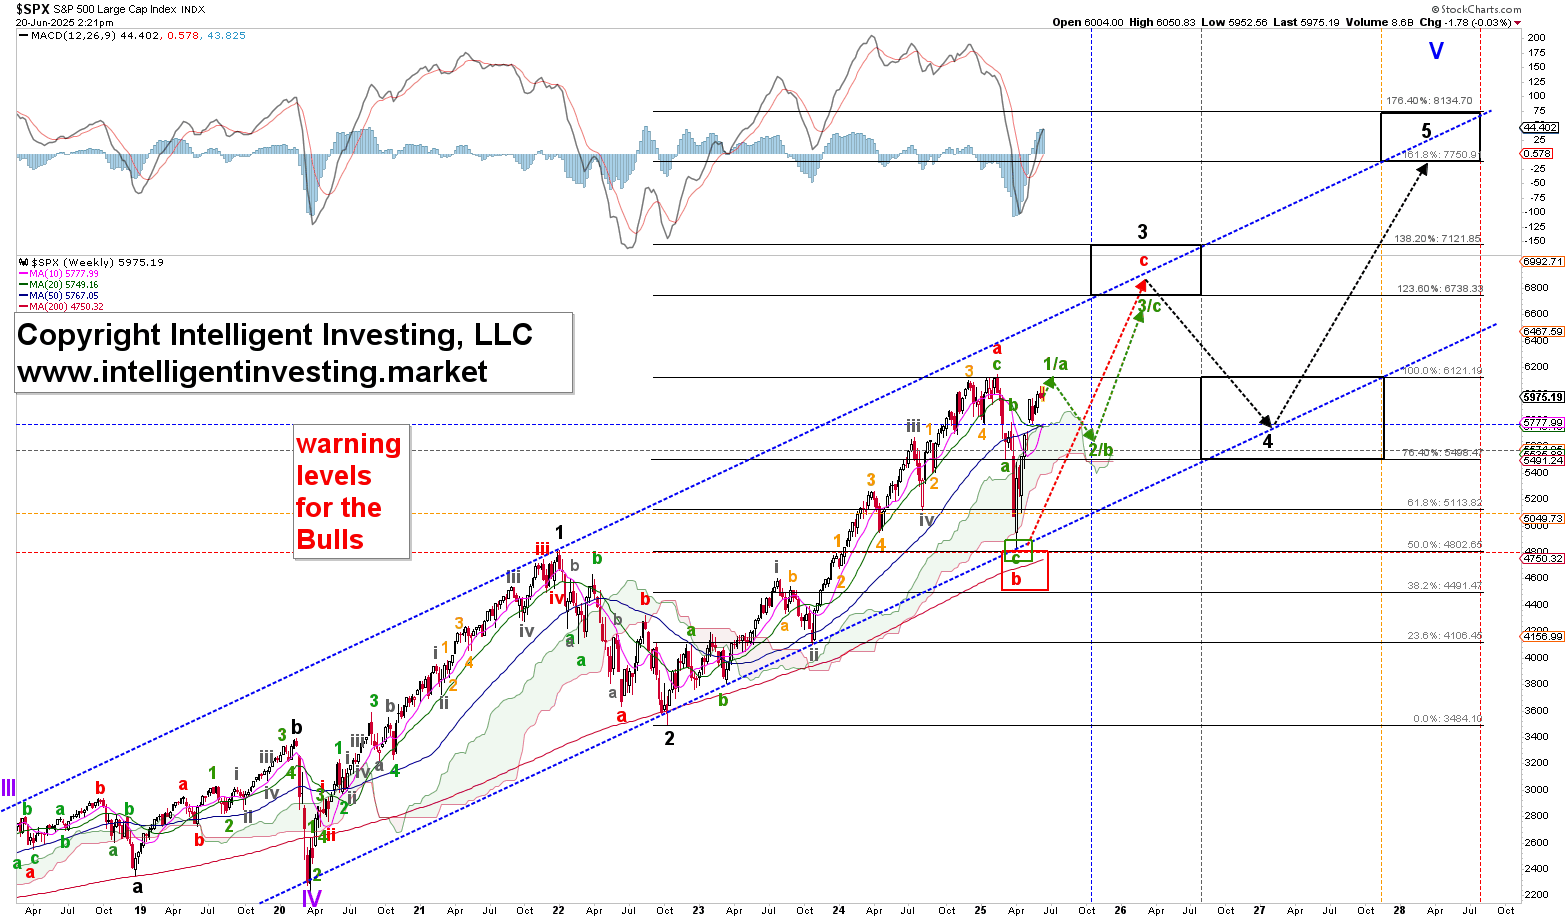
This should complete the green W-1/a, and we can expect a multi-month pullback for the green W-2/b to SPX5400-5600. Once this target is reached, we still anticipate the index will reach $6700-7100, as the rally from the 2020 low has yet to finish. This seasonally based path from the short- to the long-term aligns with the broader EW count we shared in our recent updates. See, for example, our previous article and Figure 2 below.
Figure 2. The SPX weekly chart with our preferred EW count.