Street Calls of the Week
This article was written exclusively for Investing.com
- Years as a precious metals laggard
- Technical break to the upside, but volatile trading around $1200 pivot point
- Platinum’s value proposition is compelling
- Liquidity is an issue
- PPLT the most liquid platinum ETF product
Platinum is a rare precious, and industrial metal. The vast majority of annual production comes from South Africa and Russia. In South Africa, production is primary, with mining companies extracting platinum from deep in the earth’s crust. In Russia, platinum output is mostly a byproduct of nickel production.
Platinum has a long history as a precious metal that is a store of value. For decades, platinum’s nickname was “rich person’s gold.” Meanwhile, platinum’s density and resistance to heat make it a critical industrial metal that cleanses toxins from the environment.
Platinum and platinum group metals (palladium and rhodium) are required in catalysts in automobiles, oil and petrochemical refineries, and other emission-producing areas. Platinum is also used in fiberglass manufacturing and jewelry; it even has pharmaceutical applications in chemotherapy drugs.
Over the past years, platinum lagged the other precious metals. However, in 2021, the price broke above the critical technical resistance level at the August 2016, $1199.50 high.
In 2020, platinum had declined to a low of $562 per ounce in mid-March as the global pandemic caused risk-off selling in markets across all asset classes. Last year, platinum fell to its lowest price in eighteen years. But in 2021, it traded to a six-and-one-half year high.
The Aberdeen Standard Physical Platinum Shares ETF (NYSE:PPLT) tracks the platinum price, holding its net assets in platinum bullion.
Years as a precious metals laggard
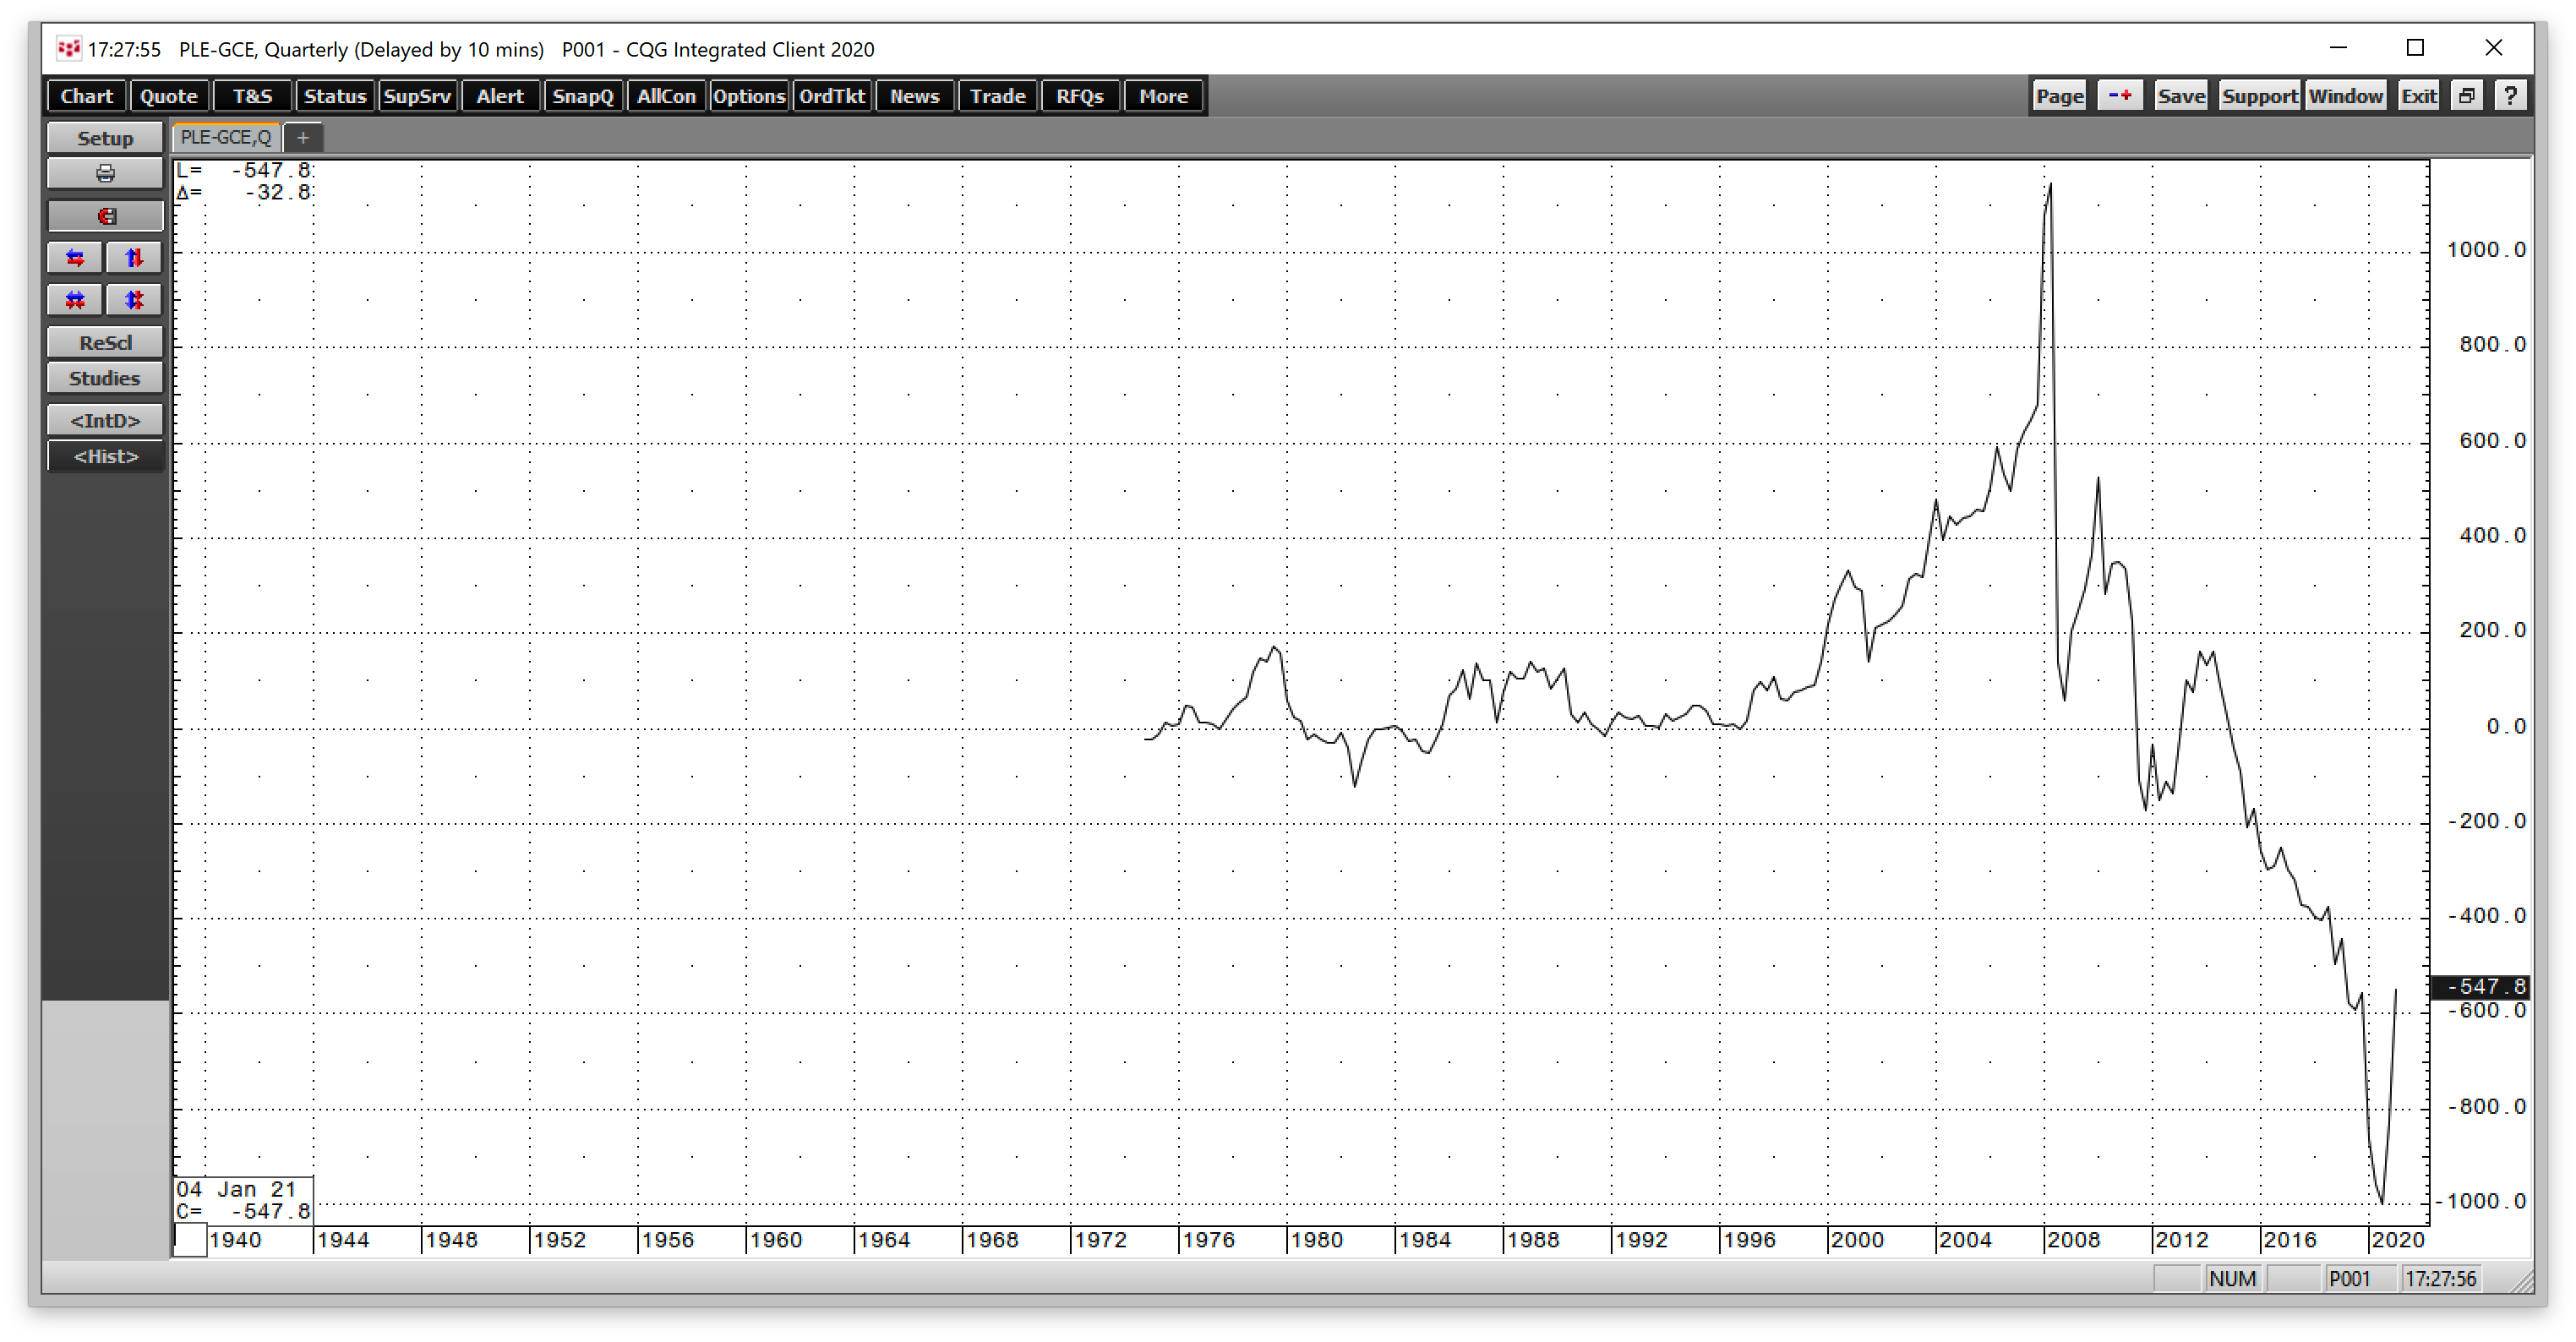
Platinum has been historically inexpensive compared to gold, palladium, and rhodium over the past years.
Source: CQG
The quarterly chart of platinum minus gold shows that before 2015, platinum had not traded below a $200 discount to gold since trading on the futures exchange began in the 1970s. In 2020, it fell to an over $1000 per ounce discount to the yellow metal.
At platinum’s all-time high in 2008, it was over $1100 more expensive than gold. On Friday, Mar. 19, platinum was $541.60 per ounce under the gold price.
Source: CQG
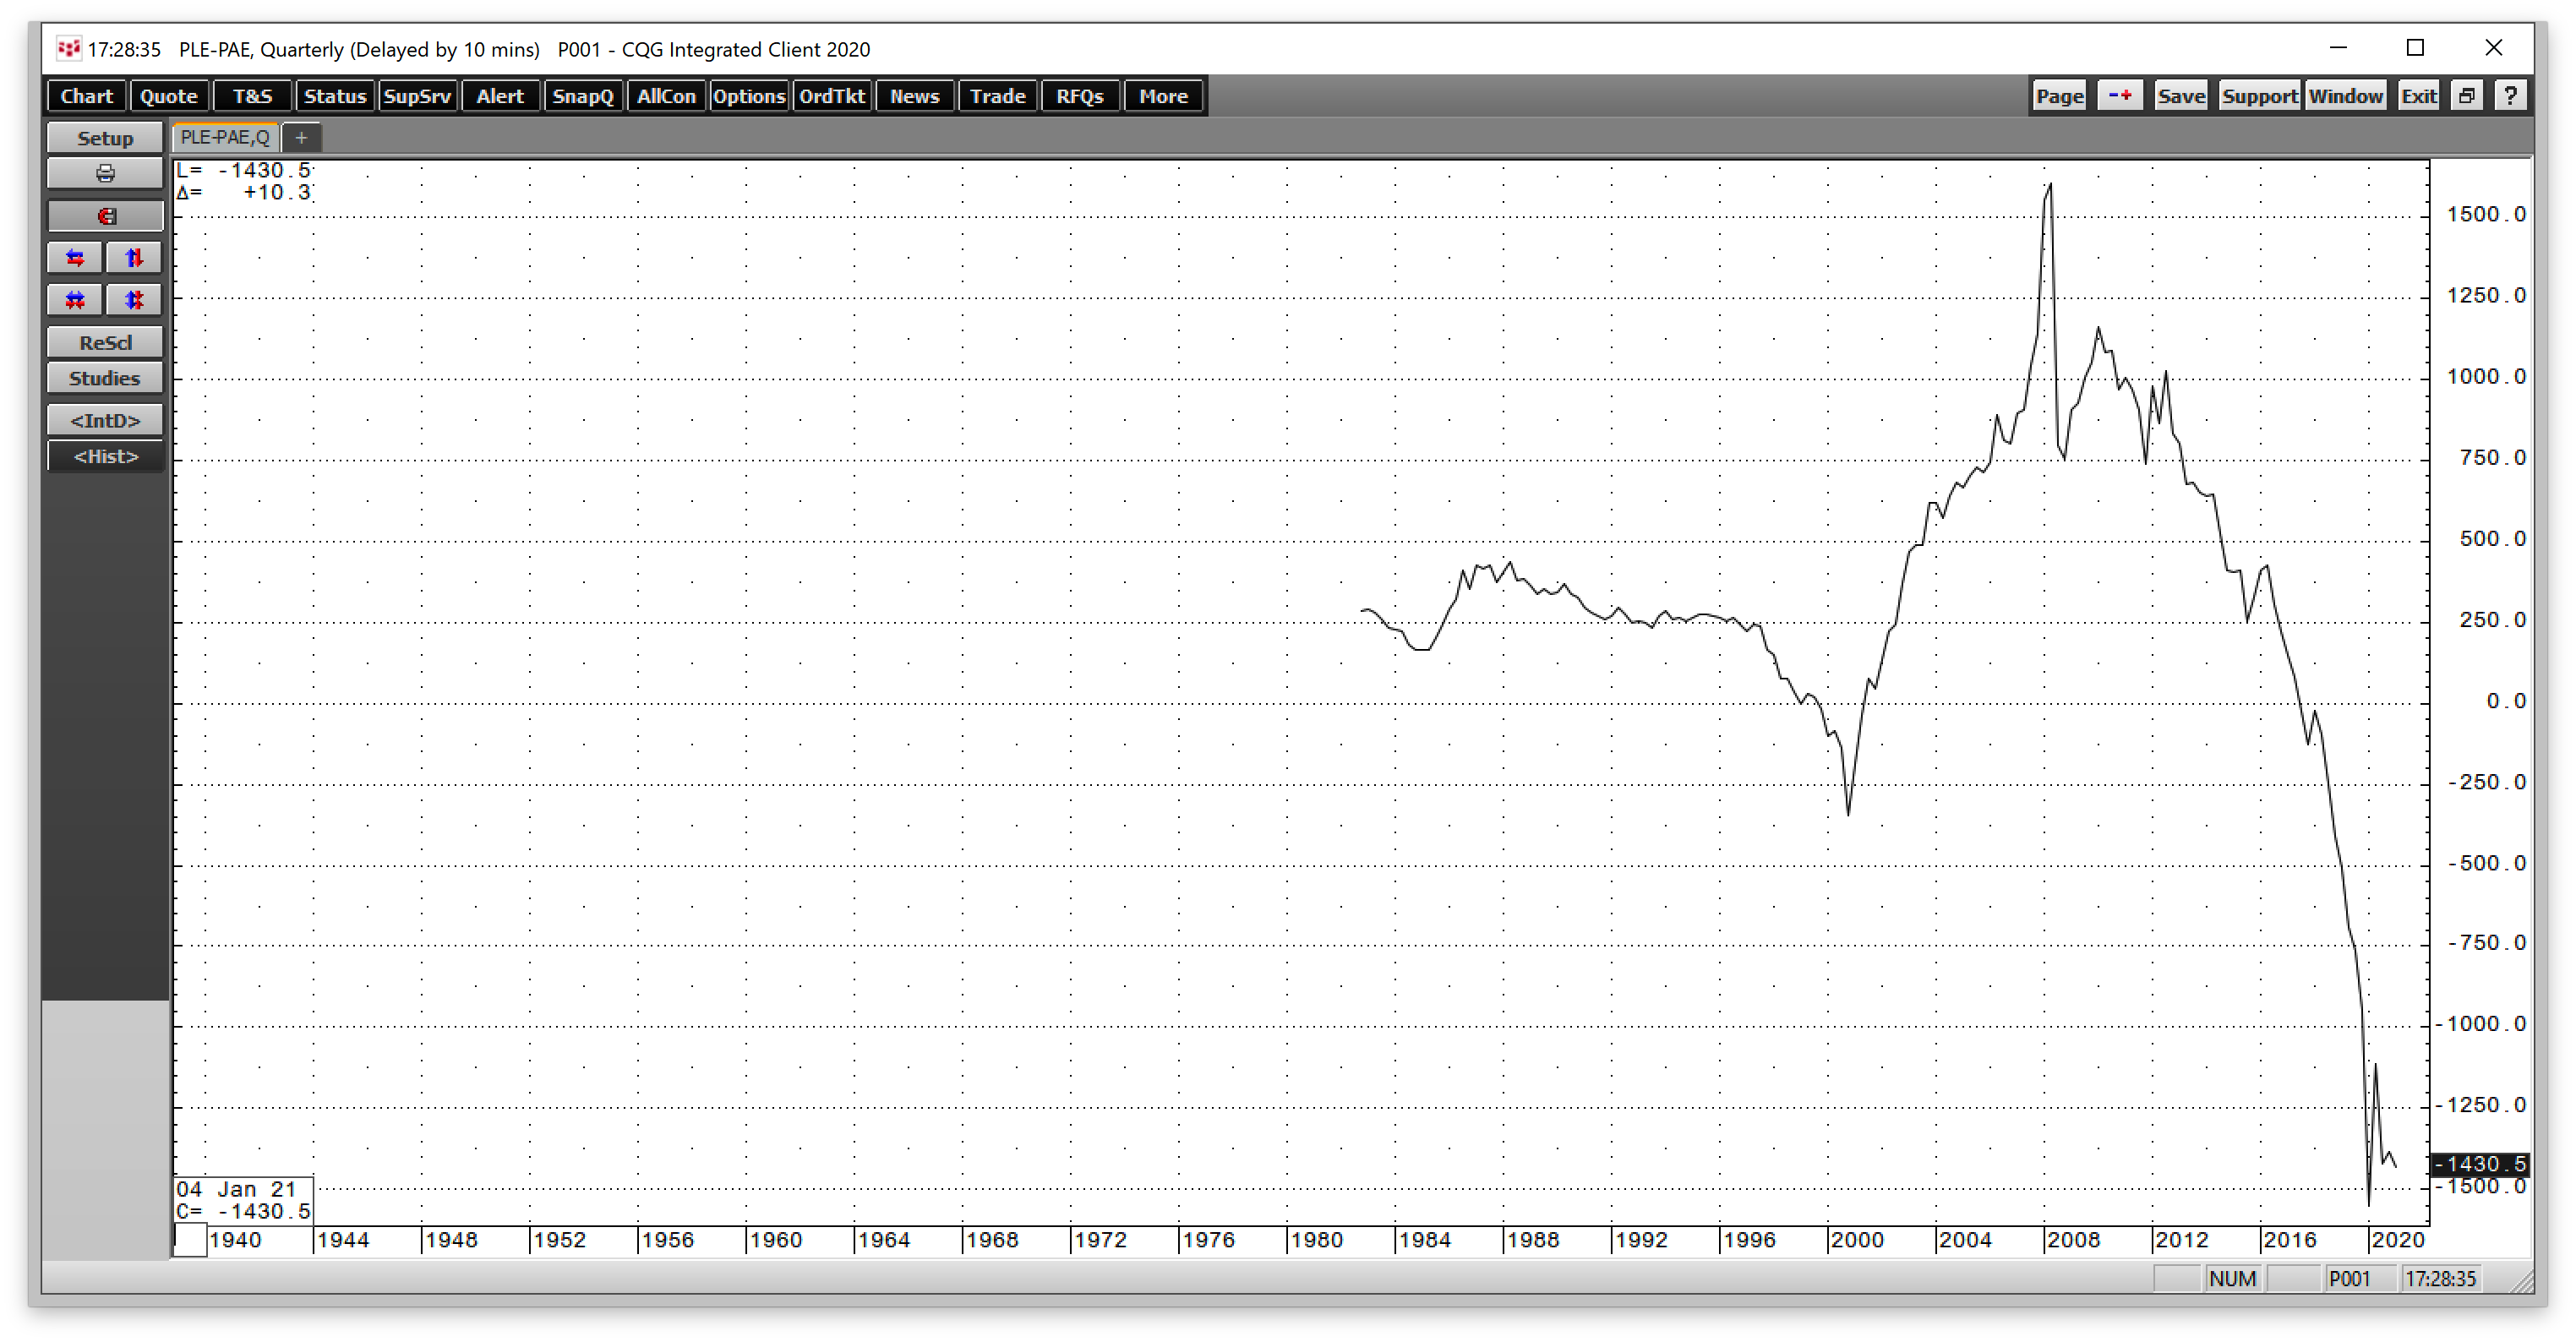
Before 2018, palladium never commanded more than a $350 premium to platinum. Platinum reached a premium of over $1600 per ounce against its sister platinum group metal (PGM) in 2008. In 2020, platinum fell to an over $1650 discount to palladium. On Mar. 19, palladium was over $1430 more expensive than platinum.
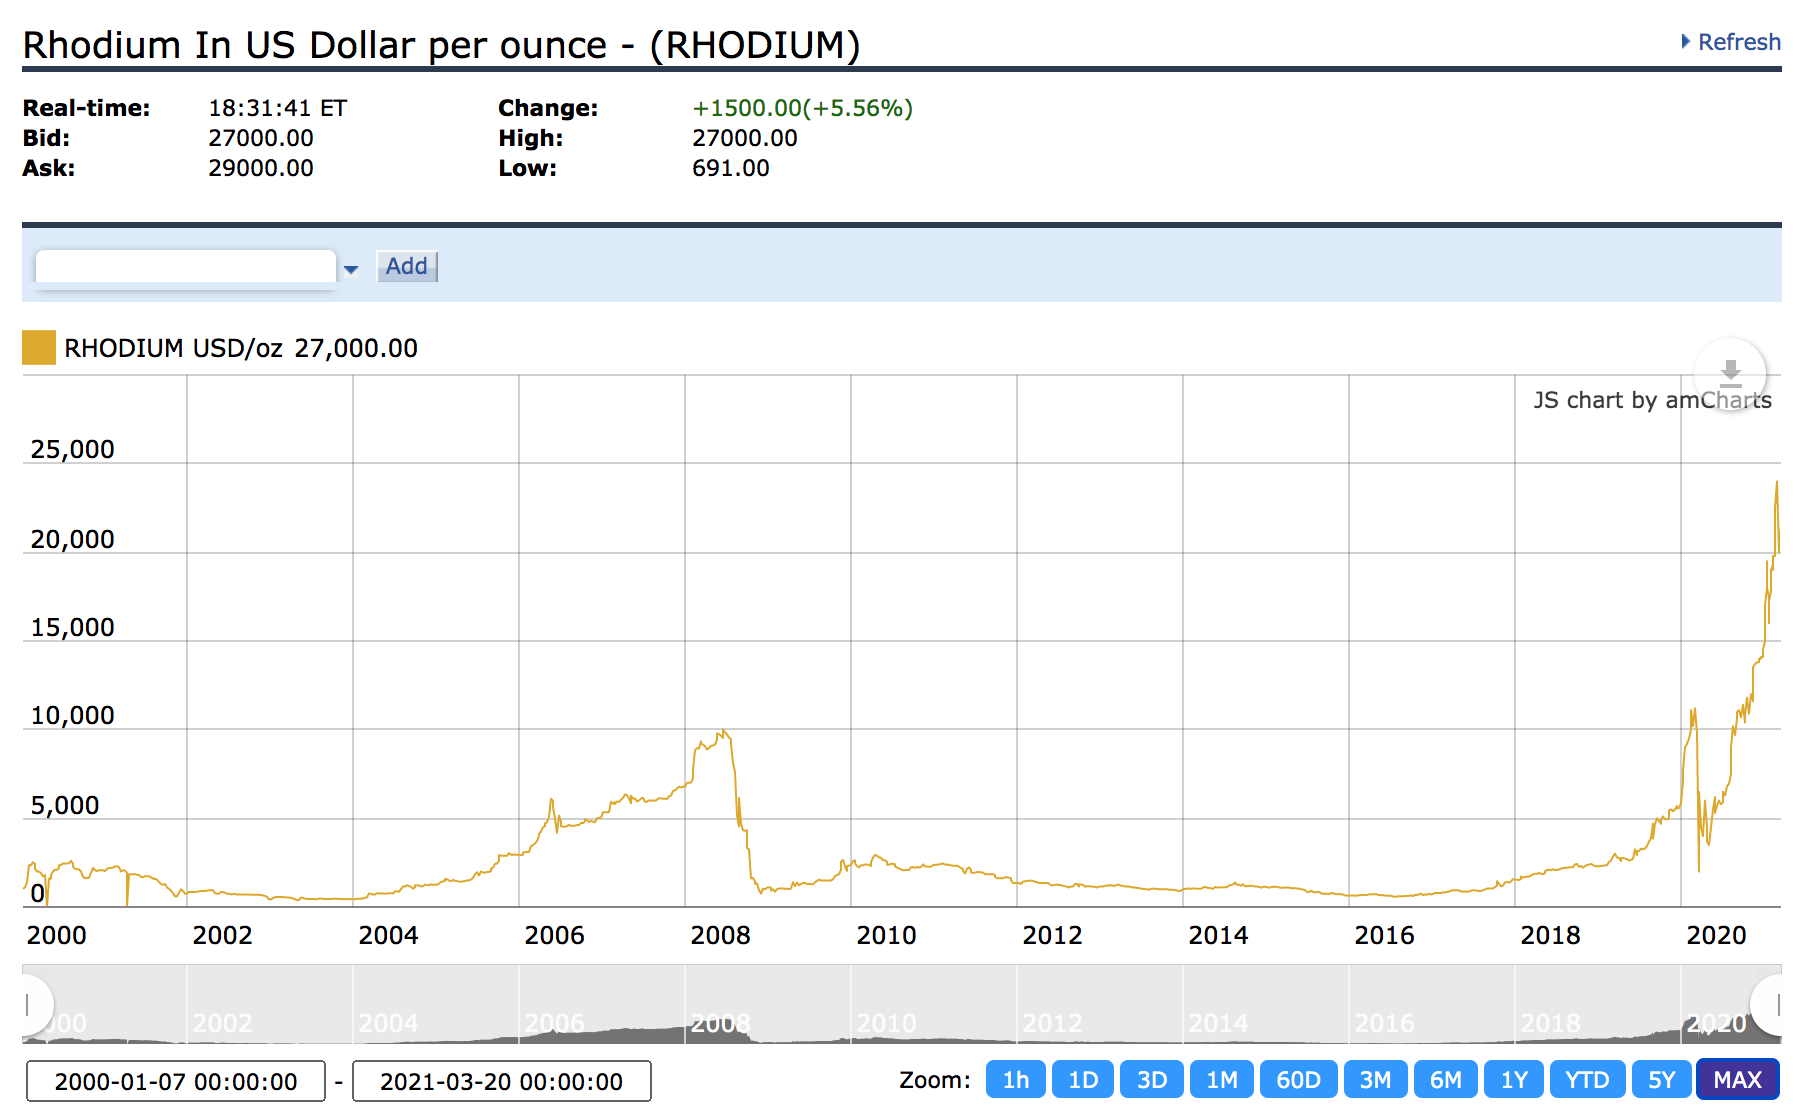
Rhodium is another PGM that only trades in the physical market. In 2016, platinum fell to a low of $812.20, and rhodium found a bottom at $575 per ounce. With platinum at the $1200 level at the end of last week, the premium for rhodium has been mind-blowing.
Source: Kitco
The chart above shows that with rhodium at a $28,000 midpoint on Mar. 19, it was at a nearly $26,800 per ounce premium to platinum. Ironically, rhodium is a byproduct of South African platinum output. The depressed platinum market over the past years led to lower production, which created a deficit in the rhodium market.
The bottom line is that platinum has been a laggard compared to gold and the other PGMs over the past years, but that could be changing.
Technical break to the upside, but volatile trading around $1200 pivot point
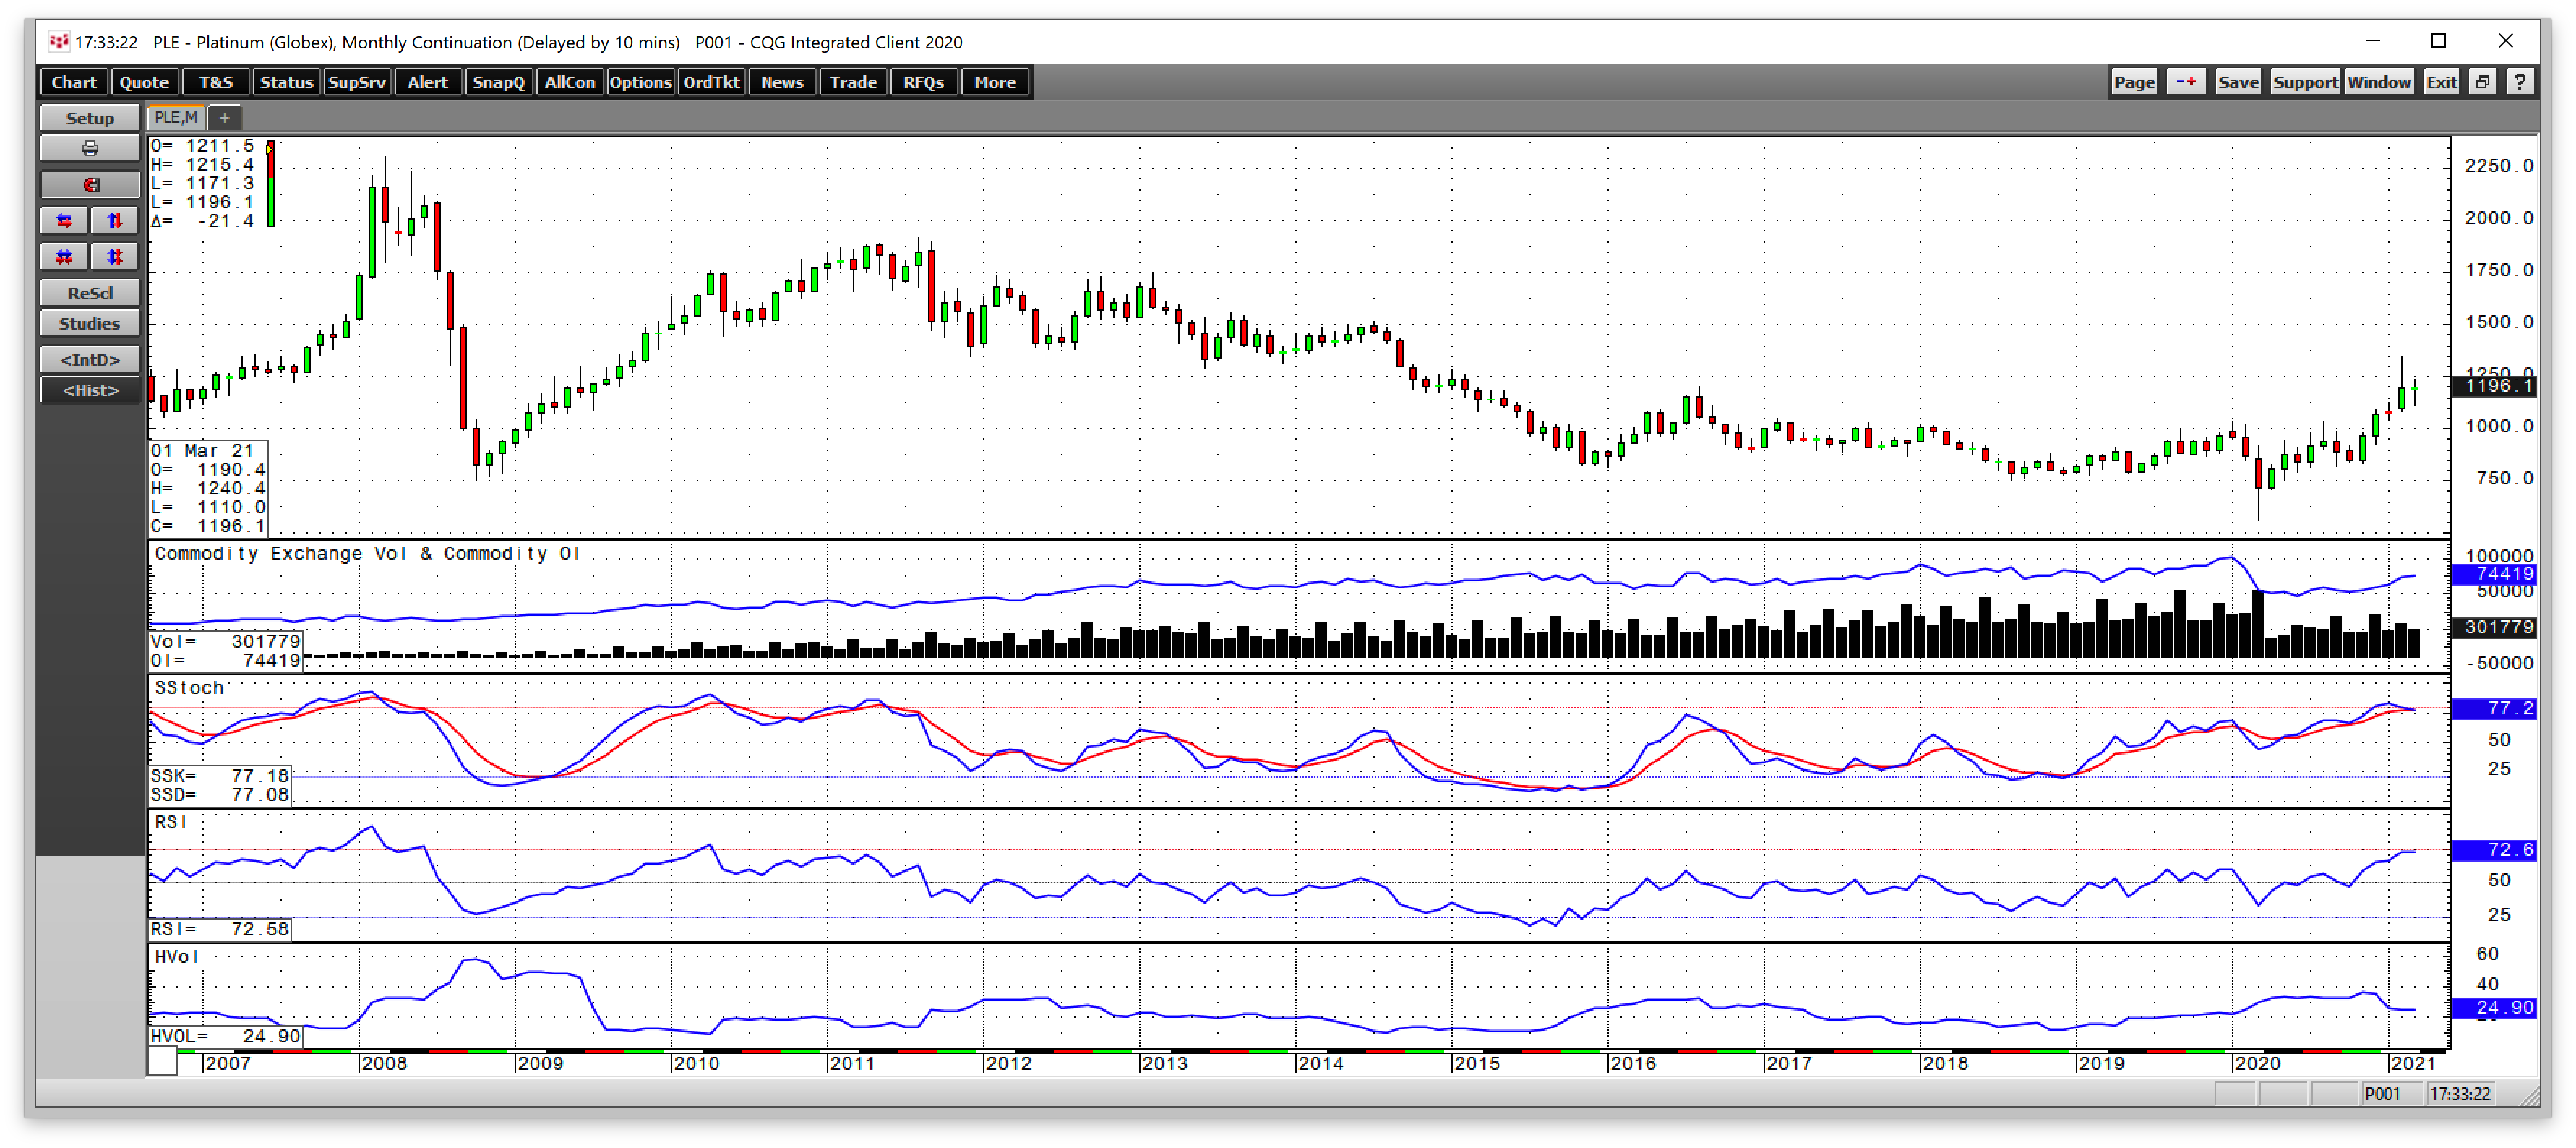
Platinum reached an all-time high of $2308.80 per ounce on the nearby NYMEX futures contract in 2008. Over the next twelve years, the price made lower highs and lower lows, culminating in a spike to the lowest price since 2002 in 2020 when platinum hit bottom at $562 per ounce.
Source: CQG
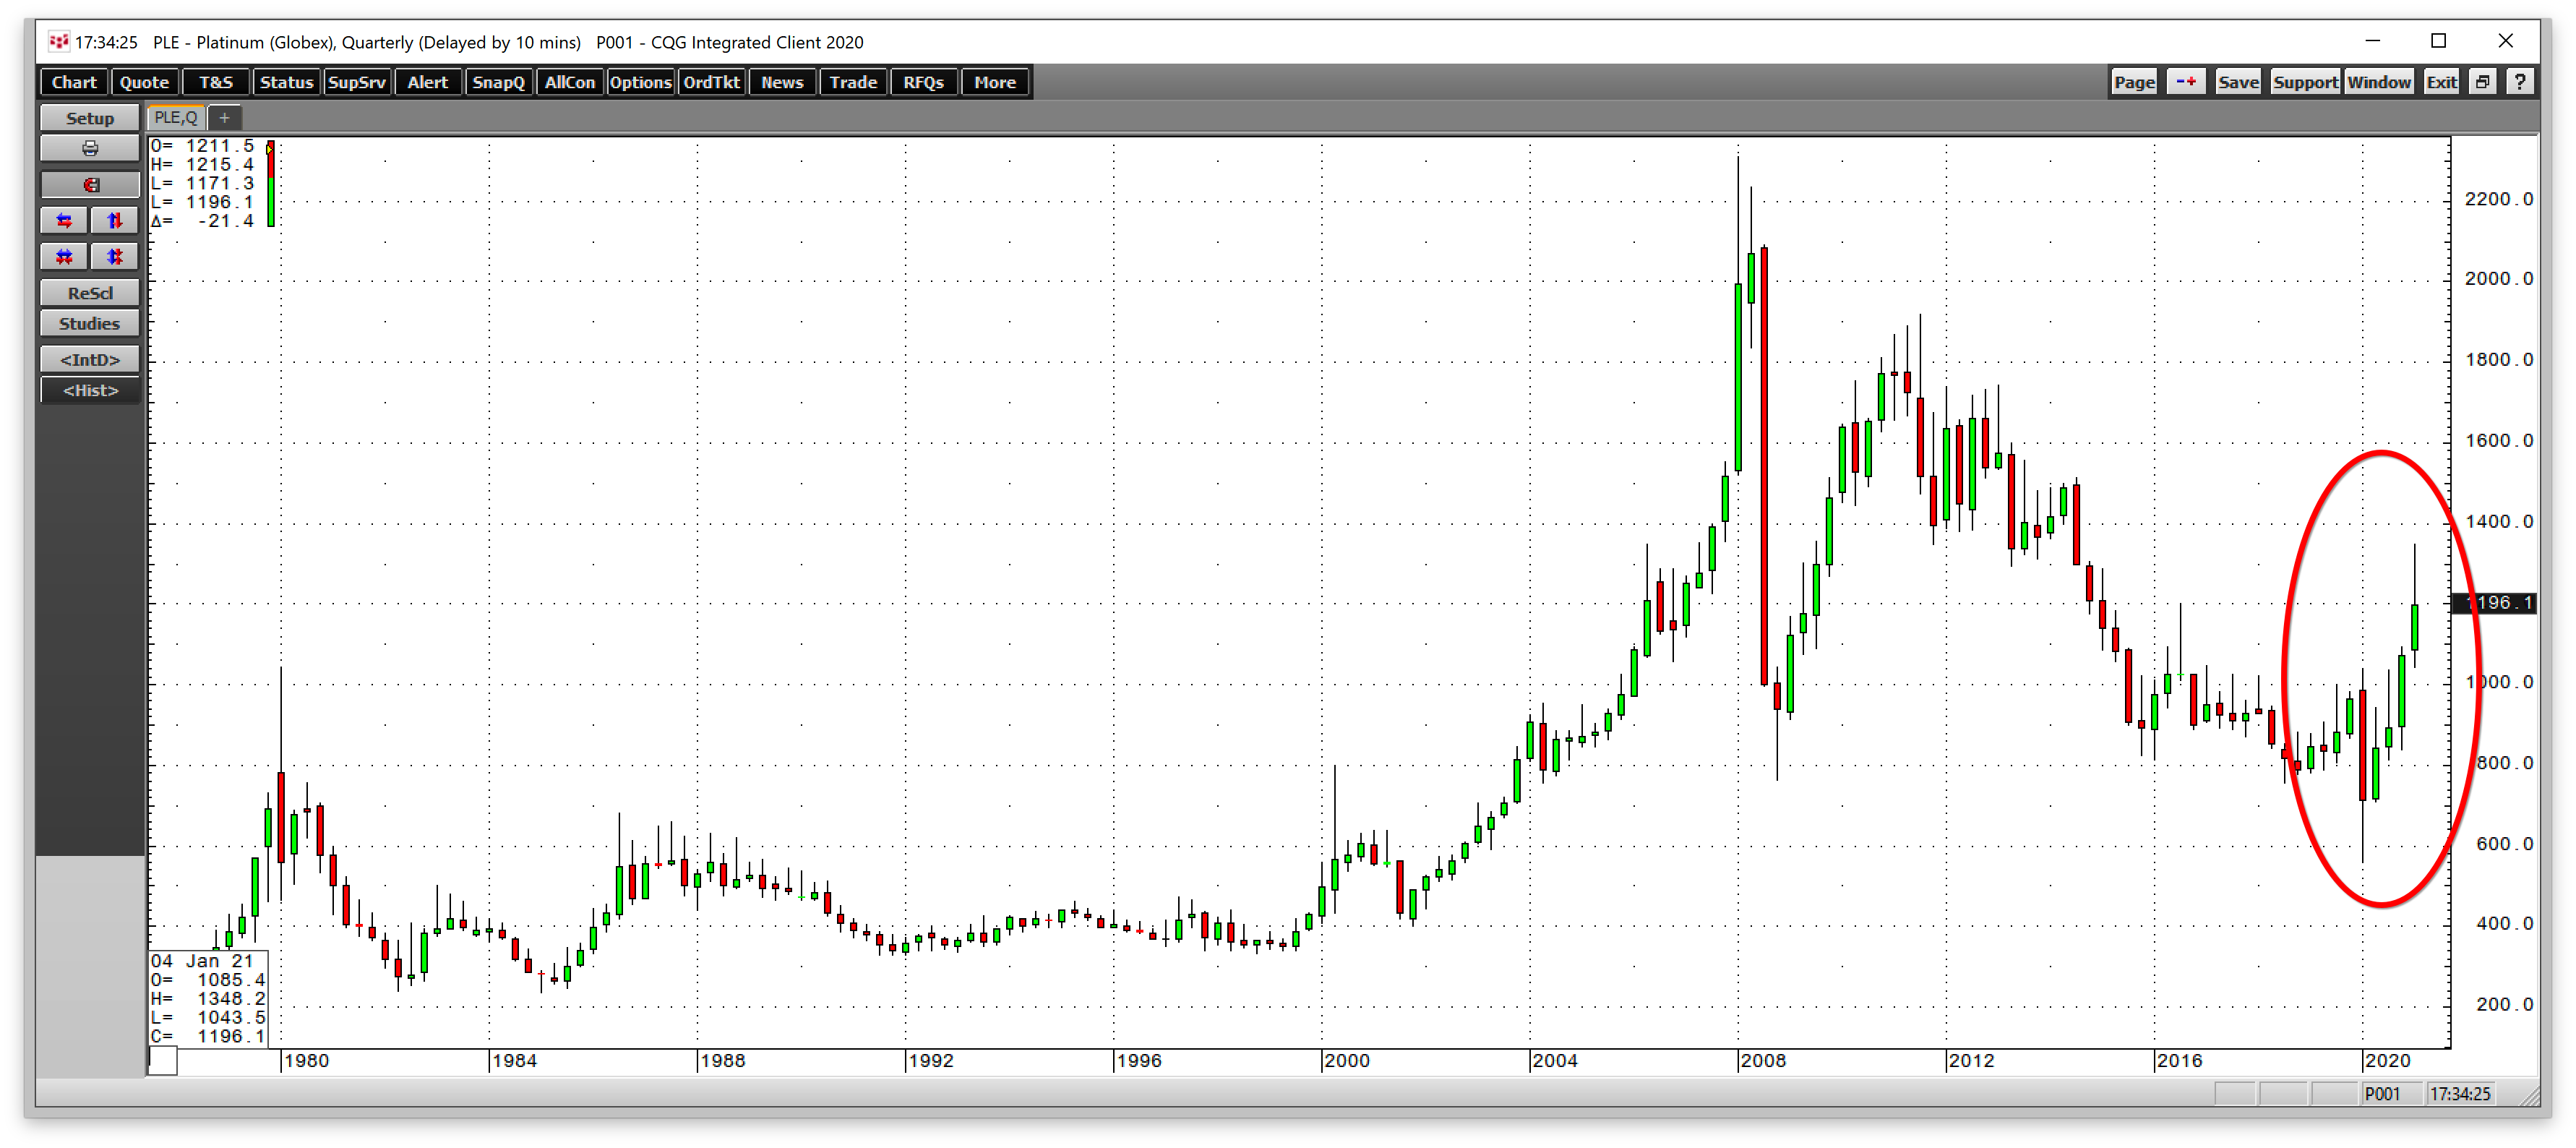
The monthly chart illustrates that platinum made a lower high in August 2016 at $1199.50, which stood as critical technical resistance for over four years. In February 2021, platinum finally broke above the technical level, reaching a high of $1348.20 on the nearby futures contract. At the $1200.10 level on Mar. 19, platinum was just above the breakout level, which now stands as a pivot point for the precious metal.
After falling with the platinum price in March 2020, the total number of open long and short positions in the platinum futures arena has been rising with the price over the past year. The increase in open interest is a sign that investment and industrial demand are returning to the platinum market after being washed out during the March 2020 spike low.
Meanwhile, monthly price momentum and relative strength indicators have been trending higher in confirmation of the bullish price action.
Source: CQG
The quarterly chart shows that platinum posted gains over the past three straight quarters. A close above $1073.20 on Mar. 31 would mark the commodity's fourth quarterly gain.
Platinum’s value proposition is compelling
Platinum continues to have the most attractive value proposition in the precious metals sector for the following reasons:
- Platinum remains historically inexpensive against gold, palladium, and rhodium as it is trading at a substantial discount to all three of the other precious metals.
- Platinum has a long history as a store of value. A sudden return of investor demand could lift the price of the metal dramatically. Platinum is far rarer than gold, with the bulk of annual production coming from South Africa and Russia. There are far fewer platinum stockpiles worldwide than gold inventories, which are held by central banks and governments as well as long-term investors.
- Platinum’s production cost is higher than gold because it tends to exist deeper in the earth’s crust.
- Platinum’s density and resistance to heat make the metal an acceptable substitute for palladium and rhodium for industrial applications.
Platinum has a lot going for it at the $1200 per ounce level on Mar. 19. When it decides to move higher, the market’s liquidity could be the factor that causes an explosive gain.
Liquidity is an issue
One of the reasons platinum fell to an eighteen-year low in 2020 was that liquidity disappeared, causing the metal’s price to become a falling knife. Illiquid markets tend to move to irrational, unreasonable, and illogical levels on the downside during liquidations and to the upside during bull markets.
Platinum’s total open interest in the futures market stood at 74,419 contracts at the end of last week. On Feb. 16, when the April futures rose to the $1348.20 high, total volume was at 39,828 contracts, the high of the year. Since a platinum contract contains 50 ounces of the precious metal, the volume changing hands on Feb. 16 was 1,991,400 ounces. The current open interest represents 3,720,950 ounces of platinum.
On gold’s most active day in 2021, 517,610 contracts changed hands. Open interest at the end of last week stood at 475,979 contracts. At the peak for the year, the volume of traded gold in the COMEX futures market reached 51,761,000 ounces, with the current open interest at 47,597,900 ounces of the yellow metal.
The gold market is highly liquid, while platinum is not. Therefore, the experience in 2020 that drove the price to an irrational low could repeat on the upside. Buying evaporated last year. When platinum decides to play catch up with the other precious metals, selling could disappear, causing the price to vacuum higher.
PPLT the most liquid platinum ETF product
The most direct route for a risk position in platinum is via the physical market for bars and coins. The futures market offers a delivery mechanism that allows for a smooth convergence of physical and futures prices when contracts expire. Meanwhile, the Aberdeen Standard Physical Platinum Shares ETF product (PPLT) is the most liquid ETF that tracks the price of platinum.
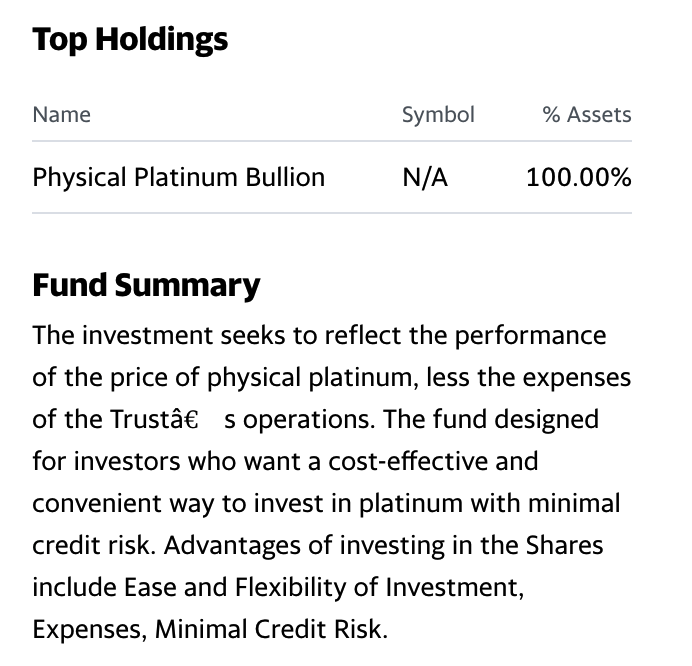
PPLT’s top holdings and fund summary include:
Source: Yahoo Finance
PPLT holds all of its $1.536 billion in net assets in physical platinum bullion. The ETF trades an average of 252,450 shares each day and charges a 0.60% expense ratio.
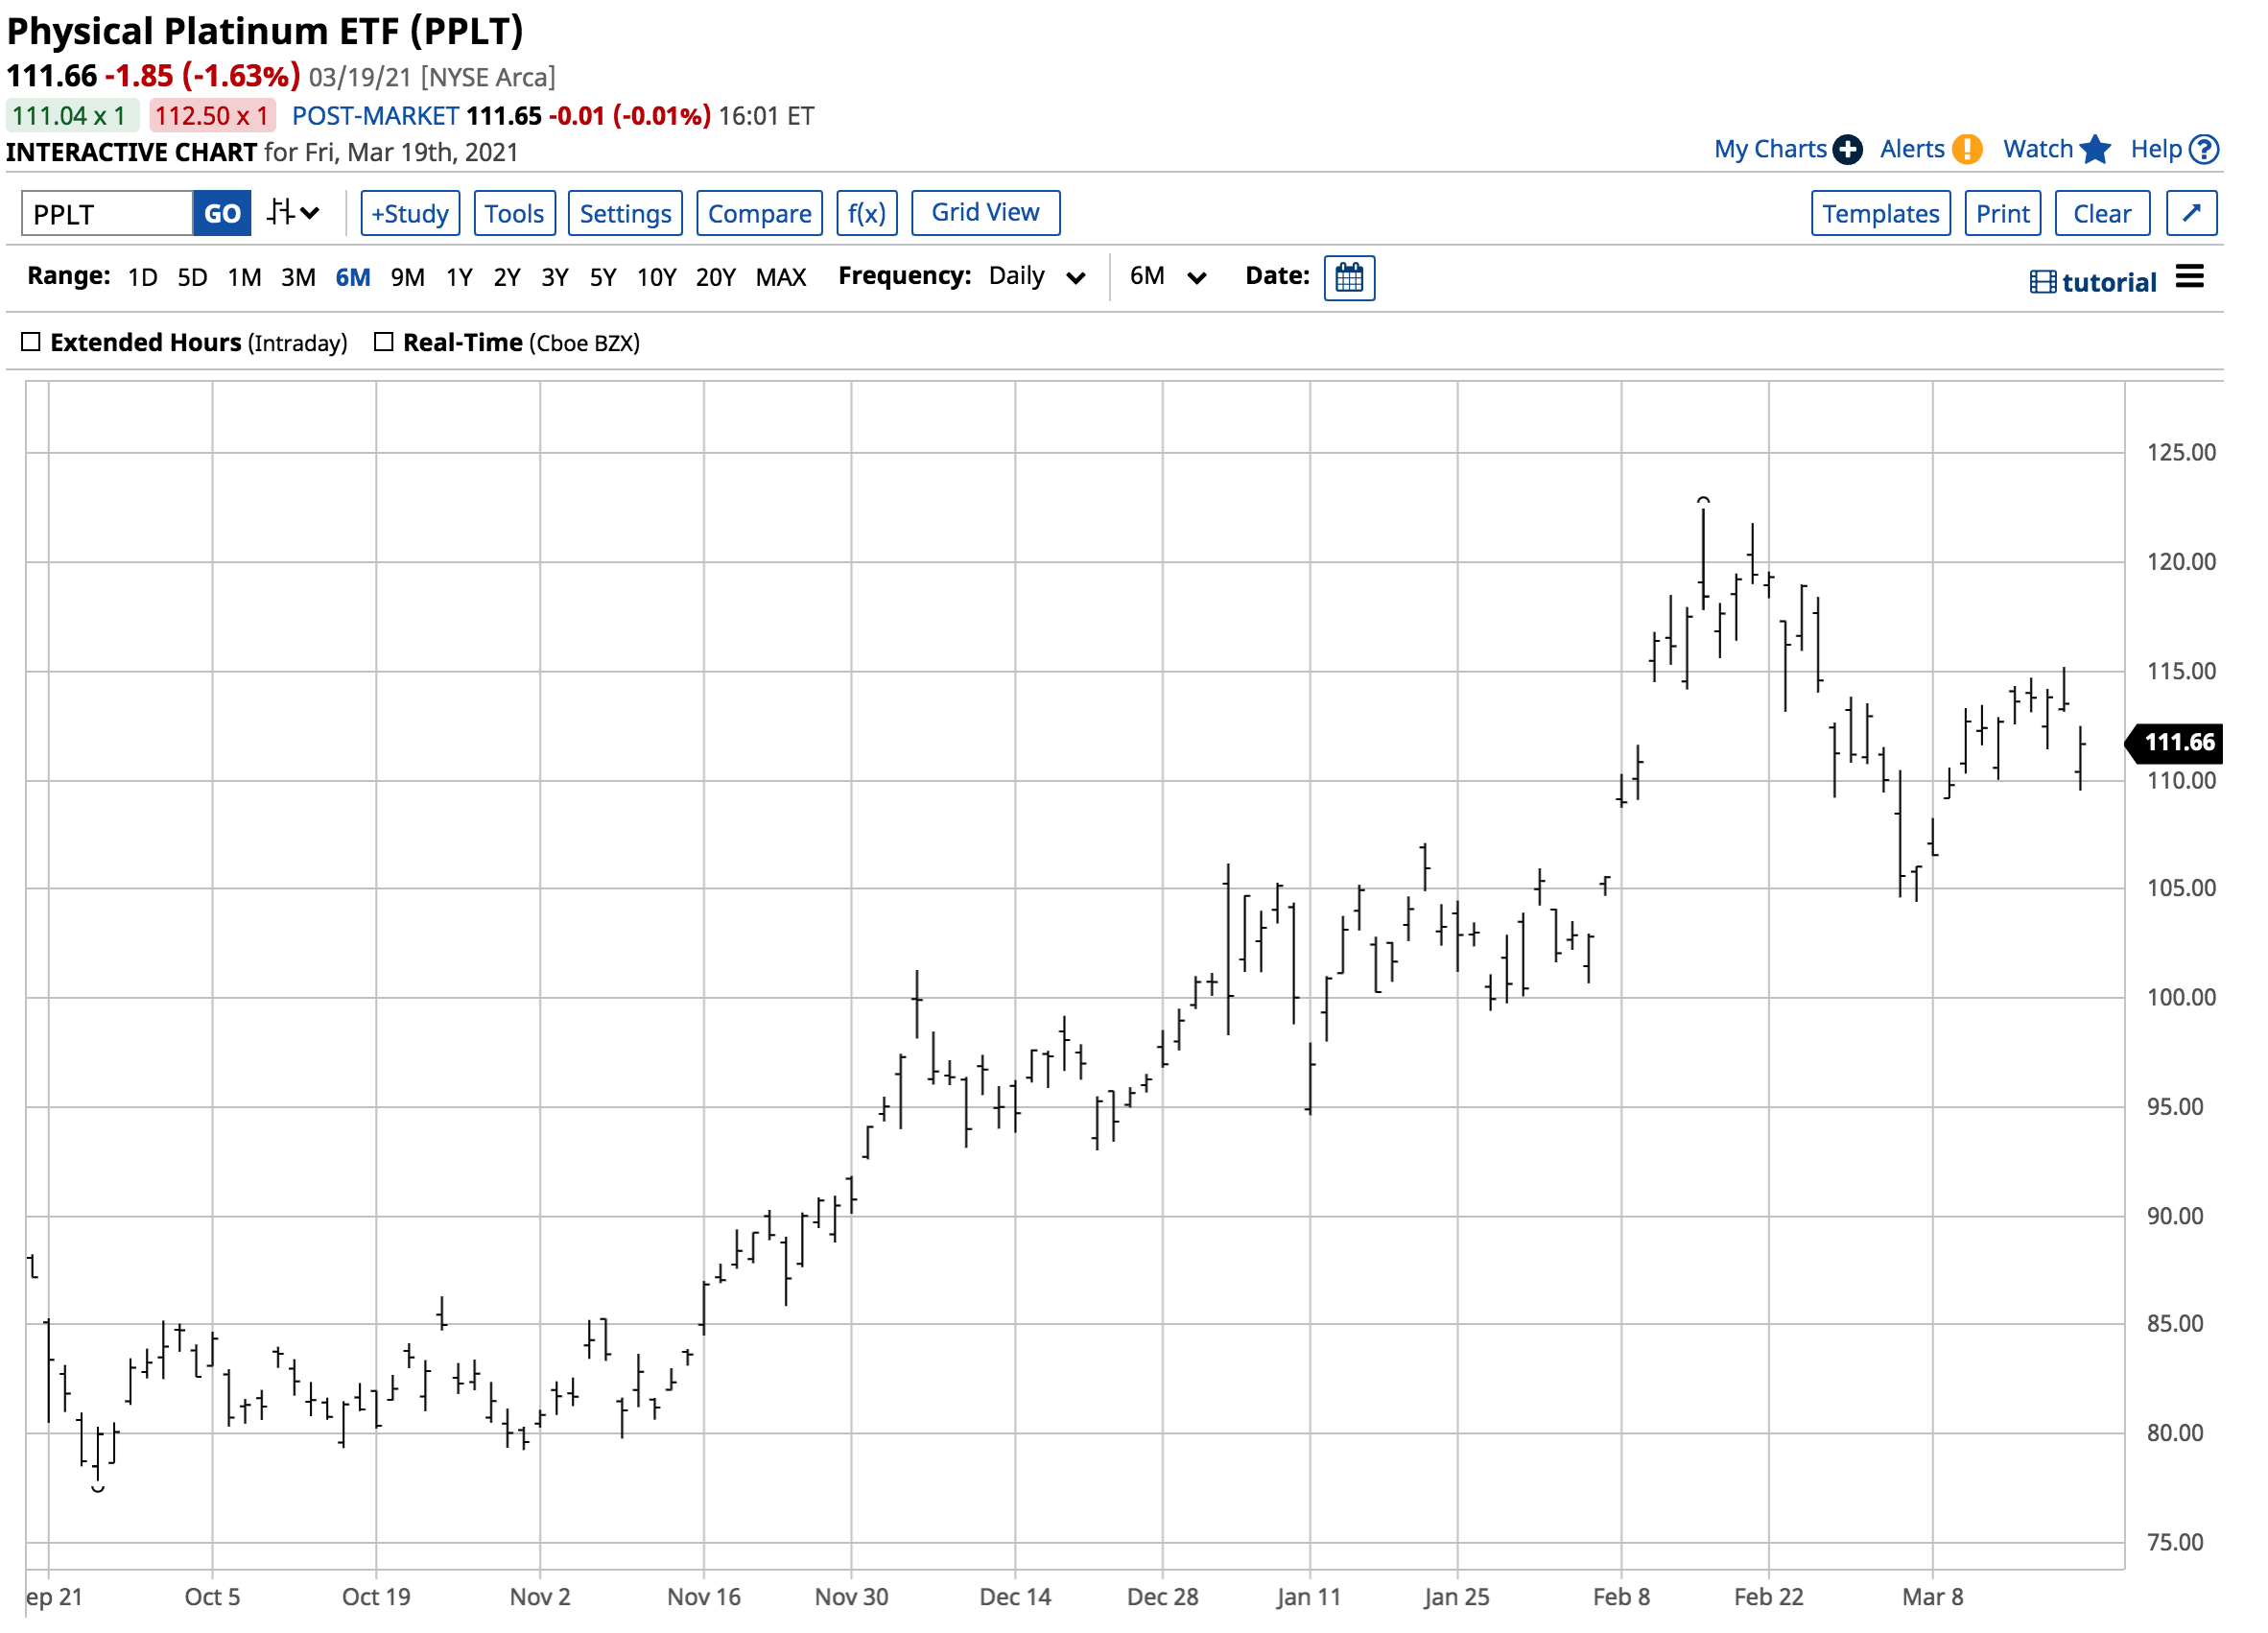
Most recently, nearby April NYMEX platinum futures rallied from $1110 on Mar. 5 to $1240.40 per ounce on Mar. 16, or 11.75%.
Source: Barchart
Over around the same period, PPLT rose from $104.41 to $115.19 per share or 10.3%. The drawback of the PPLT ETF product is that it only trades during the hours when the US stock market operates, while platinum trades around the clock from Sunday night until late Friday. When highs or lows occur during periods when the US stock market is not open, PPLT misses those moves.
Platinum remains inexpensive compared to peers in the precious metals group. Its role as a store of value and industrial metal make it a compelling value at $1200 per ounce.
Moreover, liquidity in the platinum futures market could lead to explosive gains if selling evaporates and a herd of buyers decides that it's platinum’s time to shine.
