Bitcoin set for a rebound that could stretch toward $100000, BTIG says
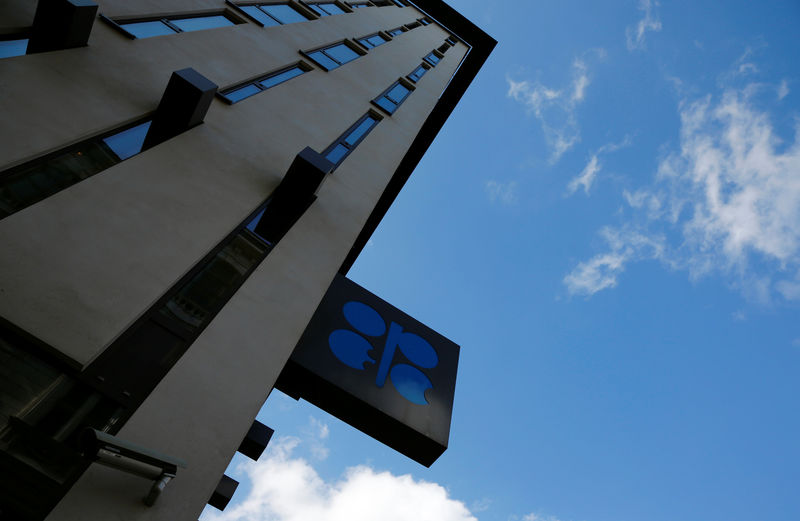
Investing.com - By the time you read this, OPEC would have probably decided, even announced, new production levels meant to seize pricing of oil back from the hands of short-sellers who’ve driven the group nuts this year in trying to keep a barrel at $80 or more.
Oil revenue is the lifeblood of the economies in OPEC, or the Organization of the Petroleum Exporting Countries, a 13-member Saudi-led group whose main objective is to be the price-setter of the commodity. Ten other oil-producing states, including Russia, that aren’t OPEC members also keep their output closely in line with the group’s for the sake of price. The 23-nation alliance is collectively known as OPEC+.
For Saudi Arabia, oil accounts for 70% of total export value and 53% of government revenue; for the United Arab Emirates, it’s 13% of exports and 30% of GDP and for Algeria, it’s 25% of GDP. But for Kuwait and Iraq, more than 90% of all revenue depends on oil.
Thus, it’s easy to see why OPEC+ would go to any extent to get the prices it wants for its oil.
The alliance typically deprives the market of millions of barrels of crude oil per day - under the name of production cuts - to create an artificial supply squeeze that pushes prices higher.
In recent years, the group, or specifically Saudi Arabia’s energy minister who came on board in 2019, has even taken to warning oil traders not to bet on lower prices unless they want to be “ouching” - and proved this by announcing deep and unexpected output cuts that sent the market rallying, to the detriment of short-sellers.
This week, OPEC upped the ante for unconventional behavior by blocking three of the world’s largest media outfits - Reuters, Bloomberg and Wall Street Journal - from its production policy meetings held at the secretariat of its headquarters in Vienna. No reasons were given for the selective media blockade, which appeared triggered by OPEC’s displeasure over the three media outfits’ reporting of its activities, which included a story about growing tensions between Saudi Arabia and Russia over a discord on production levels.
At the time of writing, it was not known yet what OPEC had decided as appropriate production going forth. In October and April, the group announced deep and surprise cuts of 2 million barrels per day and 1.7 million barrels per day, respectively. Both announcements provided only brief support for prices, with a barrel of U.S. crude repeatedly falling below $70 since March and global crude benchmark Brent staying beneath $80 despite the well-known Saudi desire for prices to be nearer to $90.
Energy Intelligence, one of the publications covering the meeting, said it had been informed that OPEC would need to generate a positive price reaction for oil when trading begins on Monday with its production decision that should “have an immediate impact on the availability of oil in the global market”.
Any OPEC-plus decision will be delivered with a healthy dose of rhetoric about the group’s compliance with existing cuts, people close to the matter told Energy Intelligence.
Since the outbreak of the coronavirus pandemic in 2020 that practically destroyed demand for oil for a while, OPEC has harped on quota compliance as data showing adherence of above 100% to cuts supported U.S. crude’s rebound from a pandemic low of minus $40 per barrel to above $88 by January last year. The Ukraine invasion by Russia then pushed a barrel to 14-year highs of above $130 a barrel. From there, a cocktail of slowing oil demand in top buyer China, global economic worries and a banking crisis in the United States have repeatedly sent oil lower despite OPEC’s best attempts.
While OPEC loves to talk about closeness in its ranks - UAE Energy Minister Suhail Al Mazrouei painted a picture of solidarity ahead of Sunday’s meeting, saying “this group is solid” or that any cuts agreed upon will be carried out in full - the reality offers a different picture.
For months now, Russia has repeatedly exceeded its so-called OPEC+ production quota while selling a barrel without much concern at $60 or around that, under prices ordained by the G7’s sanctions.
Currently, Russian production is in the global spotlight, following its pledge to cut 500,000 barrels per day from its February levels and officials there have gone out of their way to demonstrate commitment to achieving compliance with the full pledge.
Energy Intelligence said its own assessments show Russian production down about 300,000 barrels daily in April. “Sources and certain market data point to the potential that Russia further decreased production in May, which would be welcome news to fellow members,” the publication reported. Other media reports, meanwhile, suggest that Russian crude exports hit pre-sanction highs in May.
Whatever you have as the new OPEC decision on production - whether a rollover of existing output levels, or an immediate cut of another million barrels that could take the total artificial squeeze on the market to nearly 5 million barrels per day - it is designed to show the group is in full control of the market.
With summer demand for oil looking poised to grow in the coming two months, OPEC may be at its best moment yet to tilt the market its way. Yet, some of the best-laid plans in history have also fallen apart for the most unexpected of reasons. We shall see how well this one works out for OPEC.
Oil: Market Settlements and Activity
New York-traded West Texas Intermediate, or WTI, crude did a final post-settlement trade of $71.87 per barrel after officially settling Friday’s session at $71.74 - up $1.64, or 2.3%, on the day. For the week, WTI was down 1.3%. On Wednesday, the U.S. crude benchmark hit a four-week low of $67.03.
London-traded Brent crude did a final post-settlement trade of $76.40 per barrel after officially settling Friday’s session at $76.13, up $1.85, or 2.5%. For the week, Brent was down 1%. The global benchmark for oil hit a four-week low of $71.39 on Wednesday.
Oil: WTI Technical Outlook
Barring any OPEC-inspired action, WTI’s immediate resistance to break in the week ahead would be the 5-week Exponential Moving Average of $72.50, said Sunil Kumar Dixit, chief technical strategist at SKCharting.com.
“This level needs to be cleared for further upside towards the swing high of $73.55, above which sits the next leg higher, where the weekly Middle Bollinger Band of $75.50 will serve as the next challenge,” said Dixit.
On the flip, the 200-week Simple Moving Average, or SMA, of $67.10 will be the low target for market bears to crack, he said.
“A sustained break below this zone will eventually extend the decline towards the major downside target, where the 100-month SMA of $59.60 sits.”
Natural gas: Market Settlements and Activity
Natural gas futures limped in with a daily gain and a small weekly loss on Friday as market participants banking on near-term demand looked beyond the first injection of above 100 billion cubic feet, or bcf, in the current storage season for the fuel.
The front-month gas contract on the New York Mercantile Exchange’s Henry Hub did a final trade at $2.177 per mmBtu, or million metric British thermal units, after officially settling Friday’s session at $2.172 - up 0.6% on the day. It was the first daily gain for the benchmark gas futures contract after four straight days of losses.
For the week, the contract finished down 0.4%, adding to the 15.6% plunge in the prior week.
“The second half of June into early July suggests that consistent heat isn’t too far off into the future and once that heat materializes demand will rebound.”
The market appears to be starting to price this in and further bullish support may materialize.
The rebound came after the Energy Information Administration, or EIA, reported in its roundup of gas storage for the week ended May 26 that U.S. inventories of the fuel rose by 110 bcf last week.
That compared with the 96-bcf injection seen in the prior week to May 19. It also contrasted against the 82-bcf injection seen during the same week a year ago and the five-year (2018-2022) average build of 101 bcf.
With the latest stockpile increase, the EIA reported that total gas in underground caverns in the United States stood at 2.446 trillion cubic feet, or tcf — up 29.5% from the year-ago level of 1.889 tcf and 16.6% higher than the five-year average of 2.097 tcf.
Just two weeks ago, Henry Hub’s benchmark gas contract hovered at 11-week highs of around $2.70, breaking out from the tight confines of mid-$2 pricing on the notion that the market may finally be turning the corner on fundamentals despite its oversupplied state. But in recent days, it fell back to under $2.50, which has proven again to be a formidable barrier for gas bulls.
Natural gas: Henry Hub Technical Outlook
Going into the week ahead, the price level of $2.09 offers immediate support for natural gas, with the next leg lower being $2.03 and $1.94, said SKCharting’s Dixit.
“Consolidation above the 100-day SMA of $2.47 is essential for a resumption of an uptrend that would target the swing high of $2.68 and $2.98, followed by the 100-month SMA of $3.24.”
Gold: Market Settlements and Activity
The U.S. debt ceiling deal is done but gold isn’t quite dead yet, as some had been speculating.
Futures of the yellow metal settled down on Friday for the first time in three days. But the drop could not wipe gains over the three previous days, leaving gold in the positive for the week.
The front-month gold contract on New York’s Comex officially settled at $1,947.40 an ounce, down $30.60, or 1.5%, on the day. The final post-settlement trade was $1,952.40.
The benchmark for gold futures hit a two-week high of $2,000.65 in the previous session. For the week, Comex’s front-month gold contract posted a return of 1.3%.
The spot price of gold, which reflects physical trades in bullion and is more closely followed than futures by some traders, settled at $1,948.46 down $29.06, or 1.5%. Spot gold hit a one-week high of $1,983.44 on Friday before reversing.
Gold had a positive week despite the dollar rising for a second time in three sessions as forex traders reacted to the Senate passage for the debt ceiling deal that only needs President Joe Biden’s signature next.
U.S. jobs data for May also proved stronger than expected while unemployment itself rose and wage growth slowed, resulting in a split opinion among economists on whether policy makers at the Federal Reserve would hike interest rates again when they meet on June 14.
Gold: Spot Price Outlook
Spot gold’s initial recovery from $1,932 scaled up to $1983, slightly above the Daily middle Bollinger Band dynamically positioned at $1980 failed to hold above the zone, and the strong jobs report pushed the metal below $1,975 support reaching $1,947.
As long as gold sustains above the $1,945-$1,942 horizontal support zone, a rebound towards $1,960 may be witnessed, SKCharting’s Dixit said.
“Strong consolidation above $1,960 would be needed to attract buyers for a retest of $1,975,” said the technical chartist.
“Stability below $1,960 and a sustained break below the $1,945-$1,942 horizontal support zone will call for a further drop to the $1,932-$1,926, followed by deeper correction into the $1,913-$1,910 area.”
Disclaimer: Barani Krishnan does not hold positions in the commodities and securities he writes about.