US stock futures flat after Wall St drops on Trump tariffs, soft jobs data

Introduction & Market Context
ACRES Commercial Realty Corp (NYSE:ACR) released its second quarter 2025 earnings presentation on July 30, showing modest improvement from the previous quarter but still operating at a loss. The commercial real estate finance REIT reported a GAAP net loss of $0.10 per diluted share, significantly better than the $0.80 per share loss reported in Q1 2025. The company’s stock closed at $18.68 on July 30, up 2.3% on the day, but still trading well below its 52-week high of $23.81.
The presentation revealed a continued focus on multifamily properties, which now comprise 75% of the loan portfolio, as the company navigates a challenging commercial real estate environment. Management emphasized their strategy of delivering shareholder value through Earnings Available for Distribution (EAD) growth and share repurchases.
Quarterly Performance Highlights
ACRES reported a GAAP net loss of $0.10 per diluted share for Q2 2025, while posting positive Earnings Available for Distribution (EAD) of $0.04 per share. Book value per share stood at $27.93 as of June 30, 2025, down from $28.50 in the first quarter but up from $27.20 in the same quarter last year. The company highlighted an 11.4% annual increase in book value since the ACRES acquisition in Q3 2020.
As shown in the following chart of quarterly highlights:
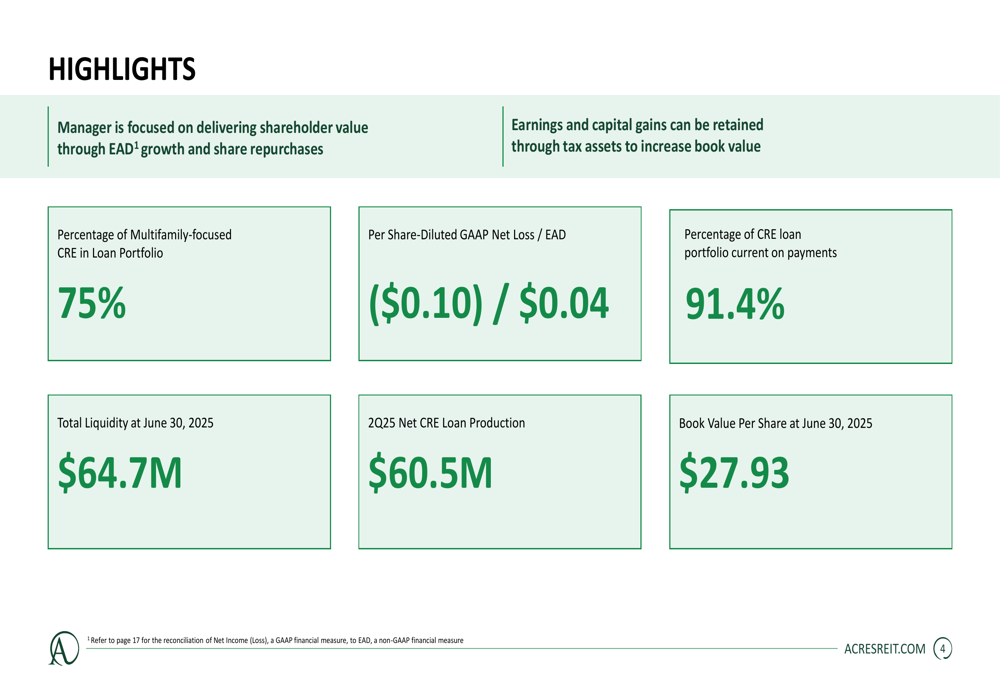
The company’s CRE loan portfolio totaled $1.4 billion at par value, comprising 48 loans with a weighted average loan-to-value ratio of 80%. Net loan production for the quarter was $60.5 million, with 91.4% of the portfolio current on payments. Total (EPA:TTEF) liquidity at quarter-end stood at $64.7 million.
The second quarter results showed improvement over Q1 2025, when the company reported a much larger loss of $0.80 per share and missed revenue expectations. The Q2 presentation suggests the company is making progress on its previously announced plan to grow its portfolio by $300-500 million by year-end, having added $60.5 million in net loan production during the quarter.
Balance Sheet and Capital Structure
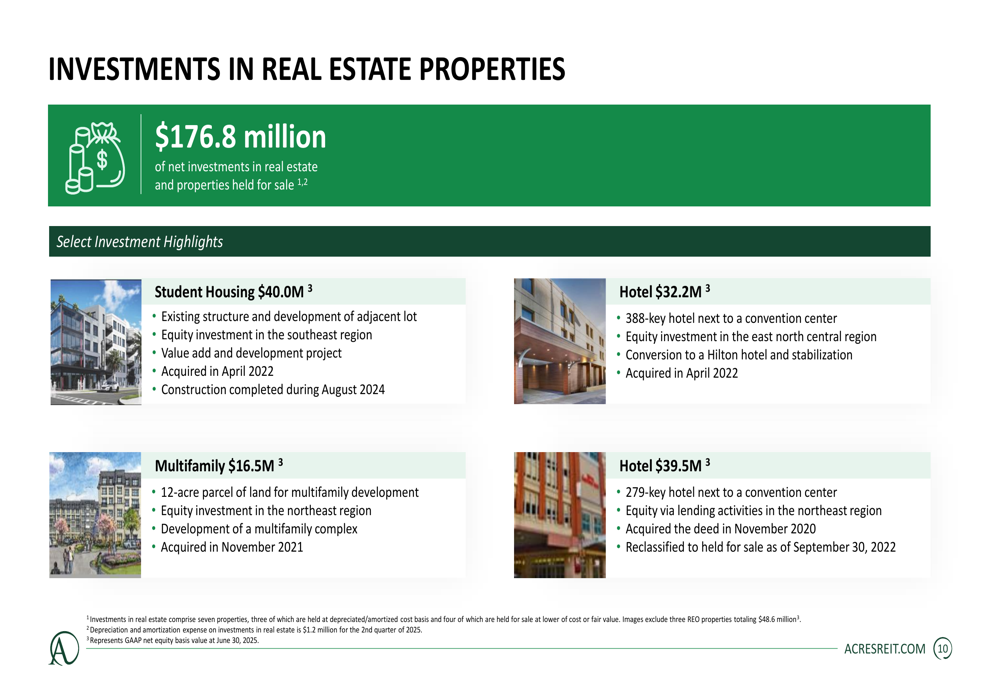
ACRES maintained a total asset base of $1.8 billion as of June 30, 2025, with CRE whole loans accounting for $1.4 billion. The company reported total liquidity of $64.7 million and maintained CECL reserves of $30.3 million, representing 2.18% of the loan portfolio. The balance sheet also included $176.8 million in net investments in real estate and properties held for sale across seven investments.
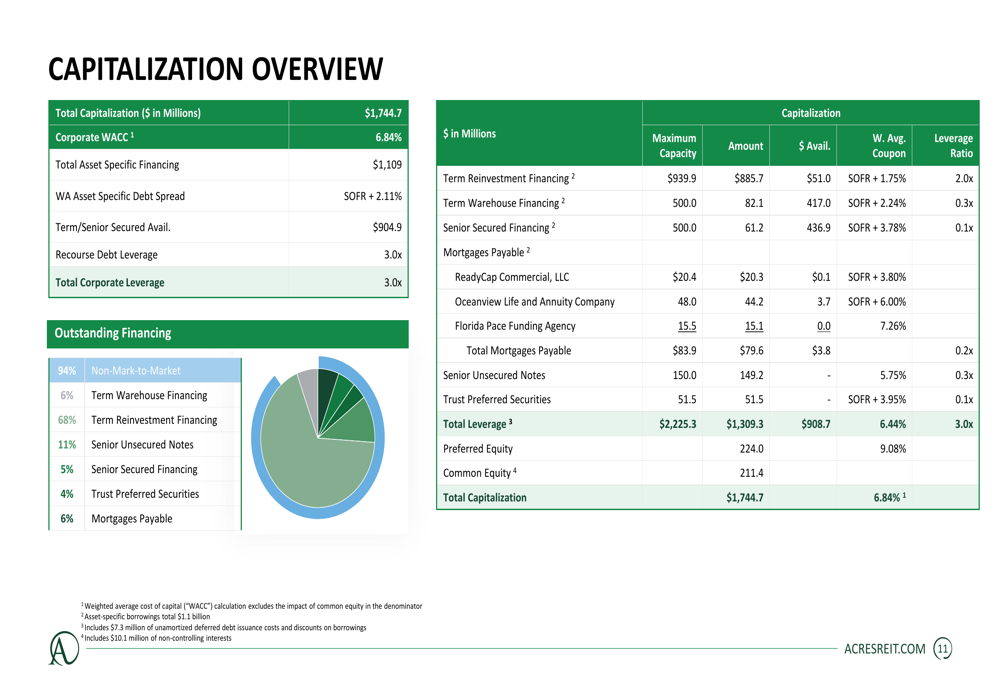
The company’s capital structure is illustrated in the following slide:
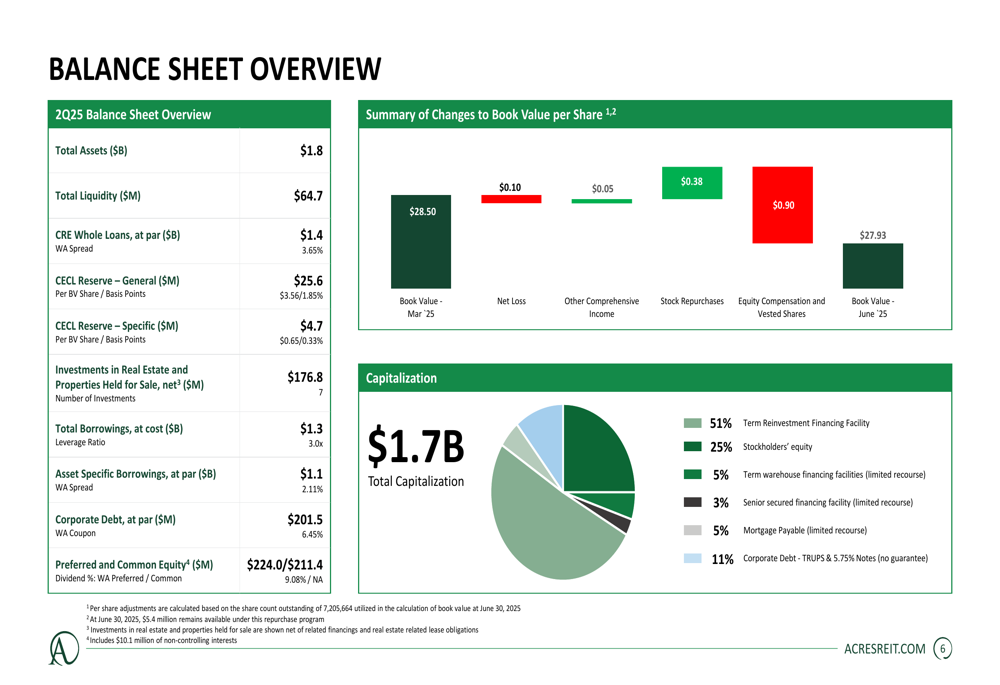
Total borrowings stood at $1.3 billion, resulting in a leverage ratio of 3.0x. Asset-specific borrowings accounted for $1.1 billion with a weighted average spread of 2.11%, while corporate debt totaled $201.5 million with a weighted average coupon of 6.45%. The company’s preferred and common equity amounted to $224.0 million and $211.4 million, respectively.
Portfolio Composition and Risk Profile
ACRES’ loan portfolio remains heavily concentrated in multifamily properties, which account for 75% of the total. The remaining portfolio consists of office (17.9%), hotel (4.2%), mixed-use (1.8%), and self-storage (1.1%) properties. Geographically, the portfolio is diversified across the United States, with the largest concentrations in the Southwest (25.7%), Mountain (17.4%), and Southeast (15.9%) regions.
The following slide provides a comprehensive overview of the CRE loan portfolio:

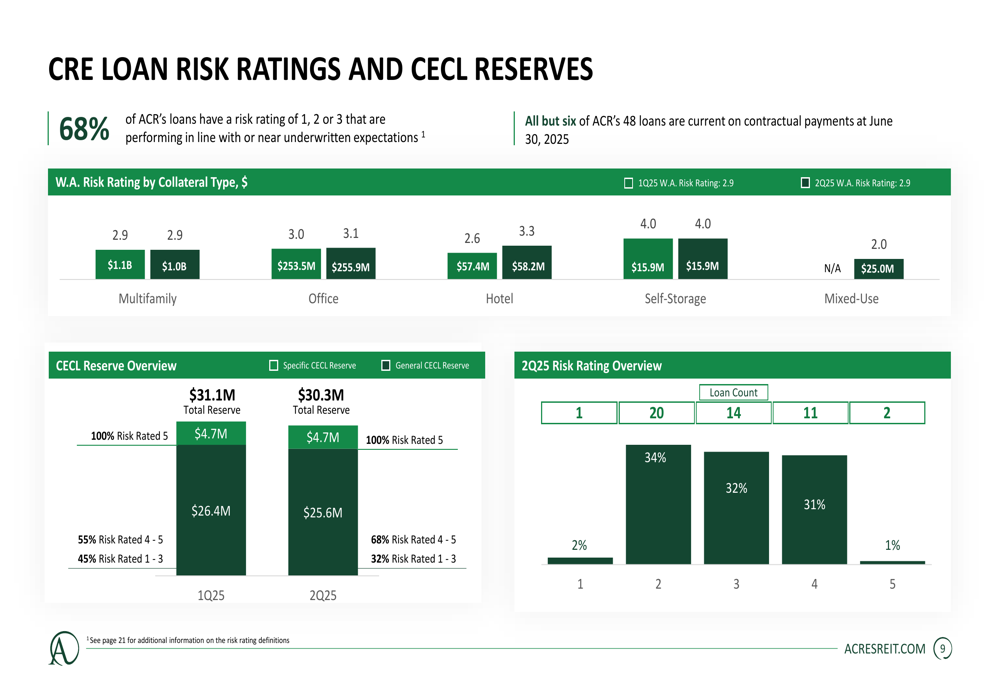
The company’s risk profile shows some areas of concern, with 32% of the par value of the CRE loan portfolio rated 4 or 5 (higher risk). However, 91.4% of the portfolio remains current on payments. ACRES maintains CECL reserves of $30.3 million, consisting of $25.6 million in general reserves and $4.7 million in specific reserves.
The risk ratings and CECL reserves are detailed in the following chart:
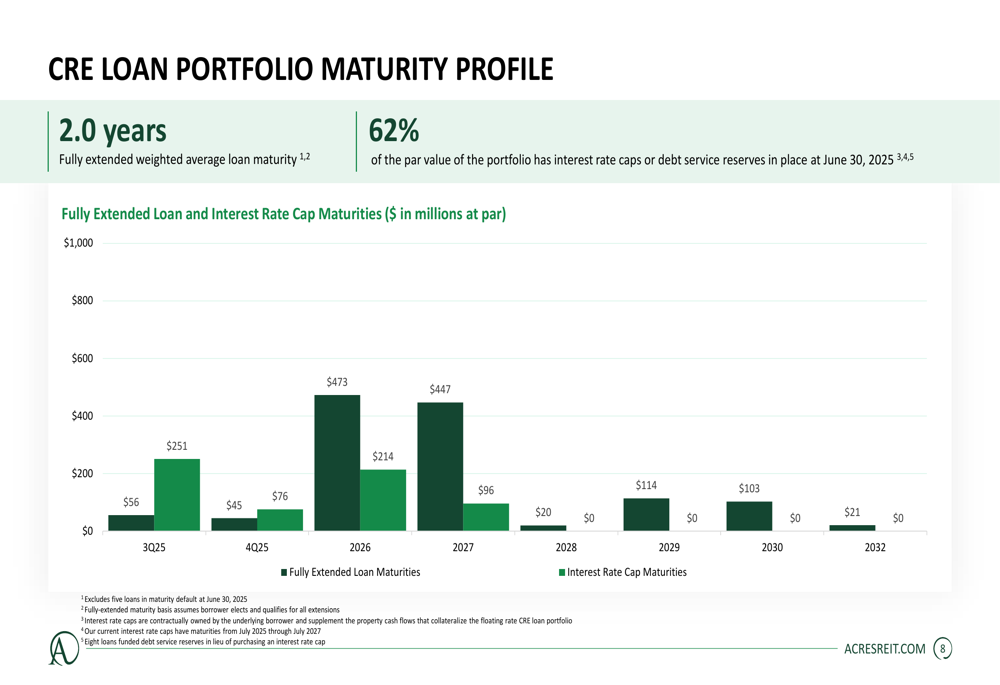
The maturity profile of the loan portfolio shows a weighted average loan maturity of 2.0 years on a fully extended basis, with 62% of the portfolio having interest rate caps or debt service reserves in place as of June 30, 2025.
Strategic Growth Initiatives
ACRES has significantly increased its leverage over the past year, from 1.1x in Q3 and Q4 2024 to 3.0x in Q2 2025. This increase aligns with the company’s growth strategy and is reflected in the following trend chart:
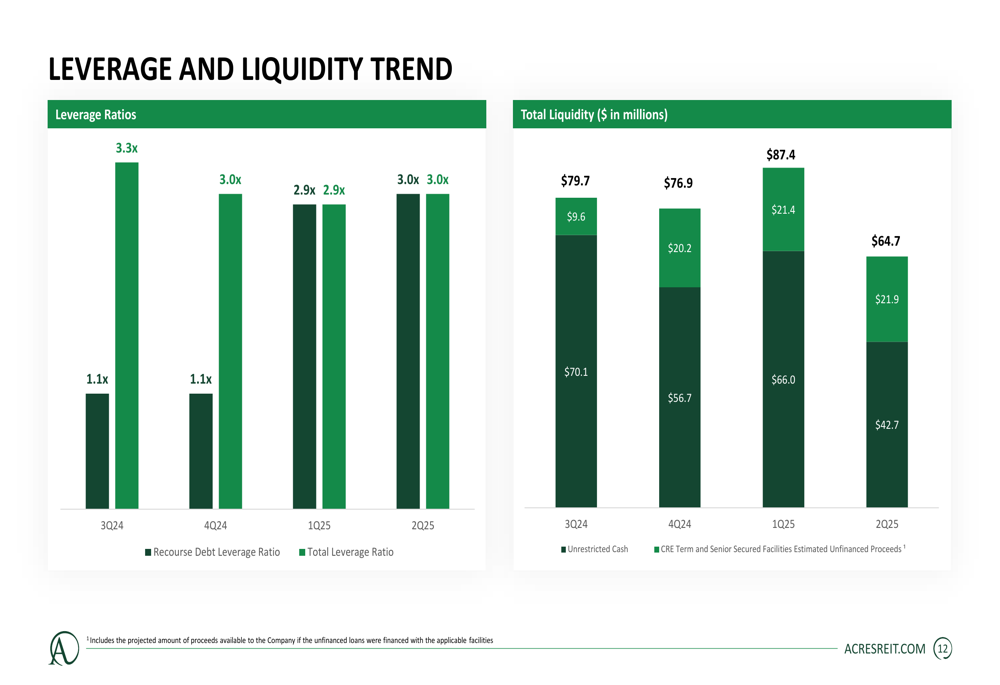
The company’s capitalization structure shows a corporate weighted average cost of capital (WACC) of 6.84%, with 51% of total capitalization represented by the Term Reinvestment Financing Facility and 25% by stockholders’ equity.
ACRES also presented an illustrative earnings profile based on different portfolio sizes, projecting significant growth in EAD per share as the portfolio expands. At the current portfolio size of approximately $1.4 billion, the company projects annual EAD of $0.69 per share. This could increase to $2.24 per share with a $2 billion portfolio and $3.16 per share with a $2.25 billion portfolio.
Forward-Looking Statements
Management’s presentation suggests confidence in the company’s growth trajectory despite the current challenges. The focus on multifamily properties (75% of the portfolio) indicates a strategic positioning in what is generally considered a more stable sector of commercial real estate.
The company’s investments in real estate properties, totaling $176.8 million, include student housing, hotels, and multifamily properties, providing additional diversification beyond the loan portfolio.
The increase in leverage to 3.0x suggests an aggressive growth strategy, which aligns with management’s previous statements about expanding the portfolio by $300-500 million by year-end. However, this increased leverage also comes with higher risk, particularly in the current uncertain economic environment.
While ACRES has shown improvement from Q1 to Q2 2025, the continued net loss and the significant portion of the portfolio rated as higher risk (32%) suggest ongoing challenges. Investors will likely be watching closely to see if the company can continue to narrow its losses and achieve the projected earnings growth while maintaining portfolio quality.
Full presentation:
This article was generated with the support of AI and reviewed by an editor. For more information see our T&C.