German construction sector still in recession, civil engineering only bright spot

Apollo Global Management, Inc. (NYSE:APO) reported its first quarter 2025 results on May 2, 2025, highlighting strong growth in assets under management and record inflows, despite a slight decline in the company’s stock price on the day of the announcement.
Quarterly Performance Highlights
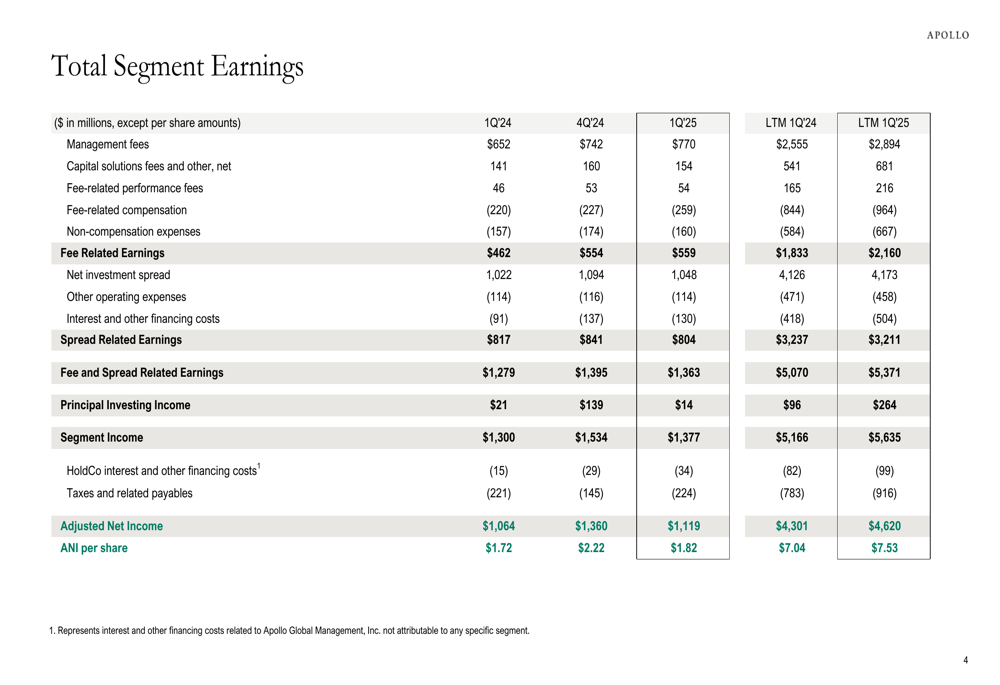
Apollo reported adjusted net income of $1.12 billion ($1.82 per share) for Q1 2025, up from $1.06 billion ($1.72 per share) in Q1 2024. The company declared a cash dividend of $0.51 per share, payable on May 30, 2025, to shareholders of record as of May 16, 2025.
"Our first quarter results highlight Apollo’s strengths and our ability to navigate shifting market conditions," said Marc Rowan, Chairman and Chief Executive Officer. "We are uniquely built to thrive amid volatility and dislocation."
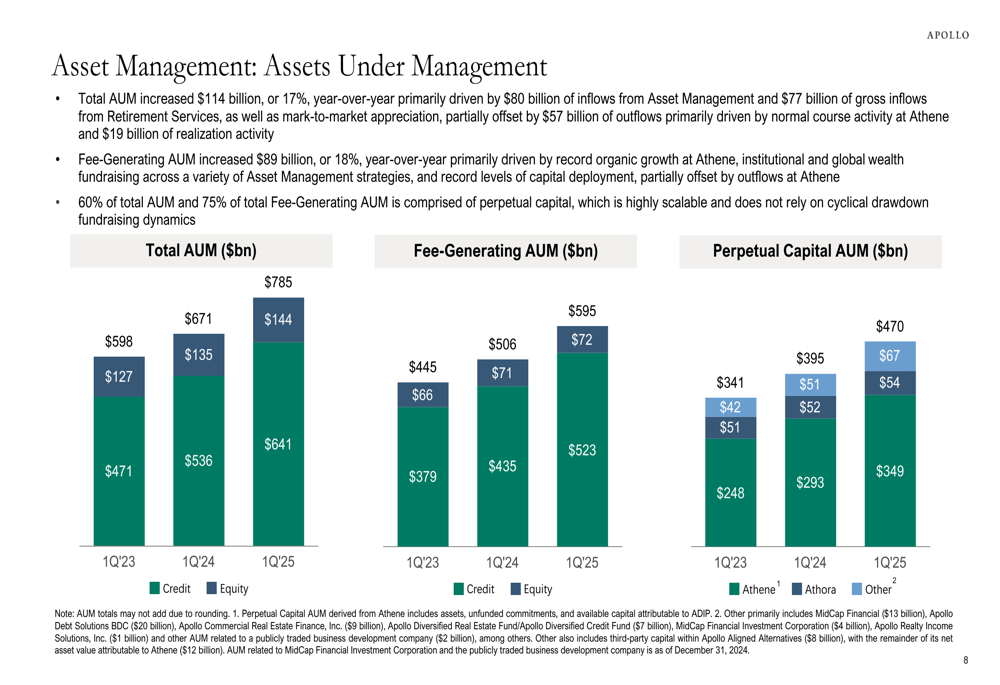
The firm’s total assets under management reached approximately $785 billion as of March 31, 2025, representing a 17% increase year-over-year. Fee-related earnings (FRE) grew to $559 million in Q1 2025, up 21% from $462 million in the same period last year.
As shown in the following chart of Apollo’s segment earnings:
Spread-related earnings (SRE) from the retirement services segment came in at $804 million, slightly down from $817 million in Q1 2024. Principal investing income was notably lower at $14 million compared to $21 million in the prior year period, reflecting what the company described as "cyclically light" realized performance fees.
Asset Management Growth
Apollo’s asset management segment showed robust performance with management fees increasing 18% year-over-year. Fee-related performance fees grew 17% year-over-year, while fee-related expenses increased by 11%.
The company’s total AUM increased by $114 billion (17%) year-over-year, while fee-generating AUM rose by $89 billion (18%). Notably, 60% of total AUM and 75% of total fee-generating AUM is comprised of perpetual capital, providing Apollo with a stable revenue base.
The following chart illustrates the breakdown of Apollo’s assets under management:
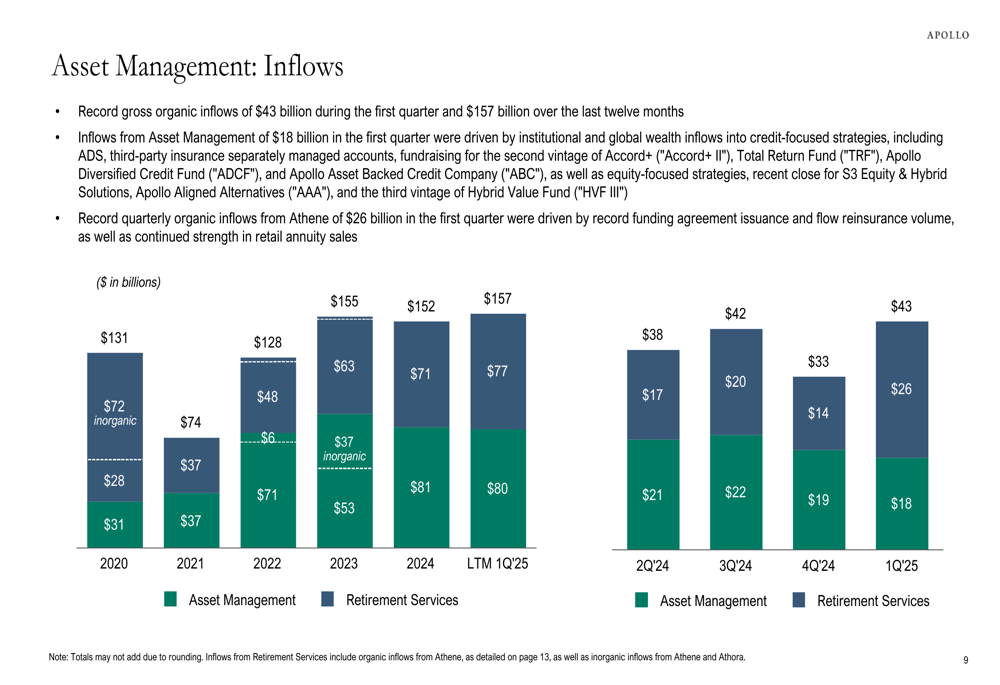
The first quarter saw record gross organic inflows of $43 billion, with $157 billion in inflows over the last twelve months. These inflows came from both the asset management segment ($18 billion) and Athene ($26 billion).
The company’s strong inflow momentum is visualized in this chart:
Retirement Services Performance
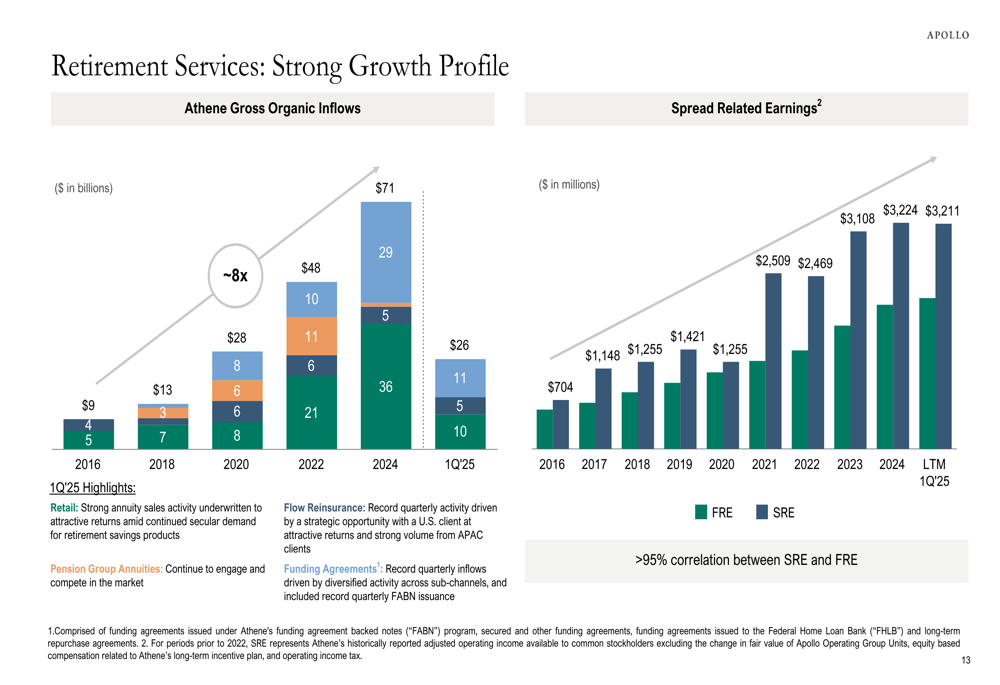
Apollo’s retirement services segment, primarily consisting of Athene, continued to demonstrate strong growth. The company reported that Athene’s portfolio is 97% invested in investment grade assets, reflecting its conservative investment approach.
The following chart shows the portfolio and spread highlights for the retirement services segment:
Athene’s gross organic inflows have grown substantially over time, from $9 billion in 2016 to $71 billion in the last twelve months ending Q1 2025. Similarly, spread-related earnings have increased from $704 million in 2016 to $3.21 billion in the LTM Q1 2025 period.
This long-term growth trajectory is illustrated in the following chart:
Strategic Initiatives & Capital Deployment
Apollo deployed $722 million for share repurchases in the first quarter and returned a total of $1.7 billion to stockholders over the last twelve months. The company also announced the acquisition of Bridge Investment Group in an all-stock transaction for approximately $1.5 billion, which is expected to close in the third quarter of 2025.
The following slide details Apollo’s capital strength and deployment:
The company maintains strong financial strength ratings across its various entities, providing it with a solid foundation for continued growth and expansion.
Forward-Looking Statements
Apollo’s performance in Q1 2025 builds on the momentum seen in previous quarters. In its Q3 2024 earnings call, the company had set ambitious five-year targets, including 20% annual FRE growth and 10% SRE growth, with aims for both FRE and SRE to reach $10 billion by 2029.
The Q1 2025 results suggest Apollo is making progress toward these goals, with strong growth in fee-related earnings and robust inflows. The acquisition of Bridge Investment Group aligns with the company’s strategy of expanding its asset management capabilities and diversifying its revenue streams.
While Apollo’s stock price declined by 2.01% to $135.12 on the day of the earnings announcement, it remains near its 52-week high of $189.49, reflecting overall investor confidence in the company’s long-term strategy and growth prospects.
The combination of strong organic growth, strategic acquisitions, and consistent capital returns to shareholders positions Apollo Global Management to continue its expansion in the alternative asset management space, even as it navigates evolving market conditions.
Full presentation:
This article was generated with the support of AI and reviewed by an editor. For more information see our T&C.