Bitcoin price today: sinks below $86k as mixed US jobs data dents Fed cut hopes

Introduction & Market Context
AvalonBay Communities, Inc. (NYSE:AVB) presented its first quarter 2025 results on May 1, 2025, highlighting strong performance across its diversified portfolio of apartment communities. The company reported Core FFO per share growth of 4.8% year-over-year and same-store residential revenue growth of 3.0%, exceeding initial expectations and leading management to reaffirm its full-year 2025 outlook.
The multifamily REIT continues to benefit from its supply-constrained coastal and suburban portfolio, which is well-positioned for the peak leasing season with positive trends observed through April 2025. AvalonBay’s strategic focus on portfolio optimization and development is yielding results in a market where rental affordability remains favorable compared to homeownership costs.
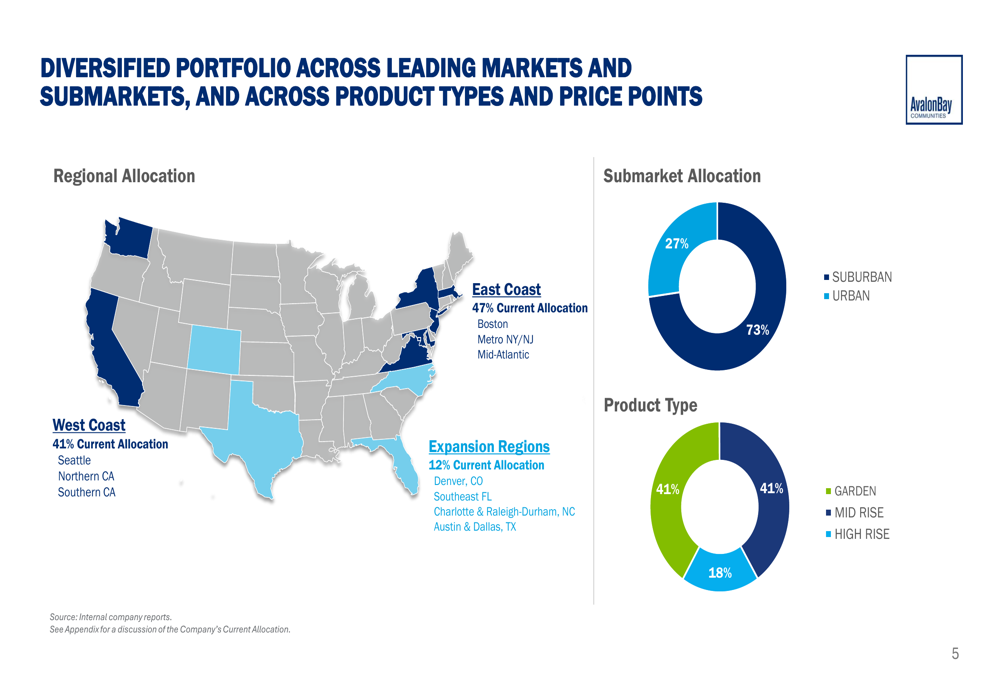
As shown in the following portfolio diversification breakdown, AvalonBay maintains a strategic presence across leading markets, with 41% of its portfolio on the West Coast, 47% on the East Coast, and 12% in expansion regions:
Quarterly Performance Highlights
AvalonBay reported strong financial results for Q1 2025, with Core FFO per share growth of 4.8% year-over-year and same-store residential revenue growth of 3.0%. The company raised $905 million in capital year-to-date with a weighted average initial cost of capital of 4.9%, further strengthening its balance sheet.
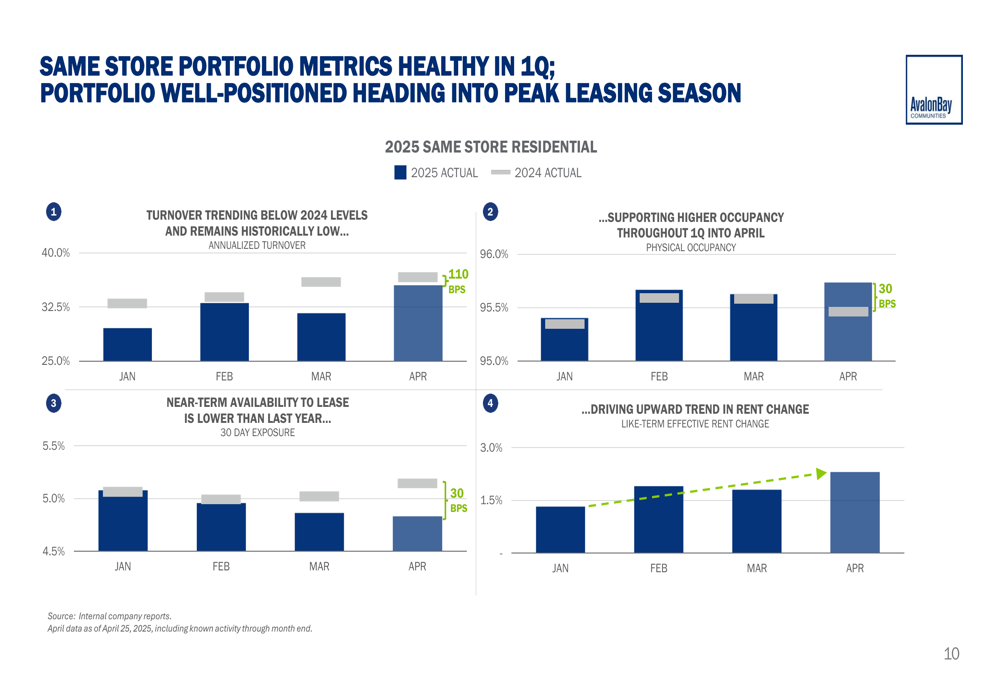
The company’s same-store portfolio metrics show healthy trends, with turnover remaining historically low and occupancy levels higher than the previous year. Near-term availability to lease is lower than last year, supporting an upward trend in rent change:
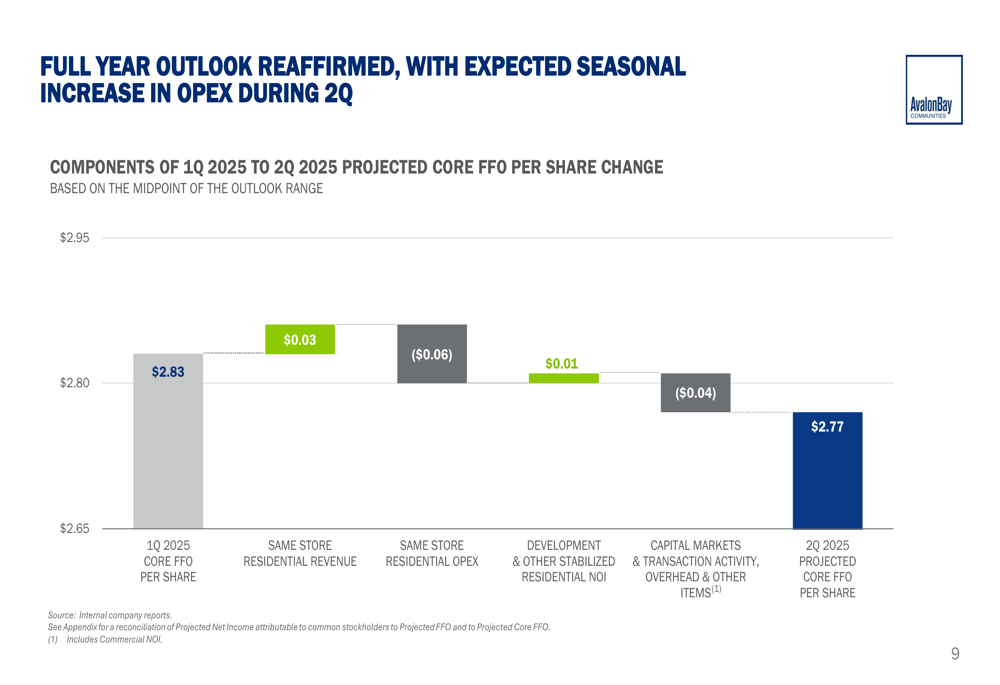
Management projects a slight decrease in Core FFO per share from $2.83 in Q1 2025 to $2.77 in Q2 2025, primarily due to increased operating expenses and capital markets activity, partially offset by growth in same-store residential revenue and development NOI:
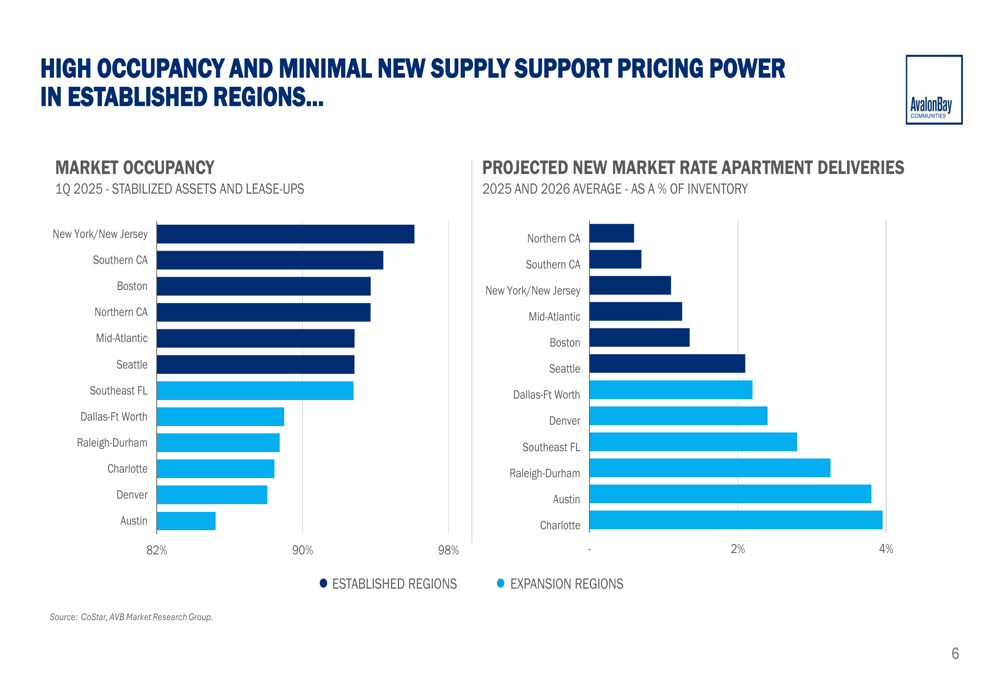
A key factor supporting AvalonBay’s performance is the high occupancy rates across its established regions, coupled with limited new supply in these markets. Occupancy rates in established regions range from 92% to 96%, compared to 82% to 88% in expansion regions. New market rate apartment deliveries as a percentage of inventory for 2025-2026 are significantly lower in established regions (0.7%-1.2%) compared to expansion regions (1.3%-4.0%):
Portfolio Strategy and Optimization
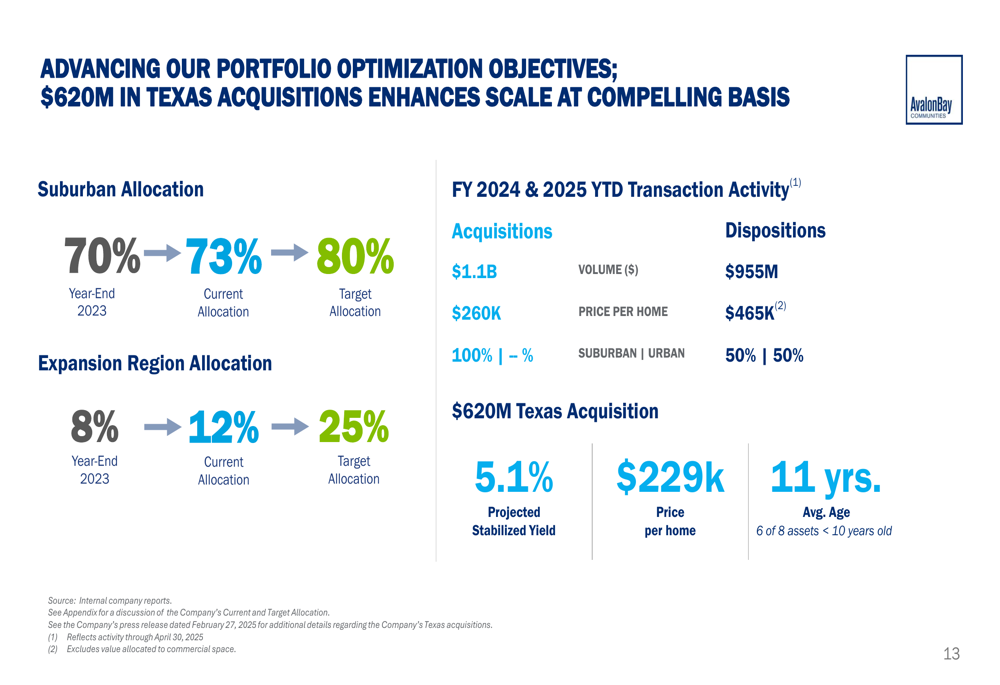
AvalonBay continues to advance its portfolio optimization strategy, with a clear focus on increasing its suburban allocation from 70% at year-end 2023 to a target of 80% (currently at 73%). Similarly, the company aims to grow its presence in expansion regions from 8% at year-end 2023 to 25% (currently at 12%).
This strategic shift is evident in recent transaction activity, with $1.1 billion in acquisitions at an average price of $260,000 per home, compared to $955 million in dispositions at $465,000 per home. Notably, 100% of acquisitions were in suburban locations, compared to a 50/50 split between suburban and urban for dispositions:
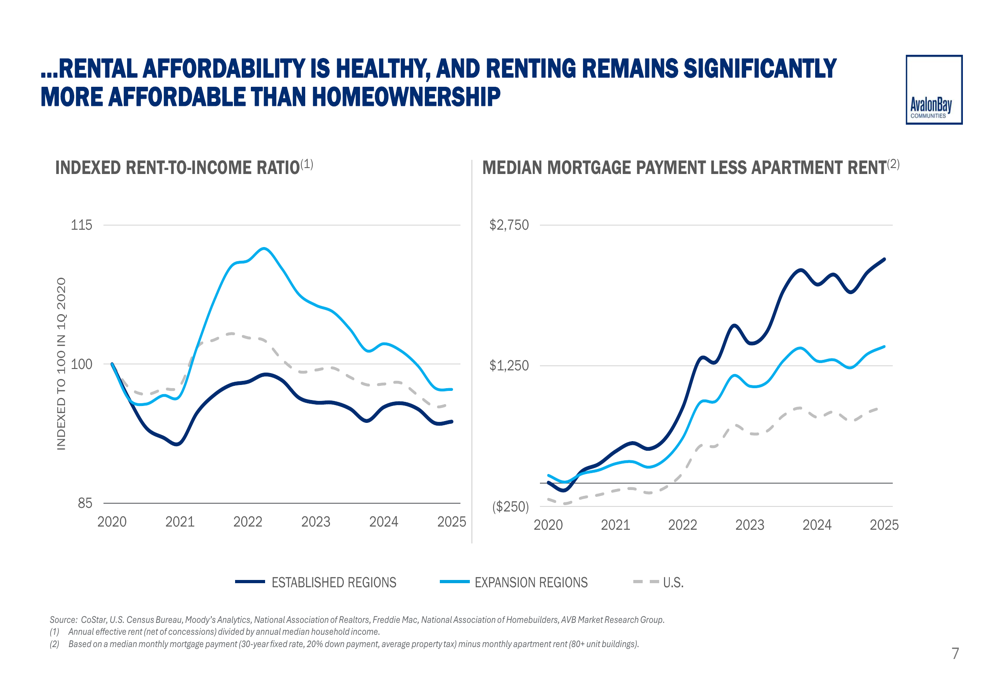
The company’s rental affordability metrics remain healthy, supporting continued demand for AvalonBay properties. The indexed rent-to-income ratio has remained stable, while the gap between median mortgage payments and apartment rents continues to widen, making renting an increasingly attractive option compared to homeownership:
Development Pipeline and Growth Outlook
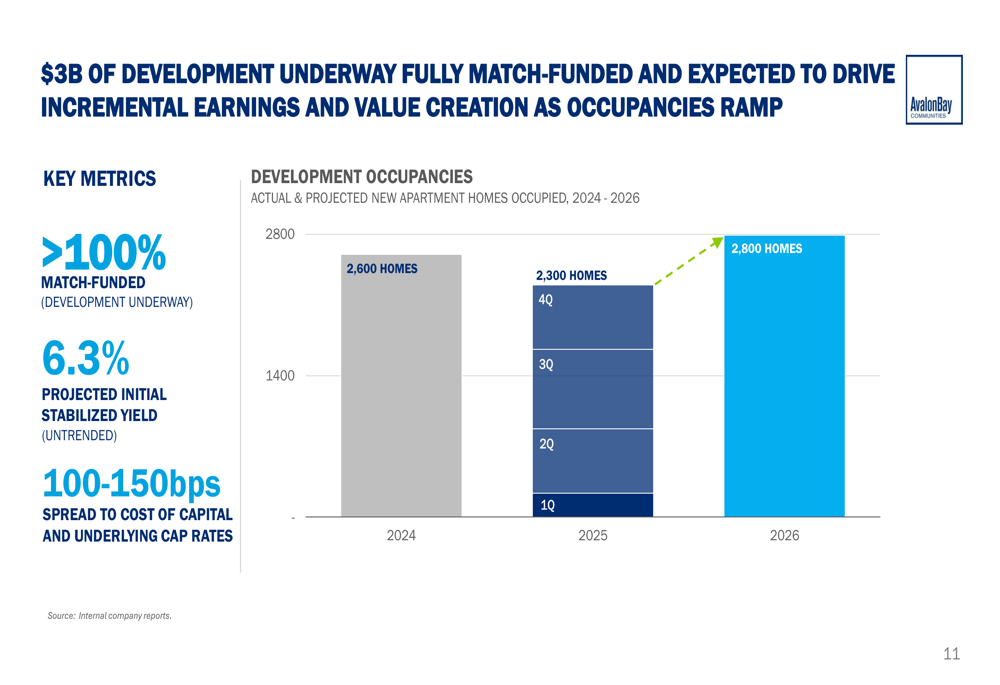
AvalonBay’s $3 billion development pipeline, which is fully match-funded, represents a significant growth driver for the company. The development program is expected to deliver a projected initial stabilized yield of 6.3% (untrended), with a 100-150 basis point spread to cost of capital and underlying cap rates.
The company projects a steady stream of new apartment homes to be occupied over the next three years, with 2,600 homes in 2024, 2,300 homes in 2025, and 2,800 homes in 2026:
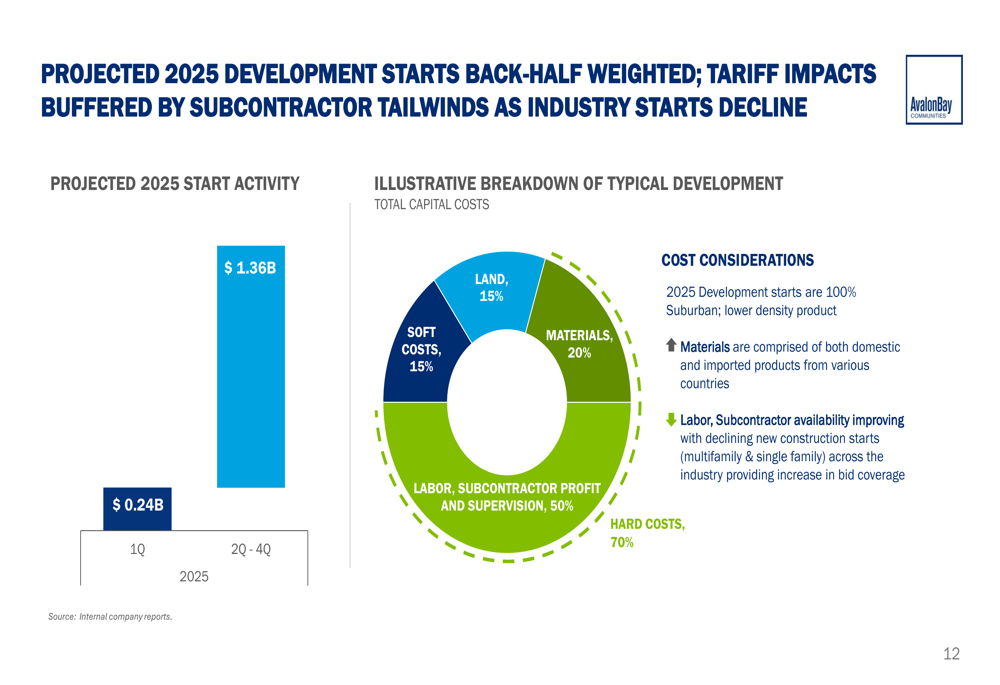
Development starts for 2025 are back-half weighted, with $240 million already initiated in Q1 and an additional $1.36 billion projected for Q2-Q4. The typical development cost breakdown shows that land represents 15% of total capital costs, soft costs 15%, materials 20%, and labor, subcontractor profit, and supervision accounting for 50%:
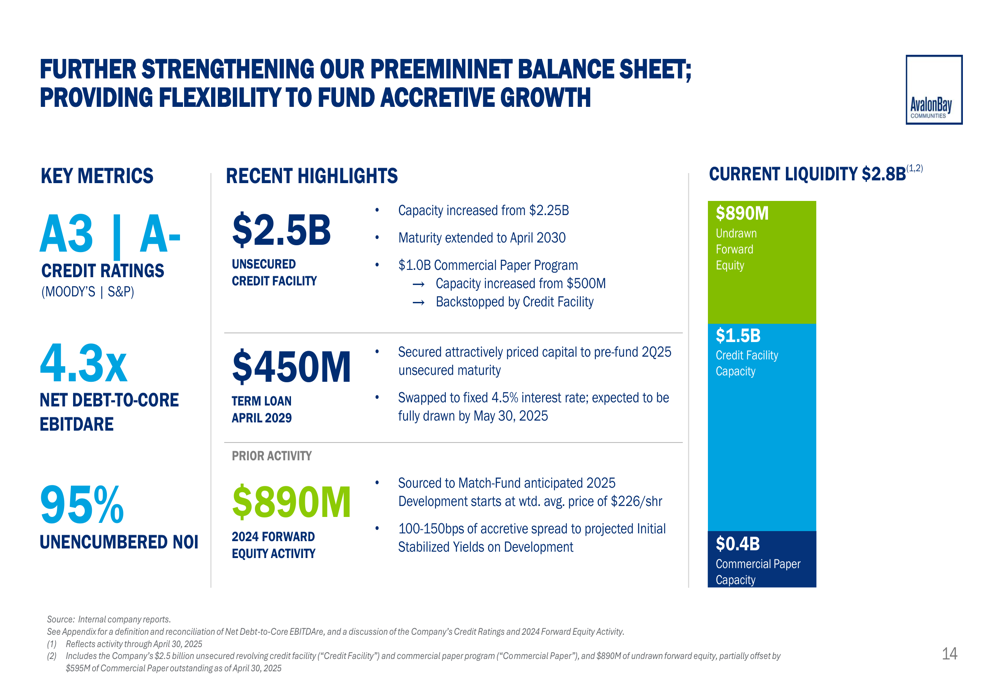
Balance Sheet and Financial Position
AvalonBay continues to strengthen its already robust balance sheet, maintaining credit ratings of A3/A-. The company has a $2.5 billion unsecured credit facility, a net debt-to-Core EBITDAre ratio of 4.3x, and 95% unencumbered NOI.
Recent financial highlights include increased capacity, extended maturity, and an expanded commercial paper program:
Management reaffirmed its full-year 2025 outlook following Q1 results that exceeded initial expectations. The company’s key takeaways emphasize its well-positioned portfolio for the peak leasing season, match-funded development pipeline, strengthened balance sheet, and strong start to the year:
AvalonBay’s Q1 2025 presentation demonstrates the company’s continued execution of its strategic priorities, with a focus on portfolio optimization, development, and maintaining a strong financial position. The company’s performance in established markets and strategic expansion into high-growth regions position it well for sustained growth in the multifamily housing sector.
Full presentation:
This article was generated with the support of AI and reviewed by an editor. For more information see our T&C.