Oil prices extend losses as traders downplay Russia sanction risks

Blue Owl Technology Finance Corp. (NYSE:OTF) reported mixed financial results for the second quarter of 2025, with its net asset value (NAV) per share increasing slightly while net investment income declined. The business development company (BDC), which focuses on lending to upper middle-market technology companies, saw its portfolio expand to $12.7 billion across 184 companies.
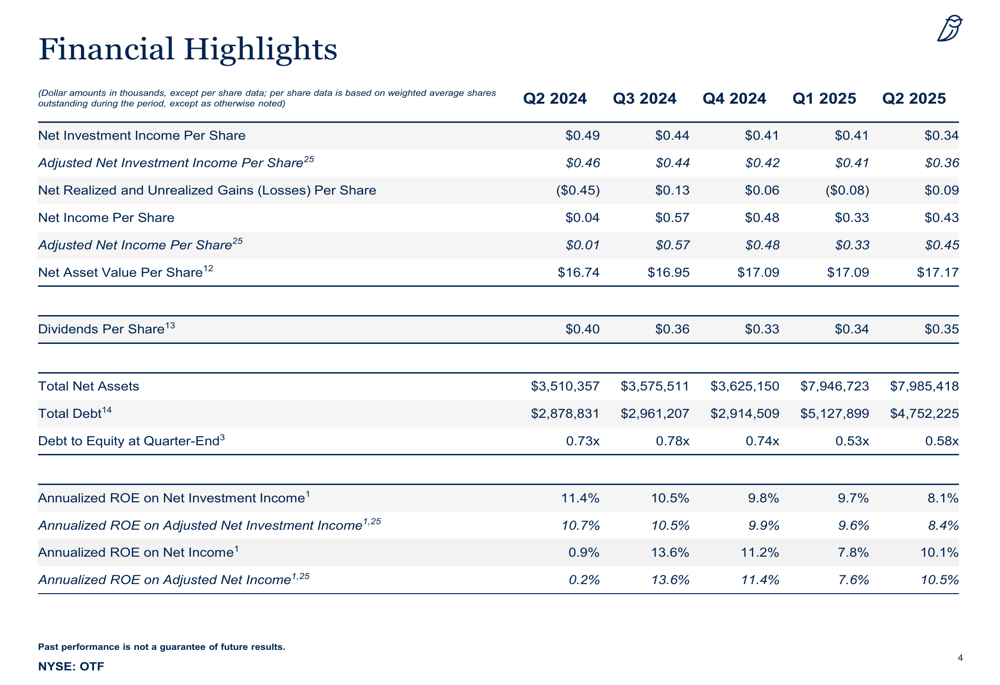
Quarterly Performance Highlights
Blue Owl reported a modest increase in NAV per share to $17.17 as of June 30, 2025, up from $17.09 at the end of the previous quarter. However, adjusted net investment income per share decreased to $0.36 from $0.41 in Q1 2025, while GAAP net investment income per share came in at $0.34.
On a more positive note, adjusted net income per share increased to $0.45 from $0.33 in the previous quarter, with GAAP net income per share at $0.43. The company’s adjusted return on equity (ROE) on net investment income and net income stood at 8.4% and 10.5%, respectively.
As shown in the following quarterly performance indicators chart, Blue Owl has experienced some fluctuation in its key metrics over the past five quarters:
Portfolio Growth and Composition
Blue Owl’s portfolio fair value increased to $12.7 billion across 184 companies, up from $12.1 billion across 181 companies at the end of Q1 2025. The company reported $1.5 billion in new investment commitments during the quarter, with net funded investment activity of $438 million.
The portfolio remains defensively positioned with 81% senior secured investments, including 78% first lien investments. Additionally, 97% of the debt investments are floating rate, providing some protection against interest rate fluctuations.
The following chart illustrates the company’s portfolio asset mix and key borrower statistics:
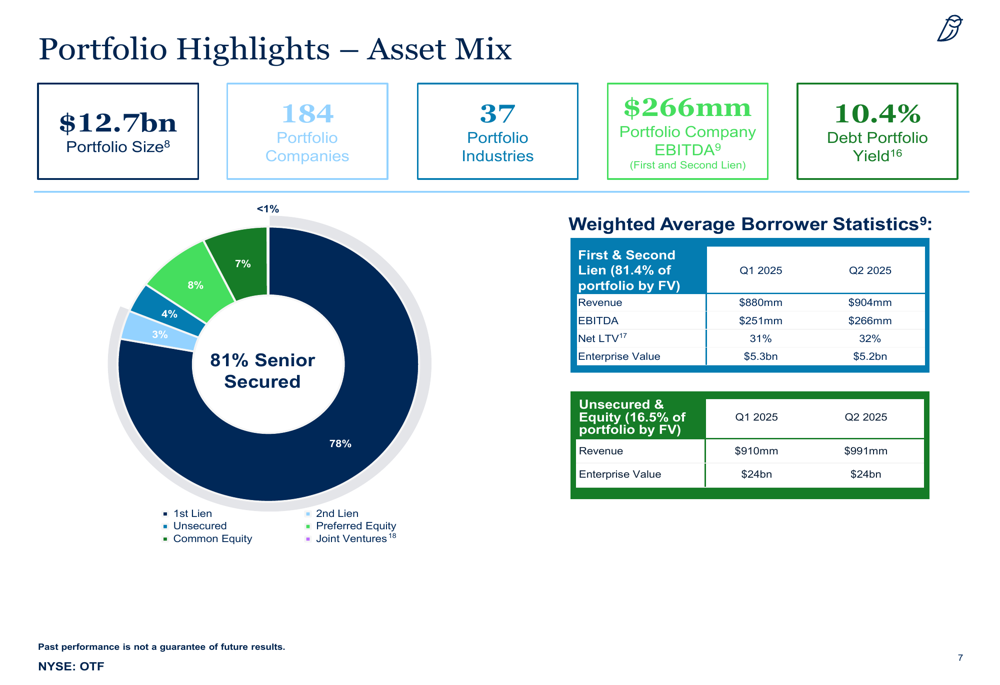
The weighted average EBITDA of portfolio companies in first and second lien investments increased to $266 million in Q2 2025 from $251 million in the previous quarter, indicating Blue Owl’s focus on larger, more established technology companies.
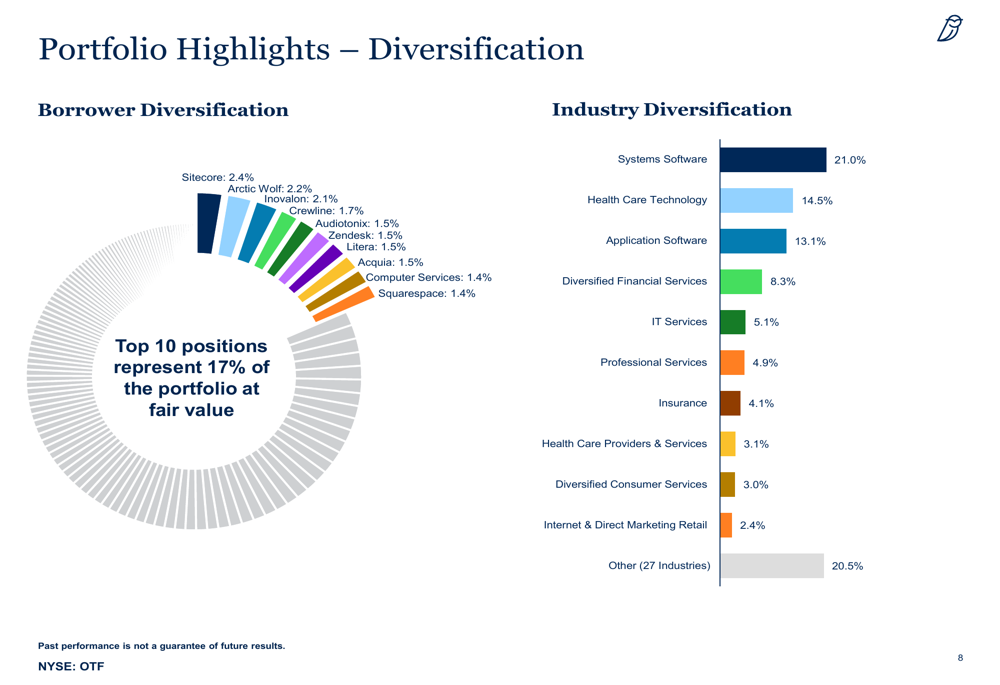
Portfolio diversification remains strong, with the top 10 positions representing only 17% of the portfolio at fair value. The portfolio is spread across 37 industries, with Systems Software (ETR:SOWGn) (21.0%), Health Care Technology (14.5%), and Application Software (13.1%) being the largest sectors.
Credit Quality and Yield Trends
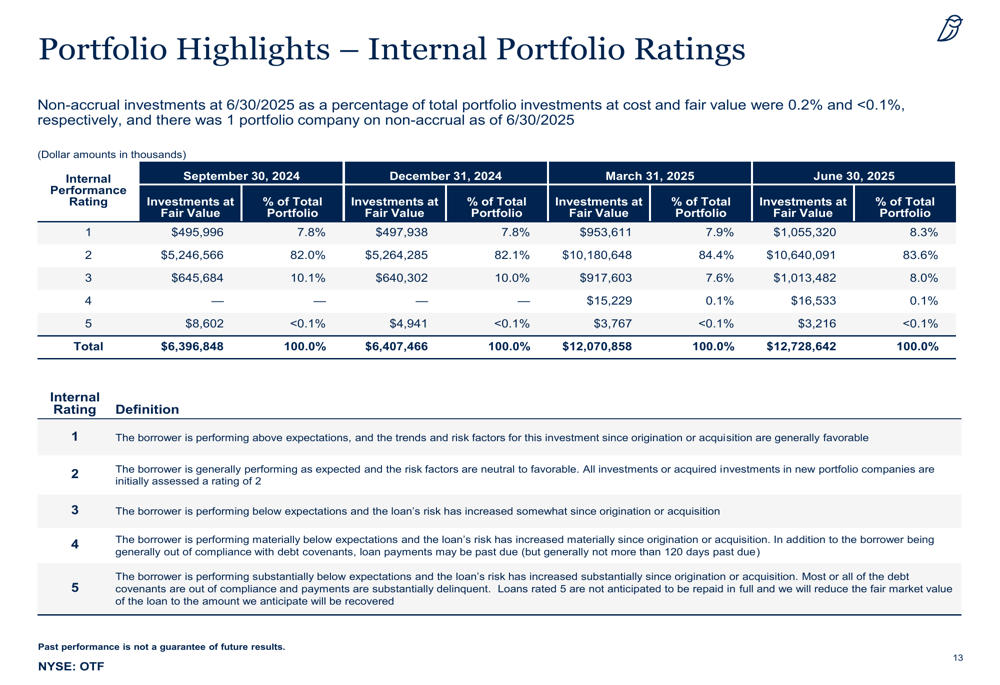
Blue Owl maintained strong credit quality with only one company on non-accrual, representing just 0.2% of the portfolio at cost and less than 0.1% at fair value. The internal portfolio ratings showed no material change to the overall risk profile, with 91.9% of investments rated as performing as expected or better.
As shown in the following portfolio ratings breakdown:
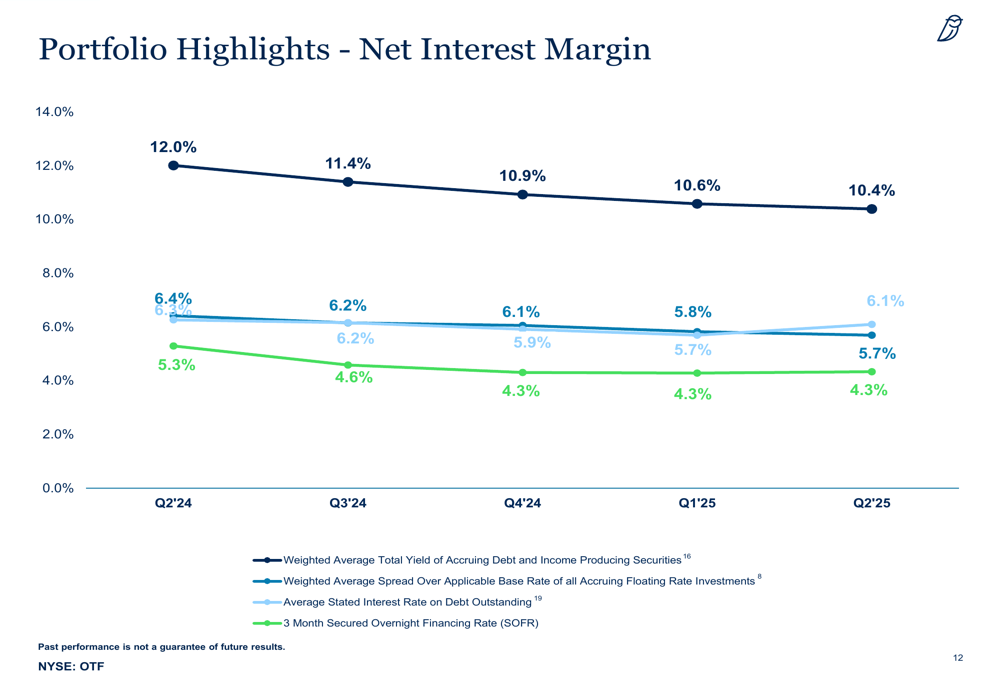
However, the company has experienced a gradual compression in yields. The weighted average total yield of accruing debt and income-producing securities declined to 10.4% in Q2 2025 from 12.0% a year earlier. Similarly, the weighted average spread over the applicable base rate decreased to 5.7% from 6.4% in Q2 2024.
The following chart illustrates these yield trends over time:
Dividend Strategy and Shareholder Returns
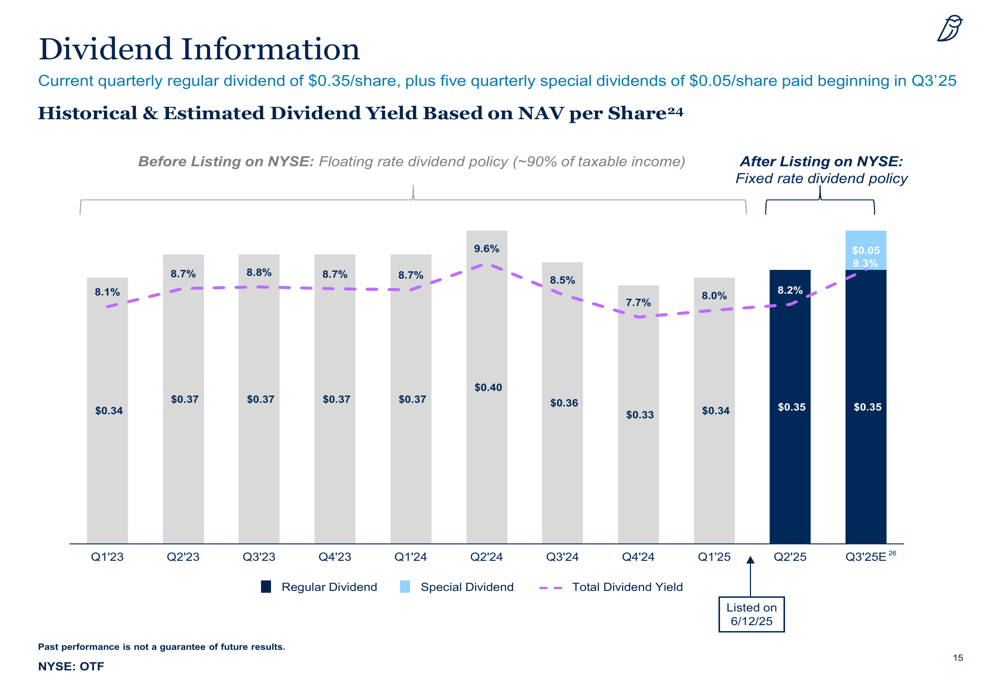
Blue Owl declared a regular quarterly dividend of $0.35 per share for Q2 2025, consistent with its fixed-rate dividend policy since listing on the NYSE. Additionally, the company has declared a series of five special quarterly dividends of $0.05 per share, with the first payment scheduled for October 7, 2025.
The combined regular and special dividends represent an annualized yield of 9.3% based on the Q2 2025 NAV per share, making Blue Owl an attractive option for income-focused investors in the current market environment.
The following chart shows the historical and estimated dividend yield based on NAV per share:
The company also implemented a $200 million share repurchase program in June 2025, providing additional potential for shareholder value creation.
Balance Sheet and Financing
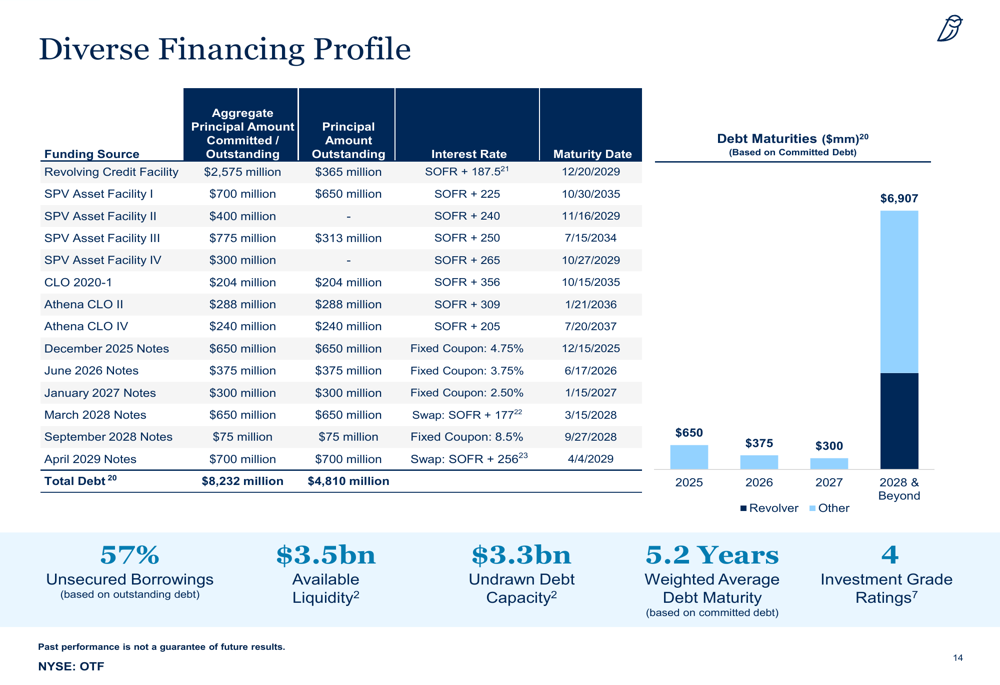
Blue Owl reported total liquidity of $3.5 billion in cash and undrawn debt capacity as of June 30, 2025. The debt-to-equity ratio increased slightly to 0.58x from 0.53x in the previous quarter but remains well below the levels seen in 2024.
The company maintains a diverse financing profile with 57% unsecured borrowings and a weighted average debt maturity of 5.2 years. Blue Owl holds four investment grade credit ratings, underscoring its financial stability.
The debt maturity profile and financing details are illustrated in the following chart:
Outlook and Strategic Position
Blue Owl Technology Finance Corp. continues to position itself as the leading technology-focused public market player in the BDC space. With a market capitalization of $7.0 billion and a portfolio of upper middle-market technology companies, the company appears well-positioned to navigate the current market environment.
The merger with Blue Owl Technology Finance Corp. II, which closed in Q1 2025, has significantly expanded the company’s scale and diversification. While net investment income has declined, the increase in NAV per share and net income suggests the company is managing its portfolio effectively despite yield compression.
For investors seeking income in the current market, Blue Owl’s 9.3% dividend yield, combined with its focus on the resilient technology sector and strong credit quality, presents an attractive investment proposition, though the declining trend in net investment income bears watching in future quarters.
Full presentation:
This article was generated with the support of AI and reviewed by an editor. For more information see our T&C.