Hedge funds cut NFLX, keep big bets on MSFT, AMZN, add NVDA

Introduction & Market Context
Bank of New York Mellon (NYSE:BK) released its second quarter 2025 financial results on July 15, showing strong performance across key metrics. The company’s stock responded positively in premarket trading, rising 1.31% to $96.50, building on its previous close of $95.25. This performance comes as BNY Mellon continues to execute on its strategic initiatives while benefiting from a favorable interest rate environment.
The Q2 results demonstrate continued momentum following a strong first quarter, with significant improvements in revenue, profitability, and operating efficiency. The company’s shares have traded between $60.93 and $95.36 over the past 52 weeks, with current prices near the high end of that range.
Quarterly Performance Highlights
BNY Mellon reported impressive financial results for Q2 2025, with total revenue reaching $5.0 billion, up 9% year-over-year. Earnings per share surged 27% to $1.93, significantly outpacing the previous quarter’s $1.58. The company achieved substantial operating leverage of 495 basis points as expenses grew at a more moderate 4% rate year-over-year.
As shown in the following comprehensive financial highlights slide, BNY Mellon’s pre-tax margin expanded to 37%, up 3 percentage points from the same period last year, while return on tangible common equity (ROTCE) improved to 27.8%, up 3.2 percentage points year-over-year:
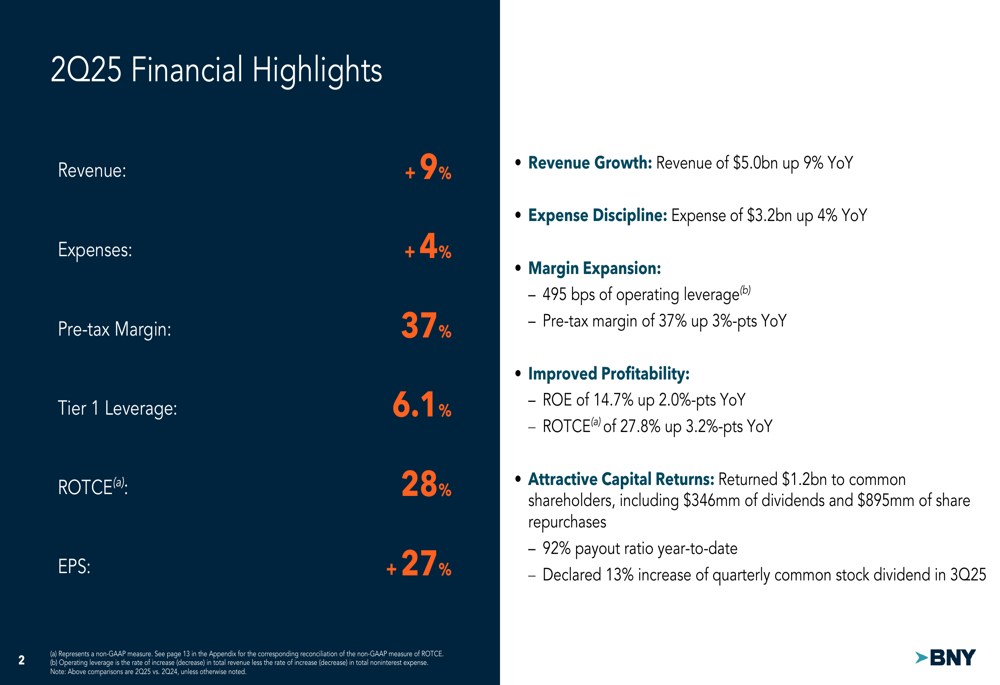
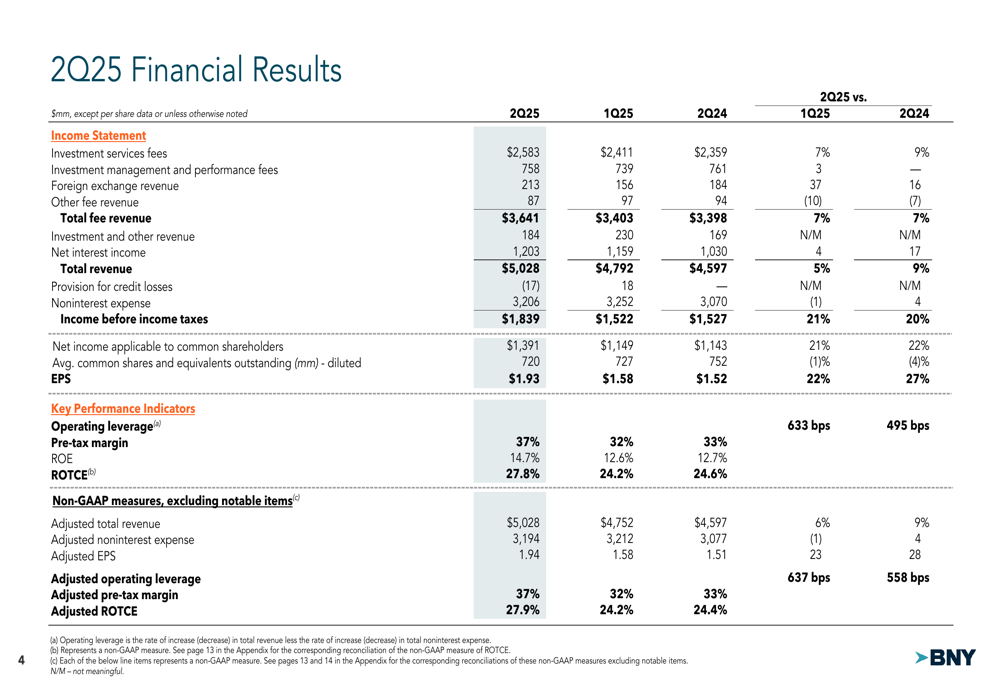
The company’s income statement details reveal strong performance across multiple revenue streams. Net interest income grew 17% year-over-year to $1.2 billion, while total fee revenue increased by 7% to $3.6 billion. This balanced growth demonstrates BNY Mellon’s ability to generate revenue from both interest-earning assets and fee-based services.
The detailed financial results show sequential improvement from Q1 to Q2 2025, with total revenue up 5% and net income applicable to common shareholders increasing by 21%:
Segment Performance Analysis
BNY Mellon’s business segments showed varied performance, with Securities Services and Market and Wealth Services delivering strong results, while Investment and Wealth Management faced some challenges.
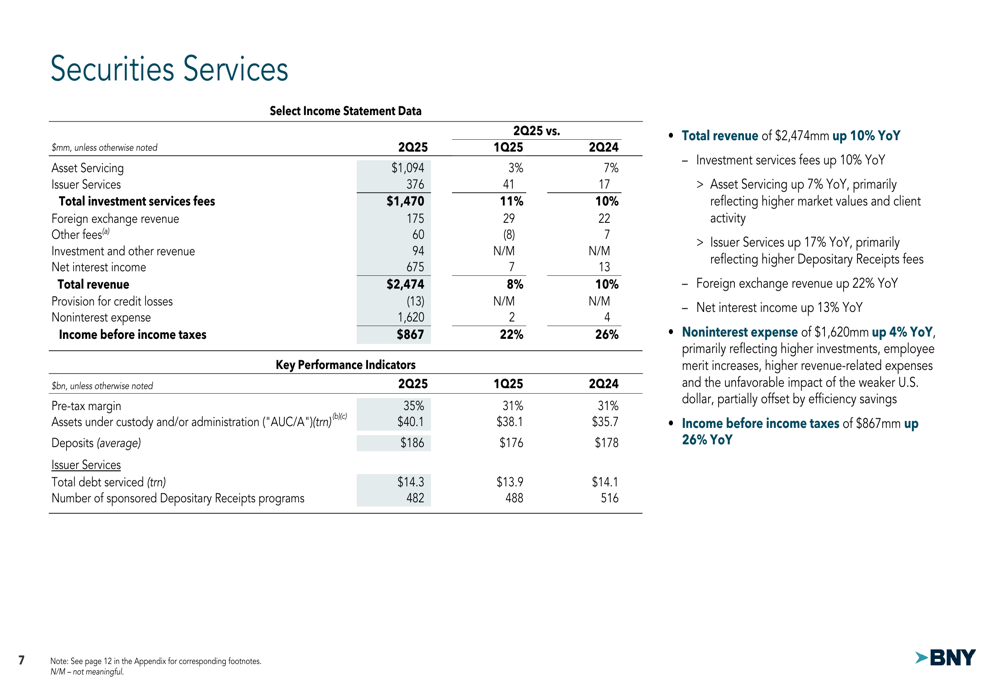
The Securities Services segment, which includes Asset Servicing and Issuer Services, reported total revenue of $2.47 billion, up 10% year-over-year. Income before income taxes rose 26% to $867 million, with the pre-tax margin expanding to 35%. Assets under custody and/or administration (AUC/A) reached $40.1 trillion, up from $35.7 trillion a year ago:
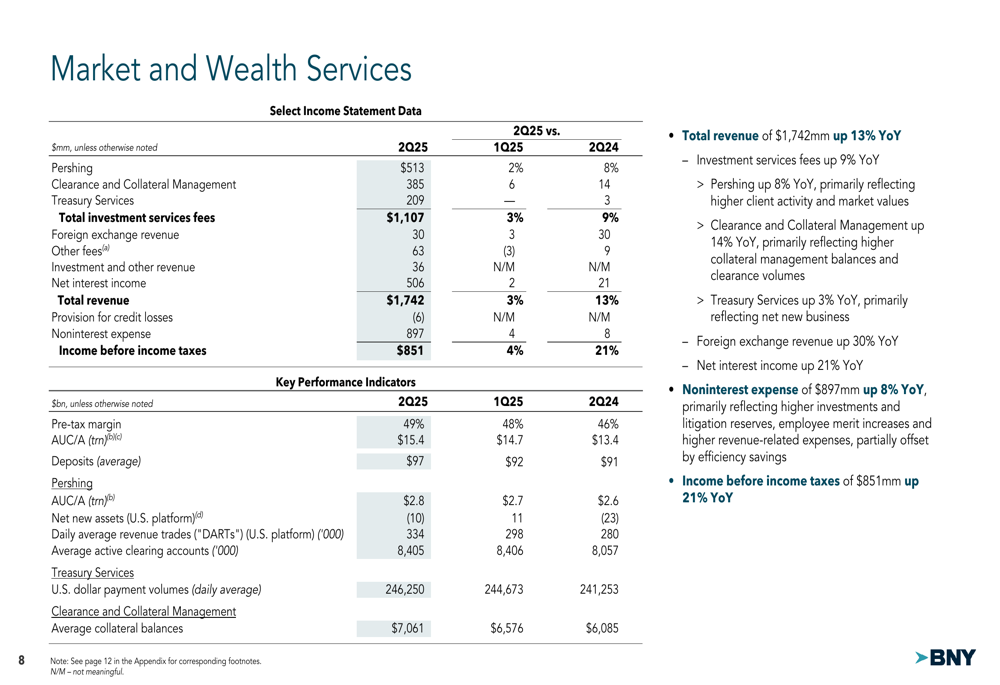
The Market and Wealth Services segment, comprising Pershing, Clearance and Collateral Management, and Treasury Services, delivered even stronger profitability with a pre-tax margin of 49%. Total (EPA:TTEF) revenue increased 13% year-over-year to $1.74 billion, while income before income taxes grew 21% to $851 million:
In contrast, the Investment and Wealth Management segment faced headwinds, with total revenue declining 2% year-over-year to $801 million. Despite this, the segment maintained a pre-tax margin of 19%, and income before income taxes was relatively flat compared to the prior year.
Strategic Initiatives and Business Update
BNY Mellon’s mid-year business update highlighted the company’s progress on key strategic initiatives across three main areas: client relationships, operational efficiency, and corporate culture.
The company reported two consecutive quarters of record sales performance and an increasing number of multi-product client relationships. BNY Mellon is transitioning to a platforms operating model, with over 50% of employees already transitioned. The company expects approximately $0.5 billion of incremental investments and $0.5 billion of efficiency savings in 2025.
As illustrated in the following slide, BNY Mellon has shown consistent improvement in key metrics over recent years, with total revenue growth of 5% in the first half of 2025, following 8% growth in 2024. The company’s pre-tax margin has expanded significantly from 21% in FY22 to 34% in 1H25:
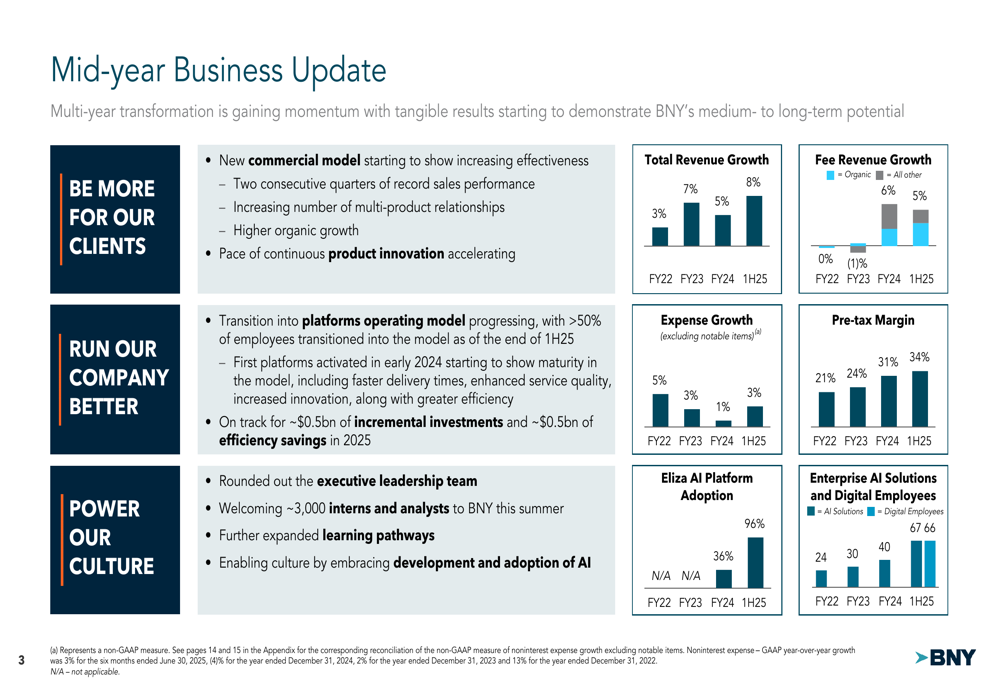
A notable aspect of BNY Mellon’s strategy is its focus on AI adoption. The Eliza AI Platform has reached 96% adoption in the first half of 2025, up from 36% in FY24. The company has also increased its enterprise AI solutions to 66 in 1H25, compared to 45 in FY24.
Net Interest Income and Balance Sheet Trends
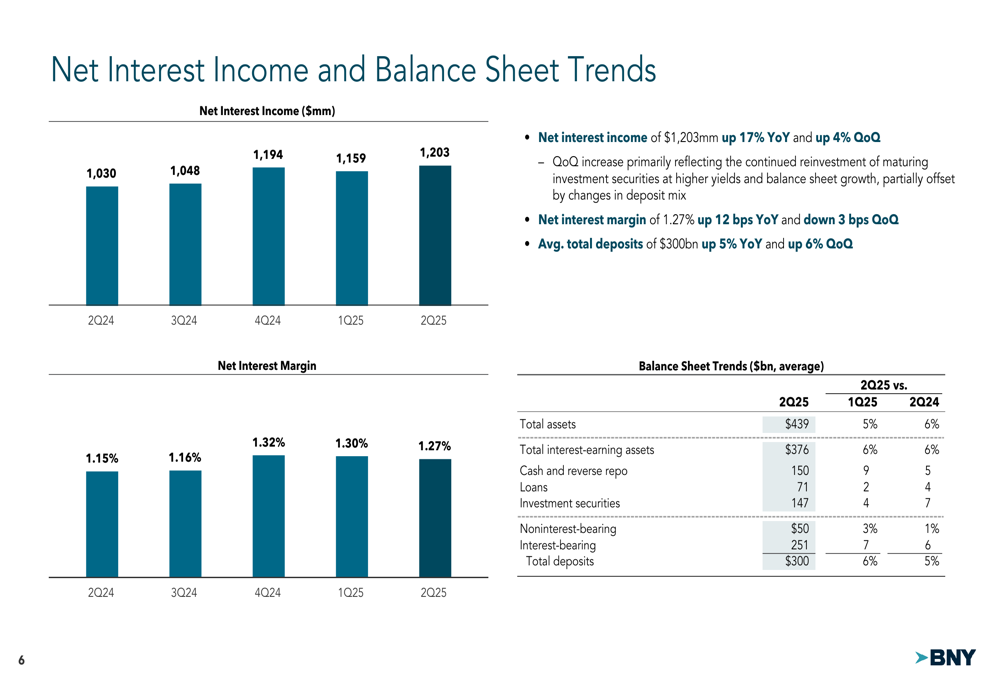
BNY Mellon’s net interest income continues to be a significant driver of overall performance. Net interest income reached $1,203 million in Q2 2025, up 17% year-over-year and 4% quarter-over-quarter. The net interest margin was 1.27%, up 12 basis points year-over-year but down 3 basis points from the previous quarter.
The company’s balance sheet showed healthy growth, with average total assets increasing 6% year-over-year to $439 billion. Average total deposits grew 5% year-over-year to $300 billion, with interest-bearing deposits up 6% and noninterest-bearing deposits up 1%. These trends are illustrated in the following slide:
Capital and Liquidity Position
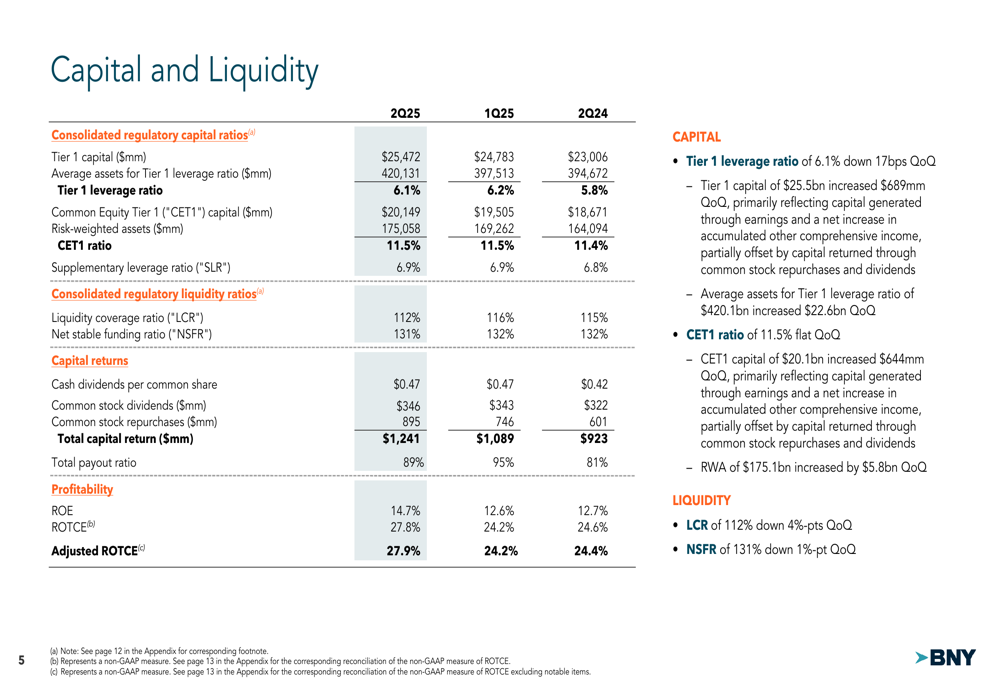
BNY Mellon maintained strong capital and liquidity positions in Q2 2025. The company’s Tier 1 leverage ratio stood at 6.1%, while the Common Equity Tier 1 (CET1) ratio was 11.5%. The liquidity coverage ratio (LCR) was 112%, well above regulatory requirements.
The company continued to return significant capital to shareholders, with total capital returns of $1.24 billion in Q2 2025, including $346 million in dividends and $895 million in share repurchases. The total payout ratio was 89% for the quarter and 92% year-to-date. Notably, BNY Mellon declared a 13% increase in its quarterly common stock dividend for Q3 2025.
As shown in the following capital and liquidity slide, the company’s profitability metrics continue to improve, with ROE reaching 14.7% and ROTCE at 27.8%:
Updated 2025 Outlook
BNY Mellon has updated its financial outlook for 2025, raising guidance for net interest income growth while maintaining its commitment to positive operating leverage and attractive capital returns.
The company now expects net interest income to grow at a high-single-digit percentage year-over-year, up from the previous guidance of mid-single-digit growth. Expense growth is projected at approximately 3% year-over-year, slightly higher than the original 1-2% guidance, reflecting increased investments in the business.
The updated outlook, compared to the original guidance and first-half performance, is detailed in the following slide:
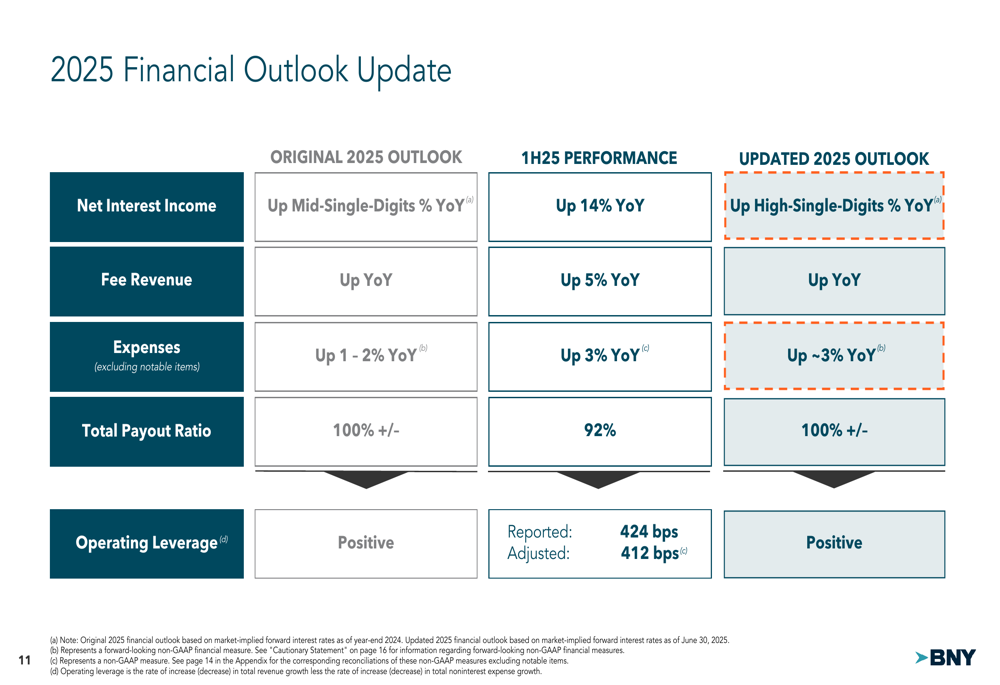
BNY Mellon continues to target a total payout ratio of approximately 100%, indicating its commitment to returning capital to shareholders through dividends and share repurchases.
Conclusion
BNY Mellon’s Q2 2025 results demonstrate the company’s ability to deliver strong financial performance while investing in strategic initiatives. The 9% revenue growth, 27% EPS increase, and expanding margins reflect effective execution across most business segments. The company’s updated outlook suggests continued momentum through the remainder of 2025, particularly in net interest income growth.
With solid capital and liquidity positions, BNY Mellon is well-positioned to navigate market conditions while returning significant capital to shareholders. The 13% increase in quarterly dividend further underscores management’s confidence in the company’s financial strength and future prospects.
Full presentation:
This article was generated with the support of AI and reviewed by an editor. For more information see our T&C.