TSX runs higher on rate cut expectations

Capital Southwest Corporation (NASDAQ:CSWC), a middle-market lending firm focused on supporting acquisitions and growth, presented its first quarter fiscal year 2026 earnings results on August 7, 2025, highlighting solid financial performance and strategic developments.
Quarterly Performance Highlights
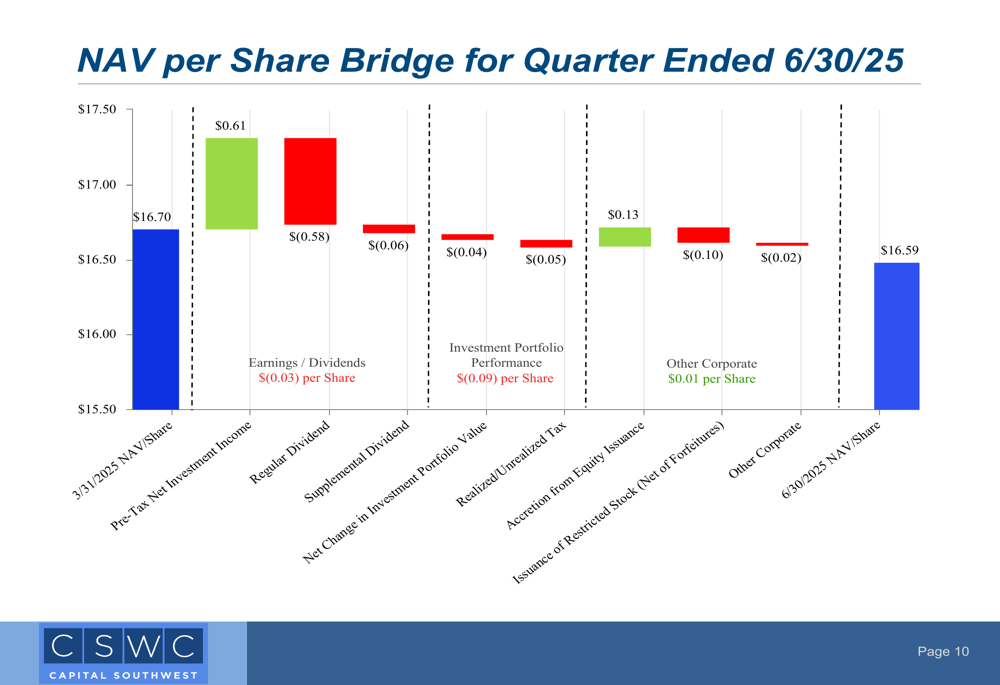
The company reported Pre-Tax Net Investment Income of $32.7 million or $0.61 per share for the quarter ended June 30, 2025. Capital Southwest also announced a transition to monthly dividend payments of $0.1934 per share, along with a supplemental dividend of $0.06 for the quarter.
"We’re able to find yield... and meet or exceed analyst expectations," noted CEO Michael Sarner in a previous earnings call, emphasizing the company’s strategic focus on maintaining strong returns for shareholders.
The company’s Net Asset Value (NAV) per share experienced a slight decrease from $16.70 on March 31, 2025, to $16.59 on June 30, 2025. This change was primarily influenced by dividend distributions, partially offset by strong investment income and accretion from equity issuance.
As shown in the following NAV bridge chart:
Capital Southwest generated net realized gains of $27.2 million during the quarter, primarily from portfolio exits. The company exited three debt investments and two equity investments, generating total proceeds of $80.6 million. Since launching its credit strategy in January 2015, the company has achieved a cumulative weighted average IRR of 13.6% on 101 portfolio company exits, generating $1.2 billion in proceeds.
Portfolio Composition and Quality
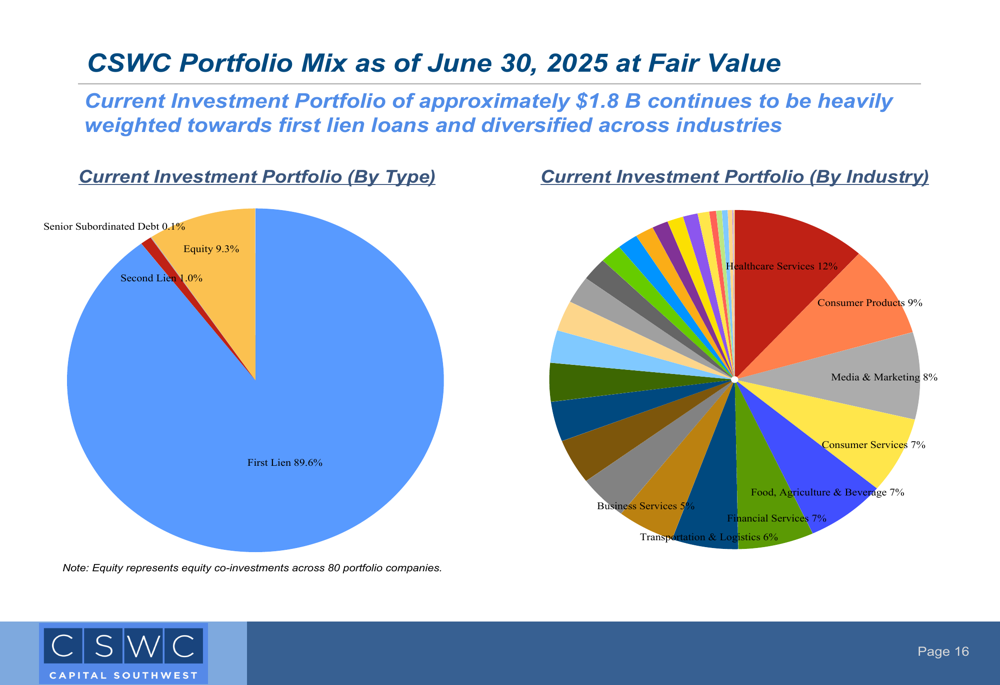
As of June 30, 2025, Capital Southwest’s investment portfolio at fair value totaled $1.8 billion across 122 portfolio companies. The portfolio remains heavily weighted toward first lien investments, which comprise 89.6% of the total portfolio, with the remainder consisting of second lien (1.0%), subordinated debt (0.1%), and equity investments (9.3%).
The following chart illustrates the detailed composition of the investment portfolio:
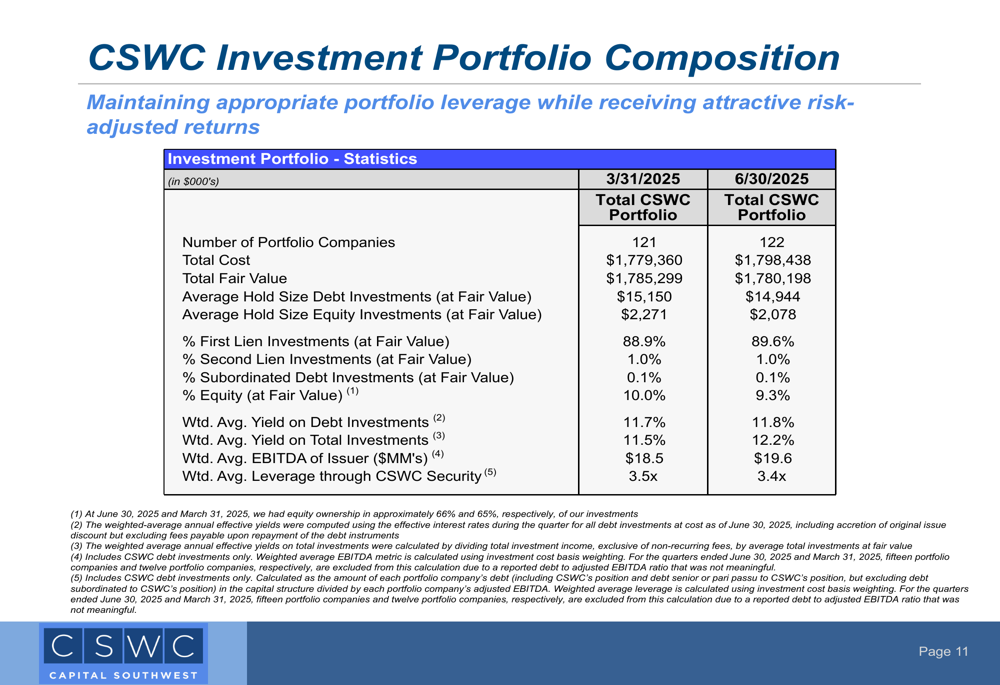
Portfolio credit quality remains strong, with approximately 92% of all debt investments currently rated in the top two categories of the company’s internal rating system. The weighted average yield on debt investments was 11.8%, while the weighted average EBITDA of portfolio companies was $19.6 million with average leverage of 3.4x.
The company’s investment portfolio is well-diversified across industries, with healthcare services (12%), consumer products (9%), and media & marketing (8%) representing the largest sector allocations.
As shown in the following portfolio mix visualization:
Strategic Initiatives and Capital Structure
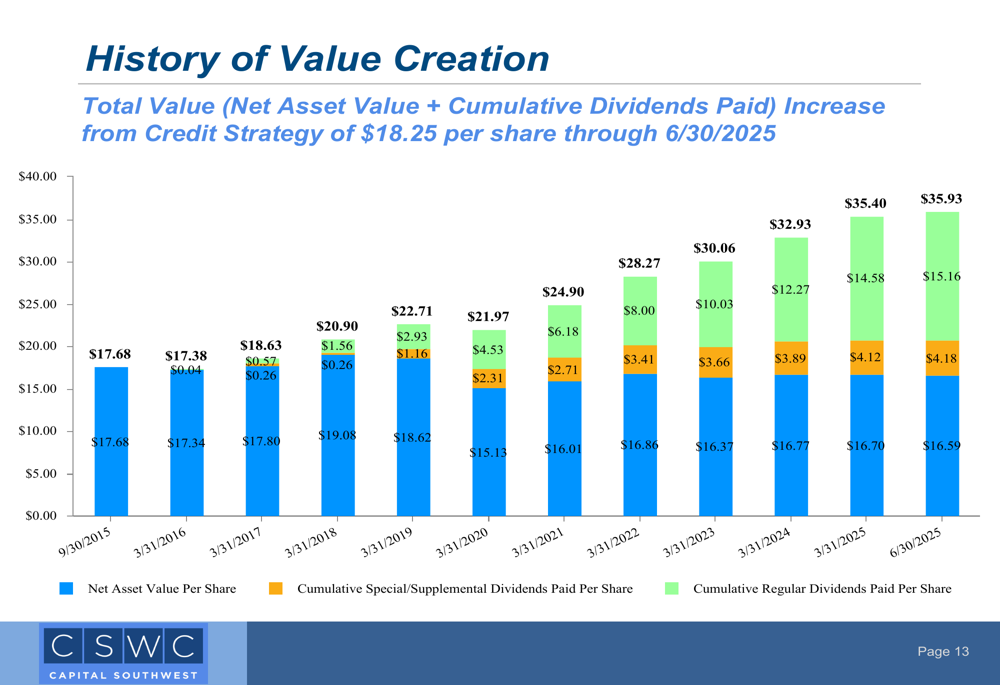
Capital Southwest continues to demonstrate a track record of consistent value creation for shareholders. The company has generated $18.25 per share in total value (NAV plus cumulative dividends paid) since implementing its credit strategy.
The following chart illustrates this history of value creation:
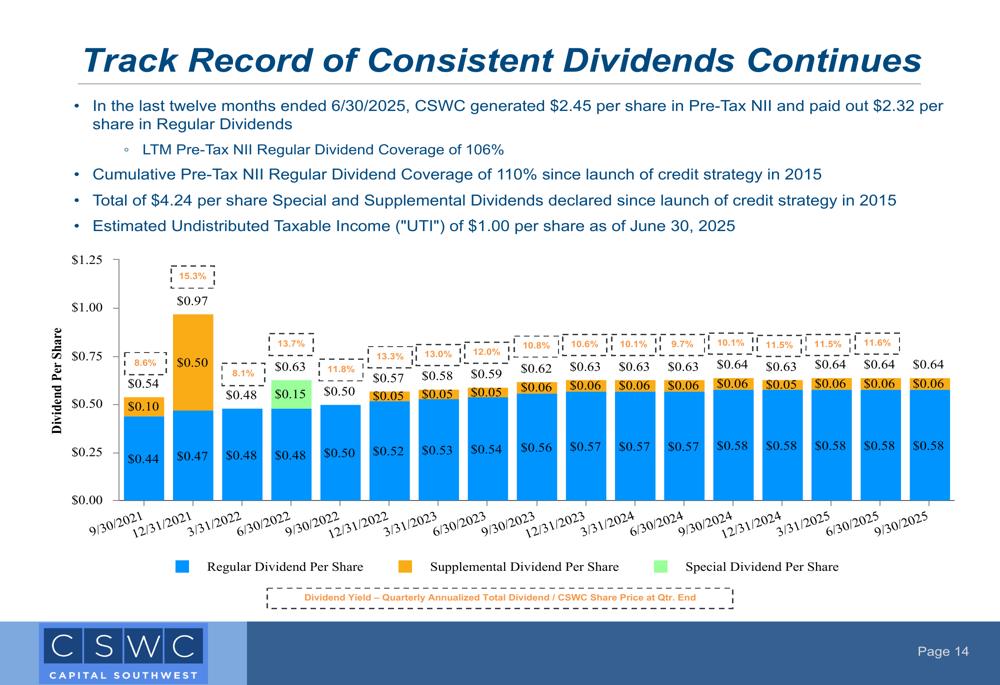
The company has maintained strong dividend coverage, with a last twelve months Pre-Tax NII Regular Dividend Coverage of 106%. In the last twelve months ended June 30, 2025, Capital Southwest generated $2.45 per share in Pre-Tax NII and paid out $2.32 per share in regular dividends.
This consistent dividend performance is illustrated in the following chart:
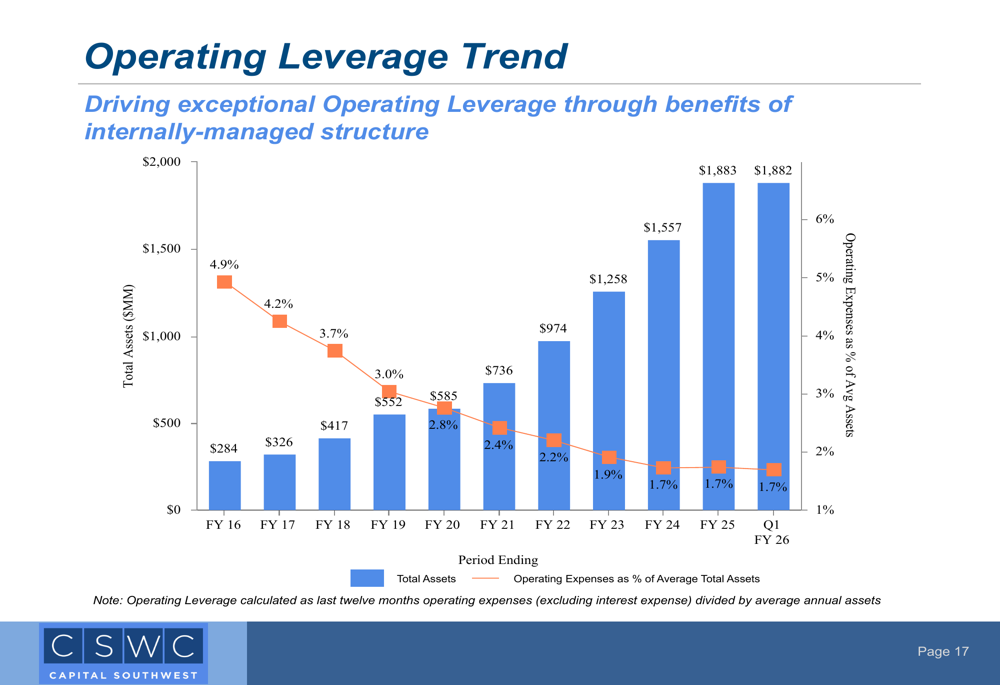
Capital Southwest has significantly improved its operating leverage over time. As total assets have grown from approximately $284 million in fiscal year 2016 to over $1.8 billion in Q1 fiscal year 2026, operating expenses as a percentage of average total assets have decreased from above 4.5% to close to 1.5%.
The trend in operating leverage is depicted in the following chart:
Capital Structure and Liquidity
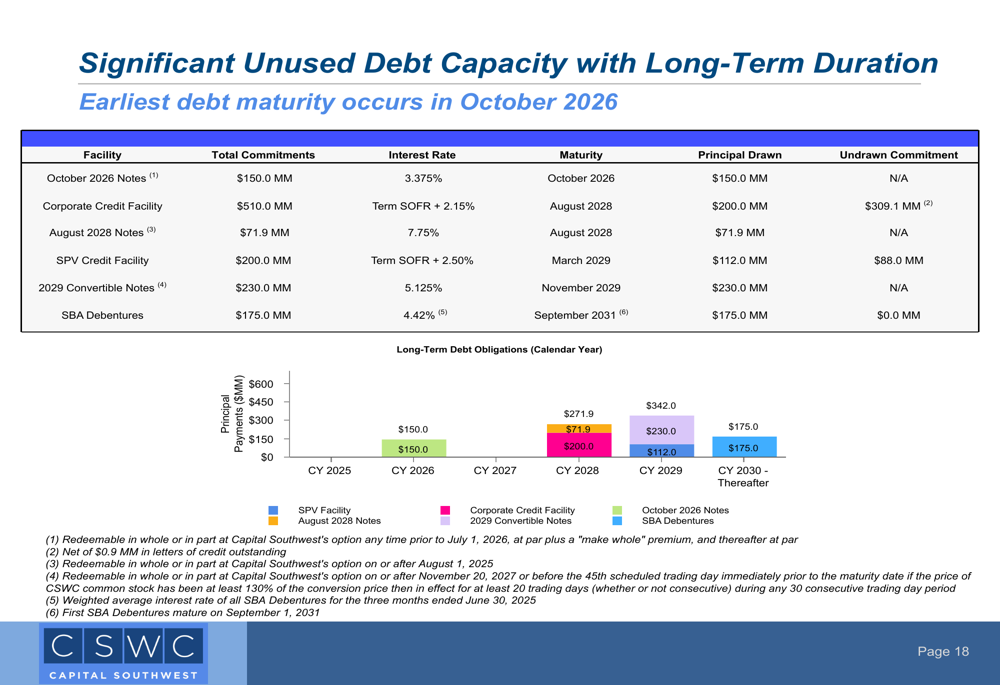
The company maintains a strong balance sheet with $397 million available under credit facilities and $47 million in cash as of June 30, 2025. Capital Southwest’s regulatory debt-to-equity ratio stood at 0.82x, providing significant headroom under the regulatory limit.
During the quarter, Capital Southwest received its second SBIC license, which enhances the company’s financing capabilities by providing access to additional SBA (LON:SBA) debentures. The company also raised $41.7 million through its Equity ATM Program at an average price of $20.50 per share.
The company’s debt maturity profile is well-structured with no near-term maturities, as shown in the following chart:
Income Statement Performance
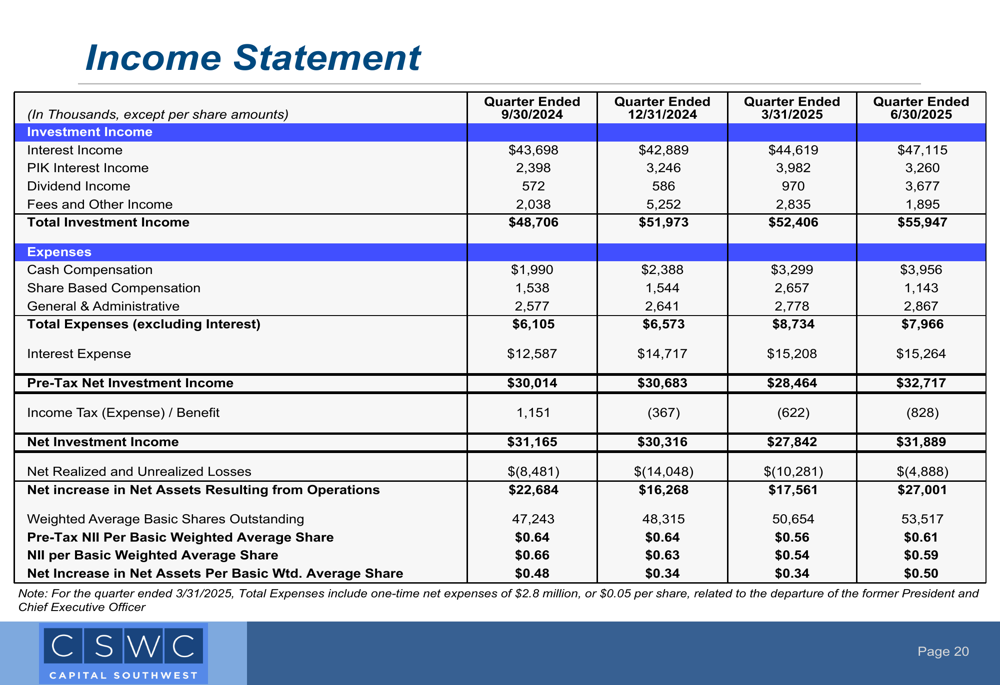
Capital Southwest’s income statement shows consistent growth in investment income and pre-tax net investment income over recent quarters. For the quarter ended June 30, 2025, total investment income reached $55.9 million, up from $48.7 million for the quarter ended September 30, 2024.
The detailed income statement performance is presented below:
Forward-Looking Statements
Looking ahead, Capital Southwest remains focused on its lower middle market credit strategy, targeting companies with EBITDA between $3 million and $25 million. The company continues to lead financing transactions primarily backing private equity firms, with investments ranging from $5 million to $50 million.
Management anticipates continued origination activity in the upcoming quarters, building on the $115.2 million in total new committed investments made during Q1 2026. The company’s interest rate sensitivity analysis indicates that while decreases in base interest rates would negatively impact net investment income, the predominantly floating-rate nature of the portfolio (99% of credit investments) provides some protection against interest rate fluctuations.
Capital Southwest’s strong balance sheet, disciplined investment approach, and focus on first lien senior secured loans position the company well to navigate potential market volatility while continuing to deliver value to shareholders.
Full presentation:
This article was generated with the support of AI and reviewed by an editor. For more information see our T&C.