Microvast Holdings announces departure of chief financial officer

Carlyle Secured Lending, Inc. (NASDAQ:CGBD) released its first quarter 2025 earnings presentation on May 7, highlighting the completion of its strategic merger with Carlyle Secured Lending III while reporting declining income metrics and rising non-accruals. The stock closed at $14.24 on May 6, trading at a significant discount to its reported NAV of $16.63 per share.
Executive Summary
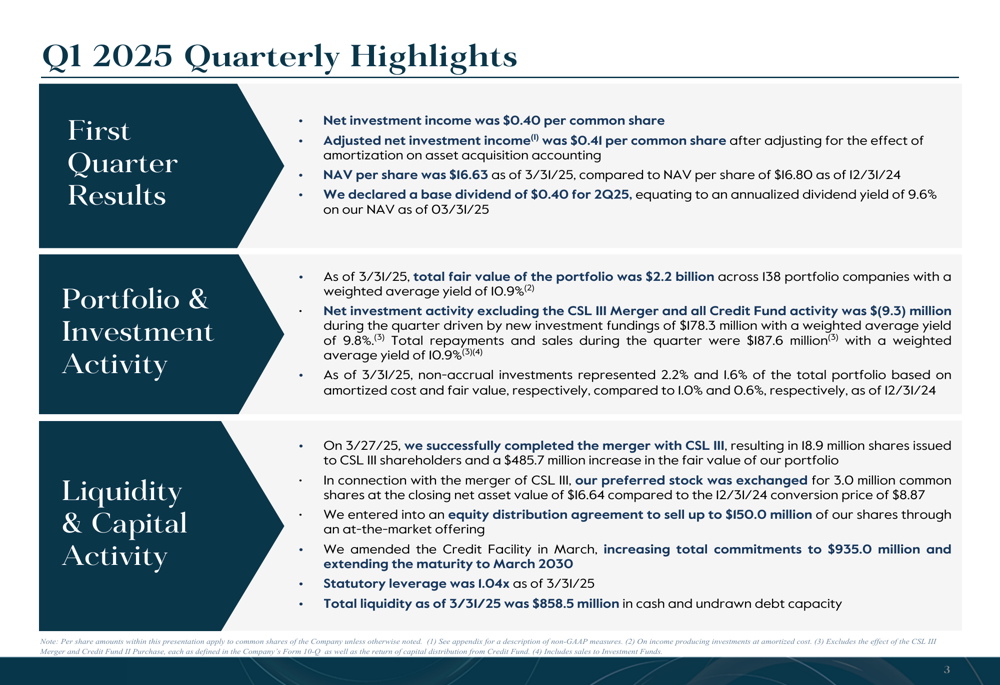
Carlyle Secured Lending reported net investment income of $0.40 per share for Q1 2025, down from $0.47 in the previous quarter and $0.54 in Q1 2024. The company declared a base dividend of $0.40 per share for Q2 2025, representing an annualized yield of 9.6% on NAV. The merger with CSL (OTC:CSLLY) III, completed on March 27, 2025, significantly expanded CGBD’s portfolio to $2.2 billion across 138 portfolio companies.
As shown in the following quarterly highlights summary, the company maintained 100% dividend coverage while reporting a slight decrease in NAV:
Quarterly Performance Highlights
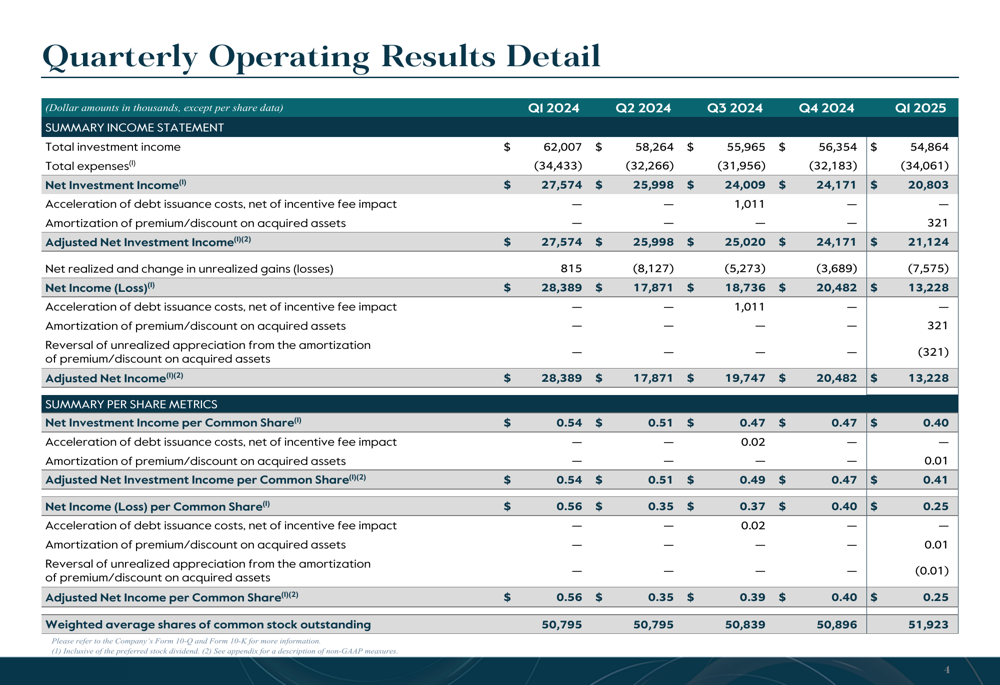
CGBD’s financial results showed a continuing trend of declining income, with total investment income falling to $54.9 million in Q1 2025 from $56.4 million in Q4 2024 and $62.0 million in Q1 2024. Net investment income per share decreased to $0.40, compared to $0.47 in the previous quarter and $0.54 a year earlier.
The company’s detailed quarterly operating results reveal this downward trend in income metrics over the past five quarters:
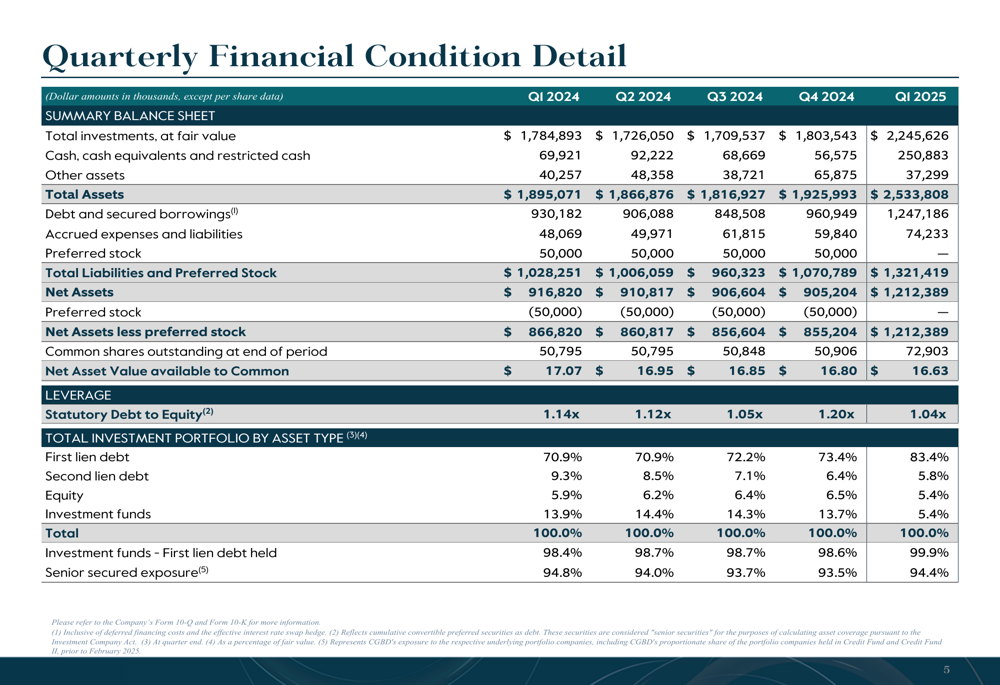
Despite the income decline, CGBD’s balance sheet strengthened significantly following the CSL III merger. Total (EPA:TTEF) investments at fair value increased to $2.25 billion as of March 31, 2025, compared to $1.80 billion at the end of 2024. The company’s statutory debt-to-equity ratio improved to 1.04x from 1.20x in the previous quarter, reflecting a more conservative leverage profile.
The following table details the quarterly financial condition, highlighting the expanded balance sheet and improved leverage metrics:
Portfolio Composition & Credit Quality
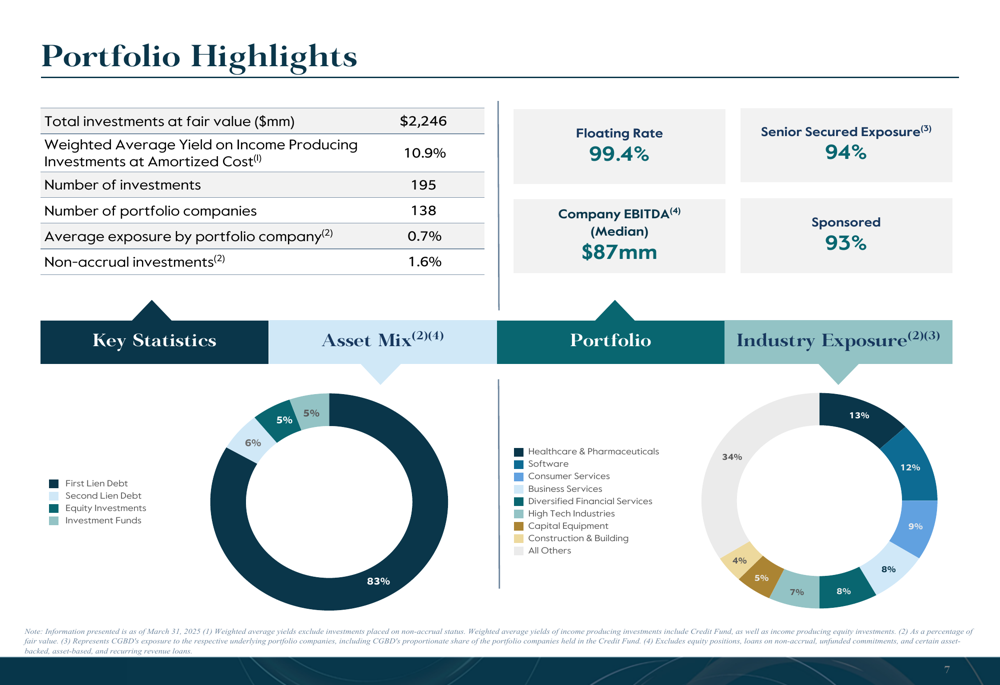
CGBD maintained its focus on senior secured lending, with first lien debt increasing to 83.4% of the portfolio in Q1 2025, up from 73.4% in Q4 2024. The portfolio remained well-diversified across industries, with healthcare & pharmaceuticals (34%) and software (12%) representing the largest exposures.
The following portfolio highlights provide a comprehensive overview of CGBD’s investment approach and diversification:
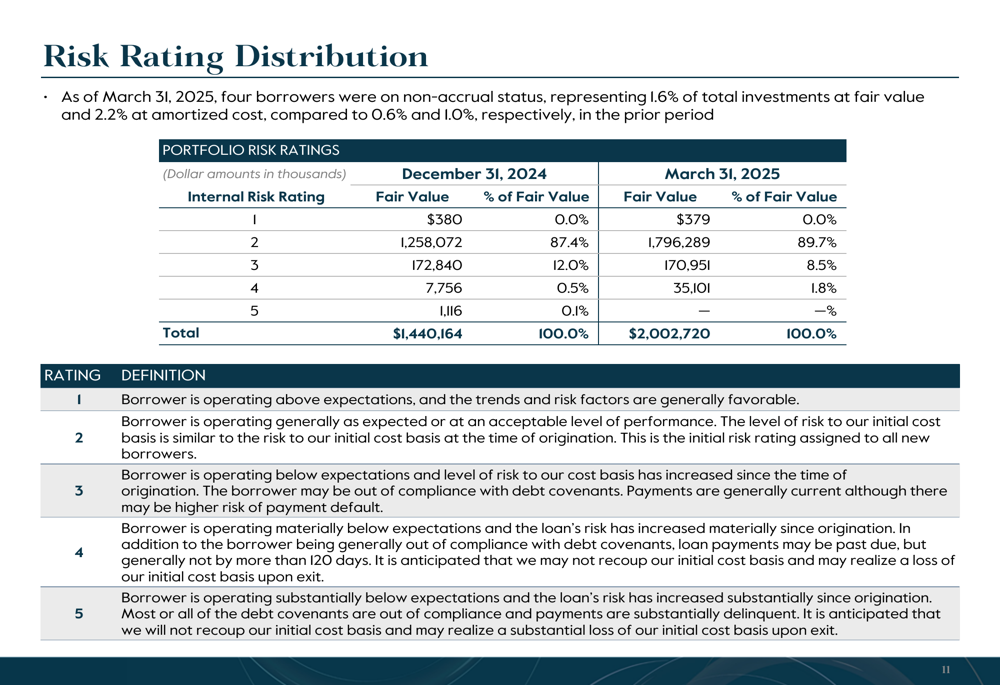
A concerning trend emerged in credit quality metrics, as non-accrual investments increased to 1.6% of the portfolio at fair value (2.2% at amortized cost), compared to 0.6% and 1.0%, respectively, in the previous quarter. This represents a significant deterioration from Q1 2024, when non-accruals stood at just 0.1% of the portfolio at fair value.
The risk rating distribution shows an increase in category 4 investments (those performing below expectations), which grew to 1.8% of the portfolio from 0.5% in the previous quarter:
Strategic Initiatives
The most significant development in Q1 2025 was the completion of the merger with CSL III on March 27, which resulted in the issuance of 18.9 million shares to CSL III shareholders and a $485.7 million increase in the fair value of CGBD’s portfolio. In connection with the merger, preferred stock was exchanged for 3.0 million common shares.
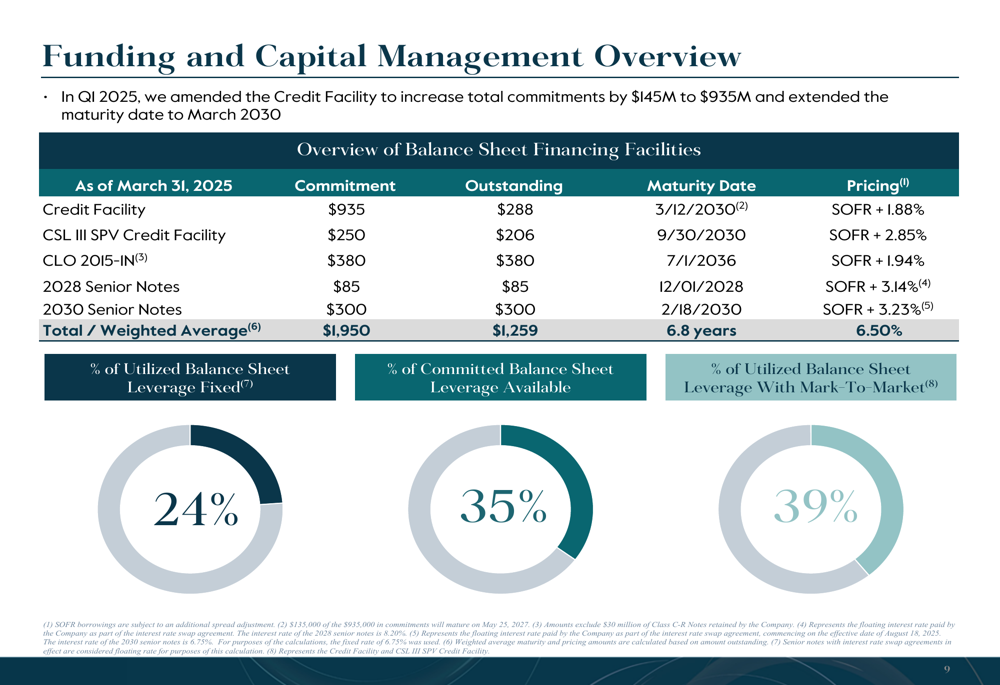
CGBD also strengthened its liquidity position by amending its Credit Facility, increasing total commitments to $935.0 million and extending the maturity to March 2030. The company entered into an equity distribution agreement to sell up to $150.0 million of shares through an at-the-market offering.
The following slide details the company’s funding and capital management approach:
NAV Performance and Dividend Policy
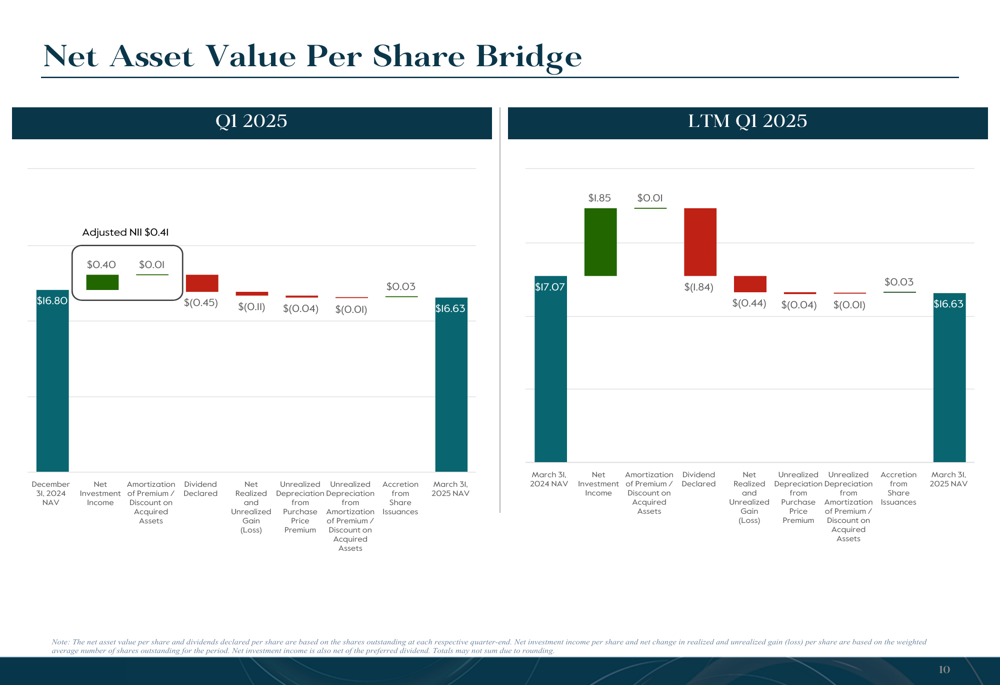
CGBD’s NAV per share decreased slightly to $16.63 as of March 31, 2025, from $16.80 at the end of 2024. The decline was primarily driven by net unrealized depreciation, partially offset by net investment income and accretion from purchase premium.
The following NAV bridge provides a detailed breakdown of the factors affecting NAV during the quarter:
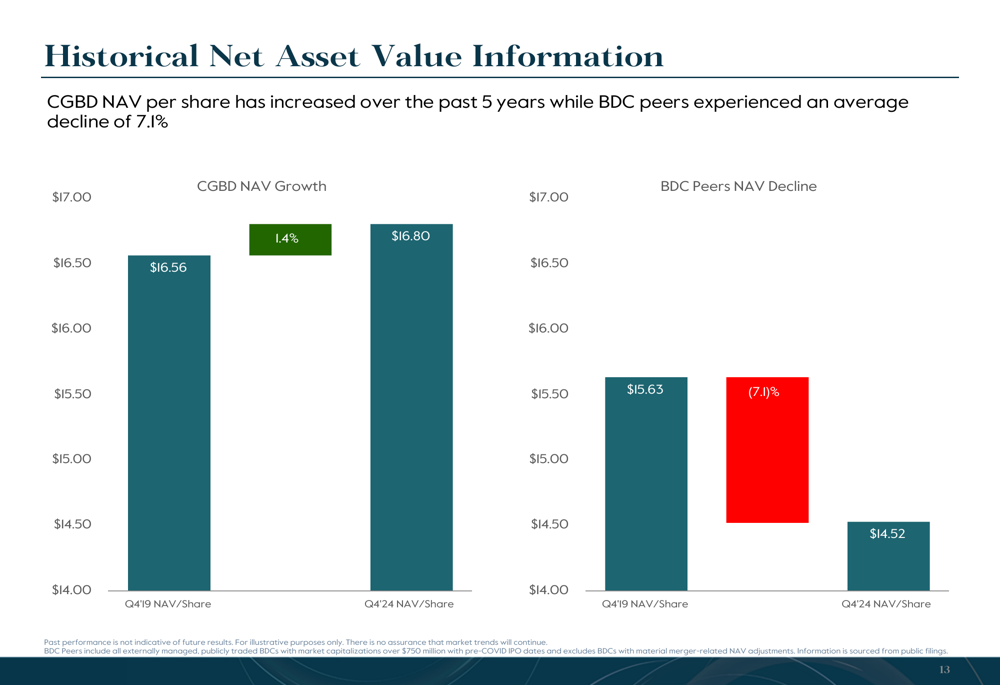
Despite the NAV decline, CGBD has outperformed its BDC peers over the past five years. While the company’s NAV per share has increased by 1.4% since Q4 2019, the average BDC peer has experienced a 7.1% decline over the same period.
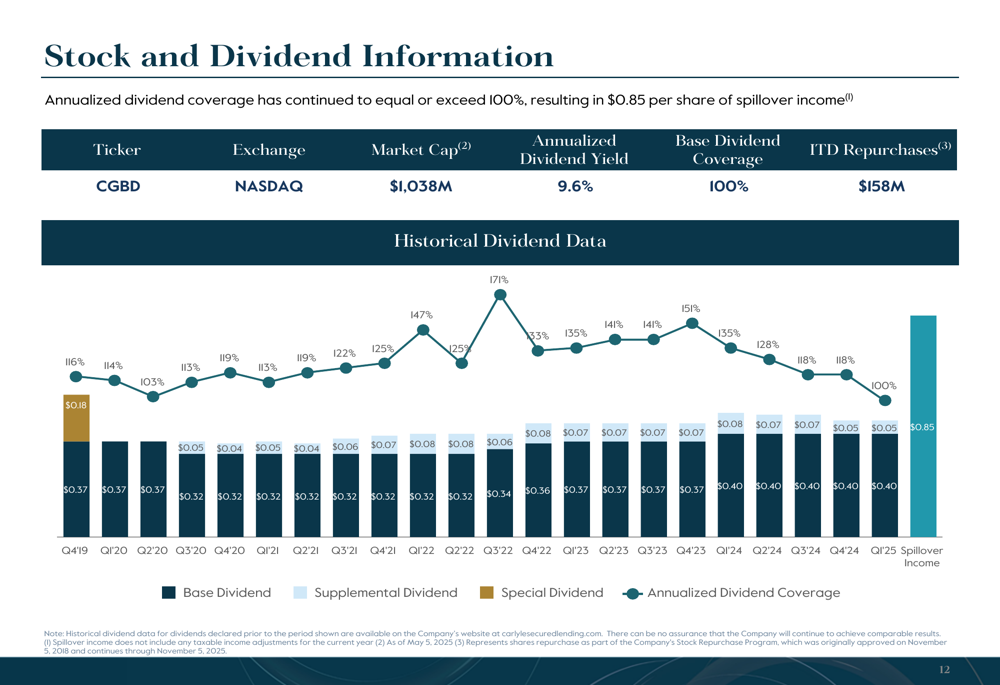
CGBD maintained its base dividend of $0.40 per share, resulting in an annualized dividend yield of 9.6% on NAV. The company has consistently maintained 100% coverage of its base dividend, resulting in $0.85 per share of spillover income.
The following chart illustrates CGBD’s dividend history and coverage:
Forward-Looking Statements
Looking ahead, CGBD expects to benefit from the increased scale and diversification resulting from the CSL III merger. The company’s focus remains on senior secured lending to larger, sponsor-backed companies, with a weighted average portfolio yield of 10.9%.
With $858.5 million in total liquidity and a conservative leverage profile, CGBD is well-positioned to navigate the current market environment. However, investors should monitor the increasing trend in non-accrual investments, which could impact future earnings if credit quality continues to deteriorate.
The stock’s current trading price of $14.24 represents a significant discount to NAV of approximately 14%, potentially offering value for investors comfortable with the company’s credit risk profile and strategic direction.
Full presentation:
This article was generated with the support of AI and reviewed by an editor. For more information see our T&C.