Gold prices hit 4-month high on Fed easing hopes, tariff uncertainty

Introduction & Market Context
Chemours Co (NYSE:CC) released its second quarter 2025 earnings presentation on August 6, revealing a mixed financial picture with strong operational performance offset by significant environmental settlement costs. The chemical solutions provider reported a 22% year-over-year increase in Adjusted EBITDA to $253 million, while posting a substantial net loss of $381 million primarily due to legacy environmental settlements.
The company’s stock has shown volatility in recent months, trading at $12.21 at the close on August 5, 2025, with a 3.44% gain on the day. In after-hours trading, shares added another 1.56%, suggesting a positive initial reaction to the earnings release. This represents a recovery from the company’s challenging first quarter, when shares dropped 9.09% following an earnings miss.
Quarterly Performance Highlights
Chemours generated $1.615 billion in net sales for Q2 2025, a 4% increase from $1.554 billion in the same period last year. The company’s adjusted EBITDA of $253 million marked a significant improvement from $207 million in Q2 2024, representing a 22% year-over-year increase.
As shown in the following comprehensive financial summary:
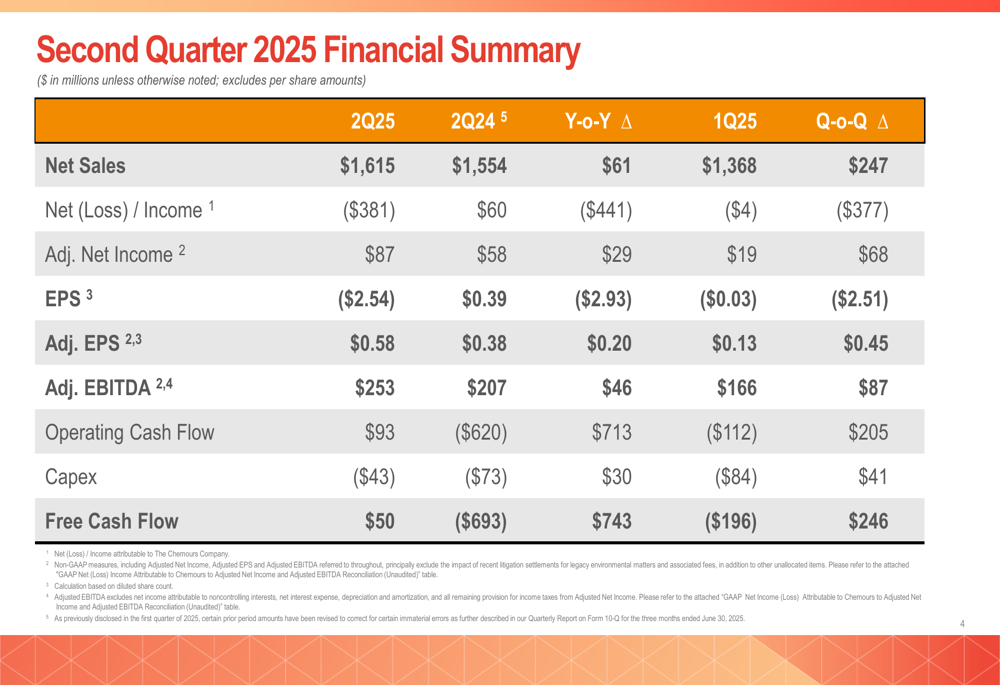
Despite the strong operational performance, Chemours reported a net loss of $381 million, a stark contrast to the $60 million net income in Q2 2024. This loss was primarily driven by environmental settlement costs. However, adjusted metrics painted a more positive picture, with adjusted net income of $87 million (up from $58 million) and adjusted EPS of $0.58 (up from $0.38).
The company’s free cash flow showed dramatic improvement, reaching $50 million compared to negative $693 million in the prior-year period. This turnaround was driven by $93 million in operating cash flow and reduced capital expenditures of $43 million.
The following bridge analysis illustrates the key factors driving the year-over-year improvement in adjusted EBITDA:
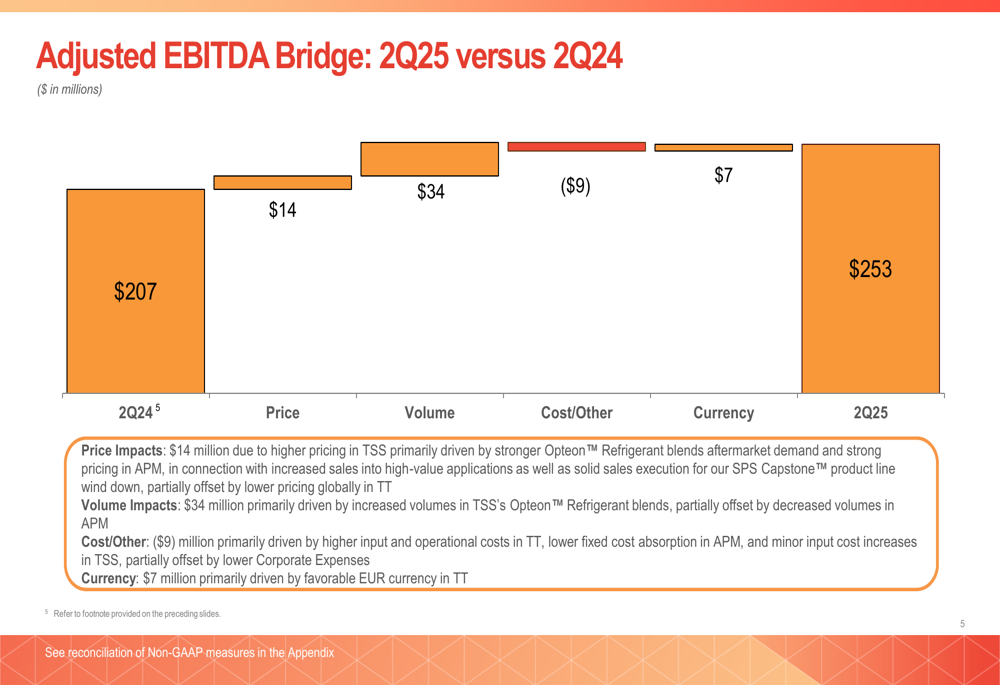
Price increases contributed $14 million to the EBITDA growth, while volume improvements added $34 million, primarily driven by increased sales of Opteon refrigerant blends. Currency effects provided a $7 million benefit, partially offset by $9 million in higher costs.
Segment Performance
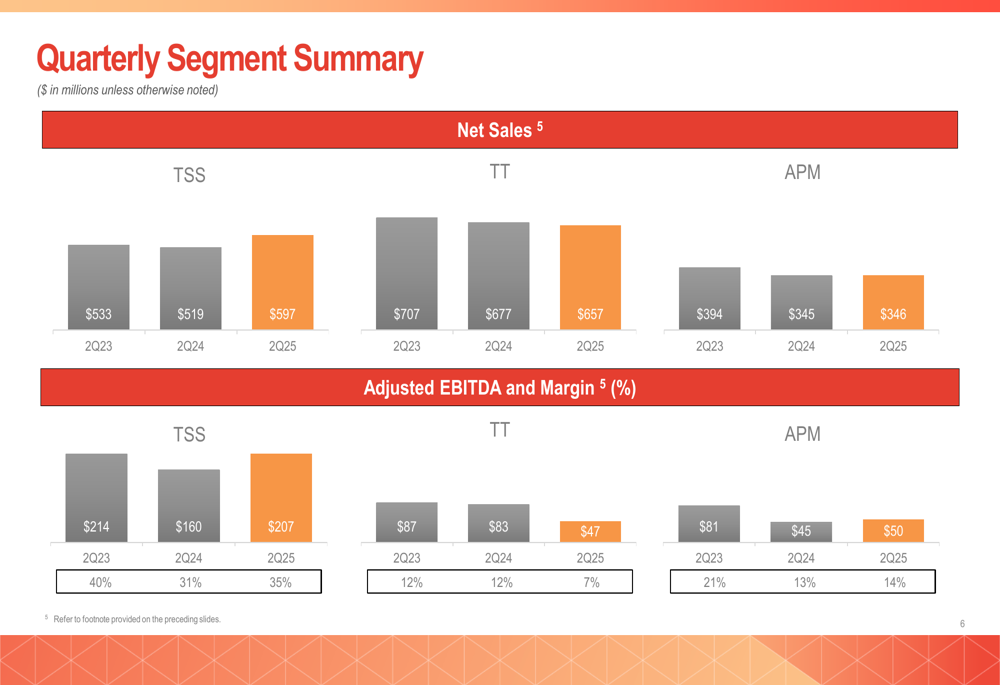
Chemours’ performance varied significantly across its three business segments. The Thermal & Specialized Solutions (TSS) segment was the standout performer, with net sales increasing to $597 million from $519 million in Q2 2024, driven by a remarkable 65% year-over-year growth in Opteon refrigerants. TSS adjusted EBITDA rose to $207 million from $160 million.
In contrast, the Titanium Technologies (TT) segment continued to face challenges, with net sales declining to $657 million from $677 million and adjusted EBITDA dropping to $47 million from $83 million. The Advanced Performance Materials (APM) segment showed modest improvement, with stable sales of $346 million and adjusted EBITDA increasing to $50 million from $45 million.
The following chart illustrates the segment performance trends:
Financial Position and Liquidity
As of June 30, 2025, Chemours maintained a total liquidity position of $1.5 billion, with gross debt of $4.2 billion and net debt of $3.7 billion. The company’s trailing twelve-month net leverage ratio stood at 4.7x, indicating a relatively high debt burden.
The cash flow statement shows an increase in cash balance from $514 million in Q1 2025 to $553 million at the end of Q2 2025, as illustrated in the following liquidity summary:
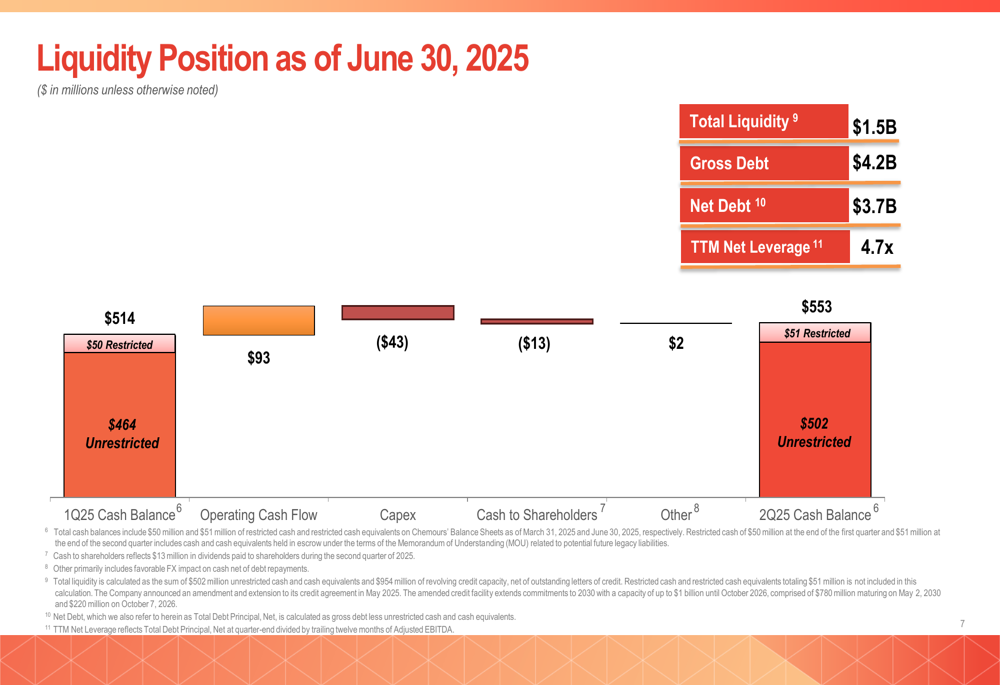
The company returned $13 million to shareholders through dividends in Q2 and has approved a Q3 dividend of $0.0875 per share. This represents a stabilization of the dividend policy after a 65% reduction reported in Q1 2025, which was implemented to enhance balance sheet flexibility.
Strategic Initiatives
Chemours continues to execute its "Pathway to Thrive" corporate strategy, which focuses on four key pillars: Operational Excellence, Enabling Growth, Portfolio Management, and Strengthening the Long Term. The strategy aims to deliver over $250 million in cost reductions and achieve sales growth exceeding 5% CAGR from 2024 to 2027.
The company’s strategic framework is outlined in the following illustration:
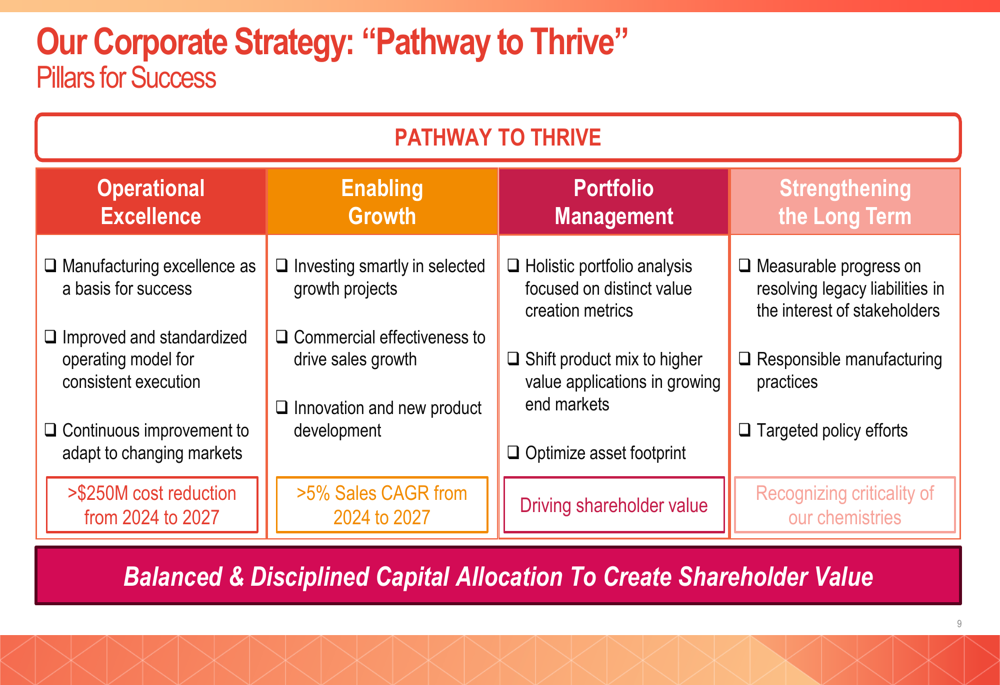
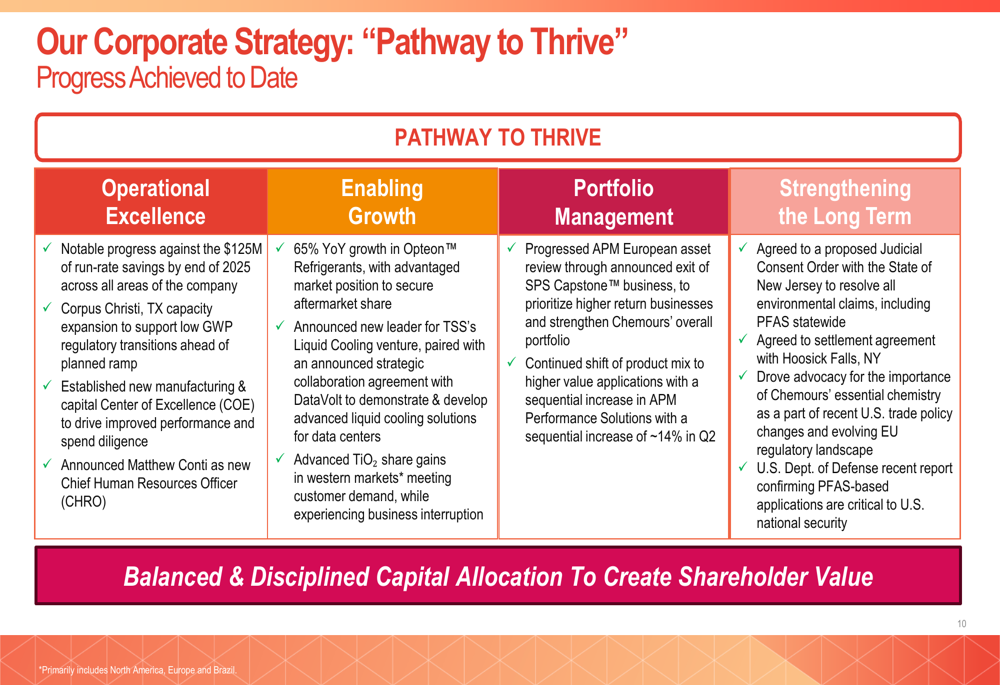
Progress against these strategic pillars includes notable advancement toward $125 million in run-rate savings by the end of 2025, 65% year-over-year growth in Opteon refrigerants, and continued portfolio optimization with the exit from SPS Capstone operations in Europe.
A significant strategic milestone was the settlement with the State of New Jersey to resolve environmental claims, including statewide PFAS claims. Chemours’ discounted share of the settlement payments amounts to approximately $250 million, with $150 million expected from insurance proceeds. The company notes that no out-of-pocket New Jersey settlement payments are expected through at least 2030.
The details of this important settlement are illustrated here:
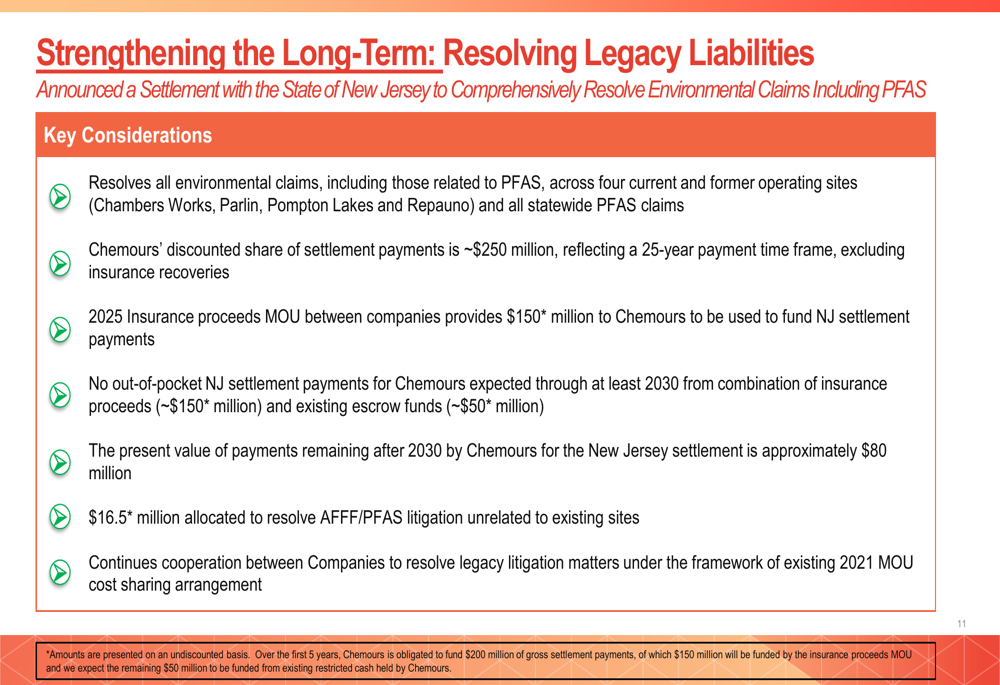
This agreement represents continued progress in resolving legacy environmental liabilities, following earlier settlements with Ohio, Delaware, and the U.S. Public Water System Class Action (WA:ACT).
Forward-Looking Statements
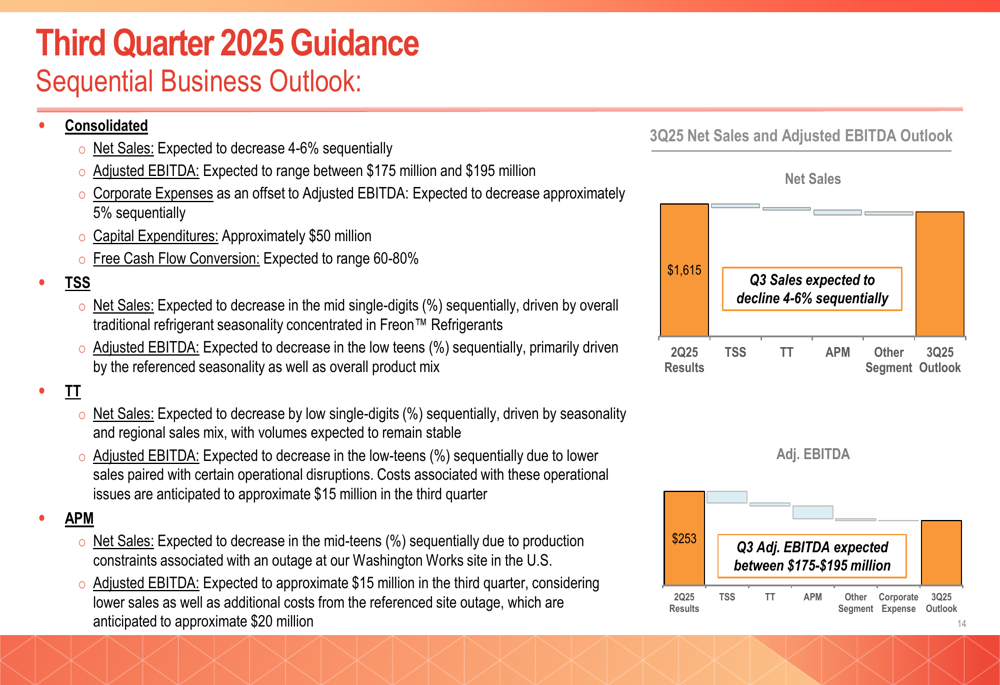
For the third quarter of 2025, Chemours expects net sales to decrease 4-6% sequentially, with adjusted EBITDA projected between $175 million and $195 million. The guidance reflects anticipated operational disruptions in the Titanium Technologies segment and a site outage in the Advanced Performance Materials segment, with combined impacts of approximately $35 million.
The detailed Q3 guidance by segment is presented here:
For the full year 2025, Chemours projects net sales of $5.9-6.0 billion and adjusted EBITDA of $775-825 million, with capital expenditures of approximately $250 million. This represents a downward revision from the $825-950 million adjusted EBITDA guidance provided in Q1 2025.
The company’s full-year outlook is summarized in the following chart:
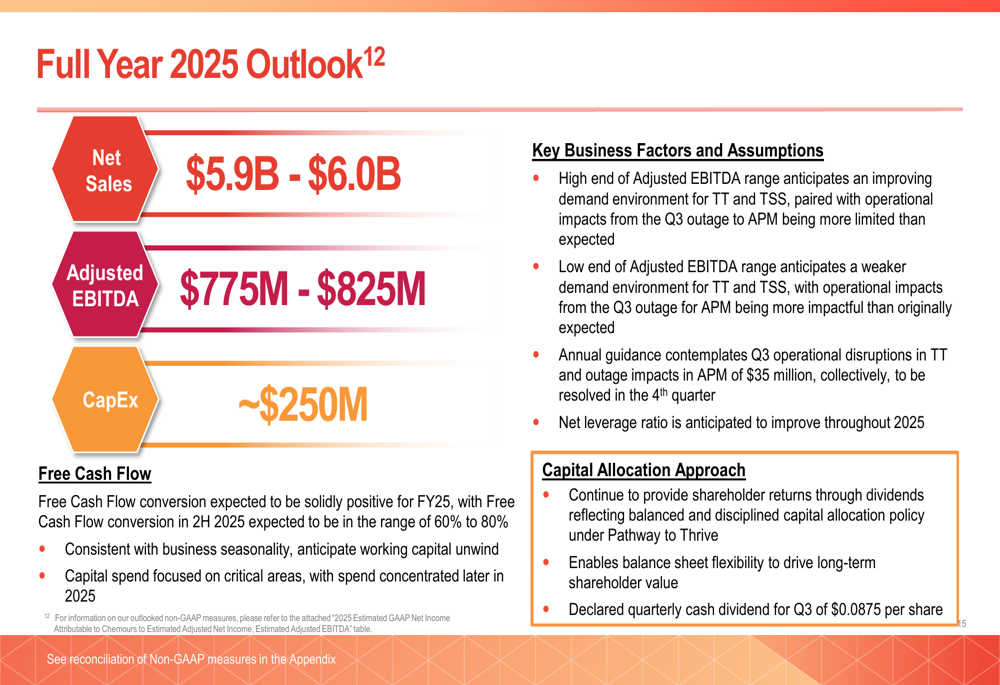
Free cash flow is expected to be "solidly positive" for the full year, with the net leverage ratio anticipated to improve throughout 2025. The high end of the adjusted EBITDA guidance assumes an improving demand environment, while the low end factors in a weaker demand scenario.
Conclusion
Chemours’ Q2 2025 results reflect a company navigating both operational improvements and legacy challenges. The strong performance in the TSS segment, particularly with Opteon refrigerants, demonstrates the company’s ability to capitalize on growth opportunities in next-generation products. Meanwhile, the significant progress in resolving environmental liabilities provides a clearer path forward, though at substantial short-term cost.
The sequential decline expected in Q3 and the reduced full-year guidance suggest continued challenges ahead. However, the improved free cash flow generation and strategic focus on cost reduction and portfolio optimization indicate that management is taking appropriate steps to strengthen the company’s position for long-term growth and profitability.
Investors will likely focus on Chemours’ ability to overcome the operational disruptions expected in Q3, maintain momentum in the high-growth Opteon business, and continue improving its balance sheet while managing its substantial debt load.
Full presentation:
This article was generated with the support of AI and reviewed by an editor. For more information see our T&C.