Gold prices rebound as risk-off mood grips markets; US payroll data awaited

Introduction & Market Context
Compass Inc (NYSE:COMP), a $4 billion market cap real estate technology company, delivered record financial results in the second quarter of 2025, according to its latest investor presentation. Despite operating in what CEO Robert Refkin described as a "trough level housing market," the company achieved significant growth across all key metrics, demonstrating resilience and continued market share gains.
The strong performance comes as Compass continues to expand its agent base and technology offerings while improving operational efficiency. The company’s stock has been trading between $5.10 and $10.25 over the past 52 weeks, with analysts maintaining a moderate buy consensus and price targets ranging from $7 to $11.
Quarterly Performance Highlights
Compass reported exceptional results for Q2 2025, with double-digit growth in revenue, transactions, and agent count. The company’s financial performance showed substantial improvement in profitability metrics compared to the same period last year.
As shown in the following slide detailing the company’s record results:

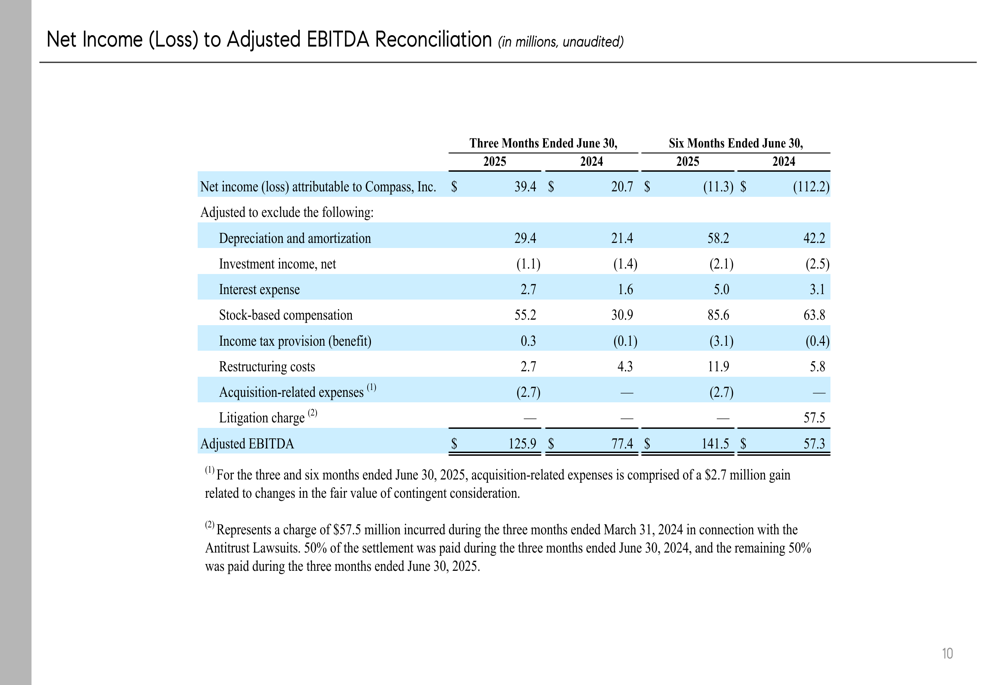
Revenue reached $2.06 billion, representing a 21% year-over-year increase. More impressively, GAAP net income surged 90% to $39.4 million compared to the same quarter last year. Adjusted EBITDA grew by $48.5 million to reach $125.9 million, while the adjusted EBITDA margin expanded by 150 basis points to 6.1%.
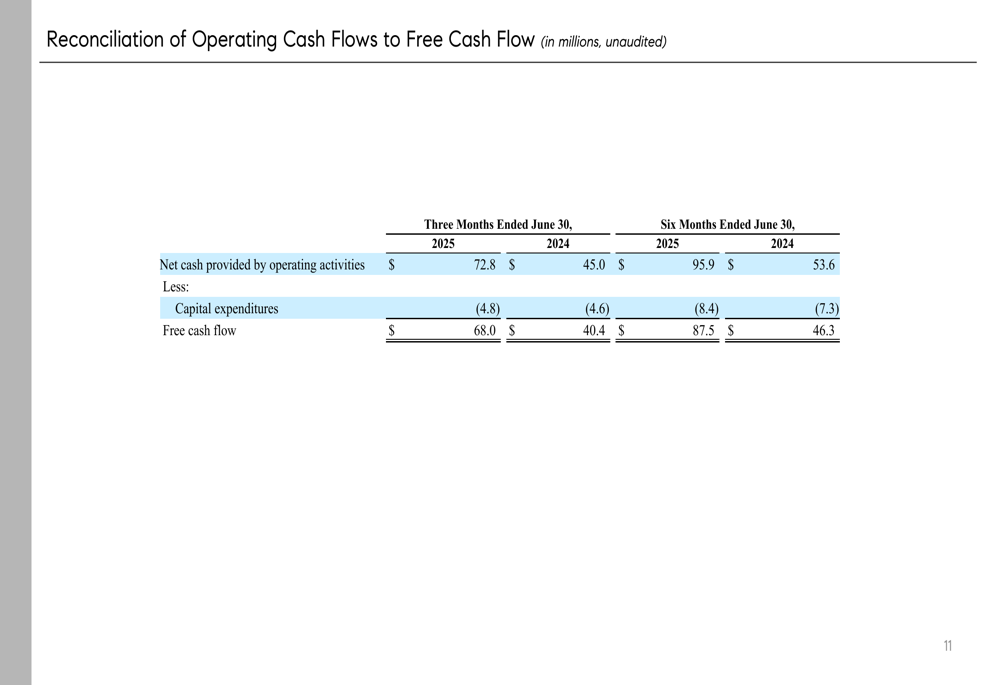
The company also reported strong cash generation, with free cash flow increasing by $27.6 million year-over-year to reach $68 million for the quarter, marking a new quarterly record.
Agent Growth and Market Share
A key driver of Compass’s revenue growth has been its ability to attract and retain real estate agents. The presentation highlighted significant expansion in the company’s agent network and transaction volume.
The following slide illustrates the company’s consistent growth trajectory across key operational metrics:
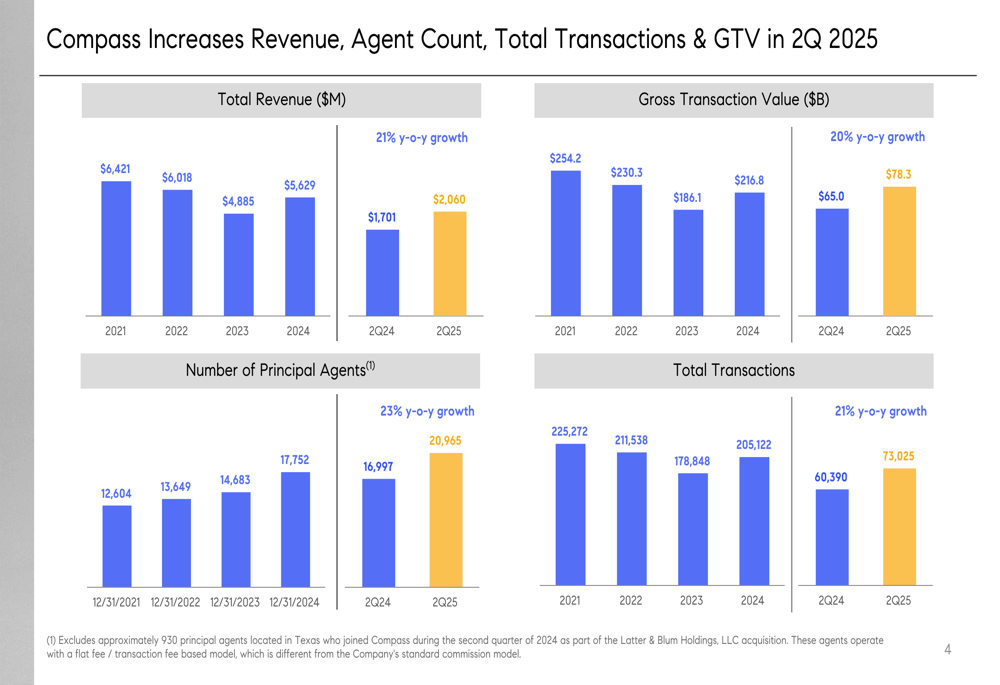
The number of principal agents increased 23% year-over-year to 20,965, with gross principal agent additions of 832 in the quarter, representing a 53% increase from Q2 2024. This agent growth has translated directly into transaction volume, with total transactions up 21% year-over-year to 73,025.
Perhaps most notably, Compass continued to gain market share, reaching 6.09% in Q2 2025, an increase of 96 basis points from the same period last year. This market share expansion is particularly significant given the challenging conditions in the broader housing market.
Financial Analysis
The presentation provided detailed financial reconciliations, offering investors transparency into how Compass calculates its non-GAAP metrics. The following slide shows the reconciliation from net income to adjusted EBITDA:
The company’s improved profitability is evident in its cash flow metrics as well. The reconciliation of operating cash flows to free cash flow demonstrates Compass’s ability to generate significant cash while continuing to invest in growth:
Key business metrics further underscore the company’s strong performance across both operational and financial dimensions:
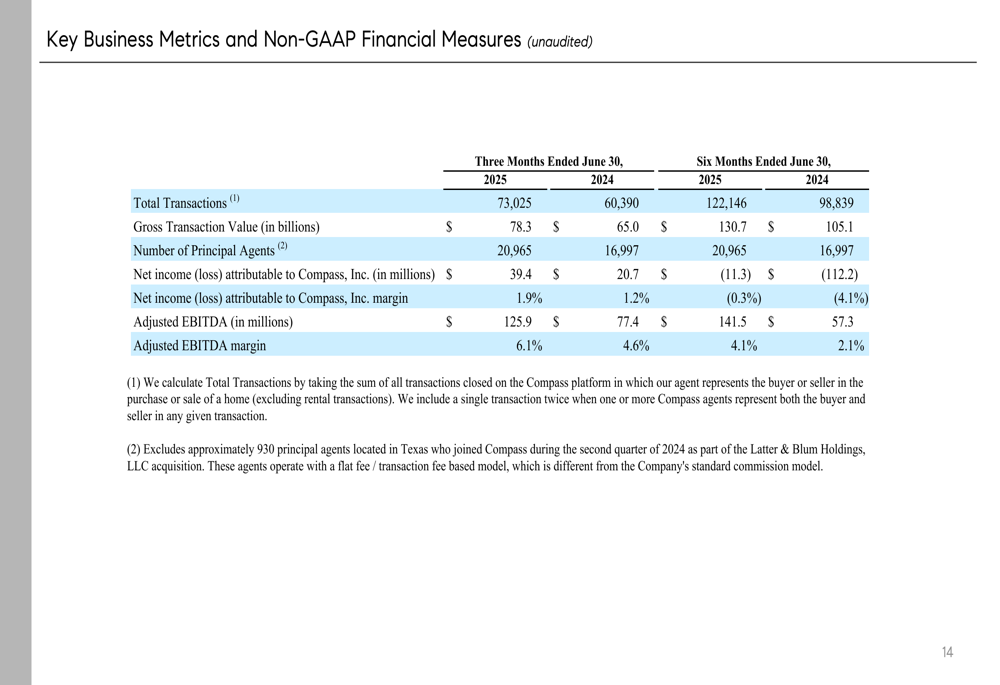
The presentation revealed that Compass achieved a gross transaction value of $78.3 billion in Q2 2025, representing a 20% increase year-over-year. The company’s net income margin improved to 1.9%, compared to -0.3% in the same period last year, while the adjusted EBITDA margin expanded to 6.1% from 4.1%.
Forward Guidance
Looking ahead, Compass provided guidance for both the third quarter and full year 2025, signaling continued confidence in its growth trajectory despite market uncertainties.
As detailed in the following slide:
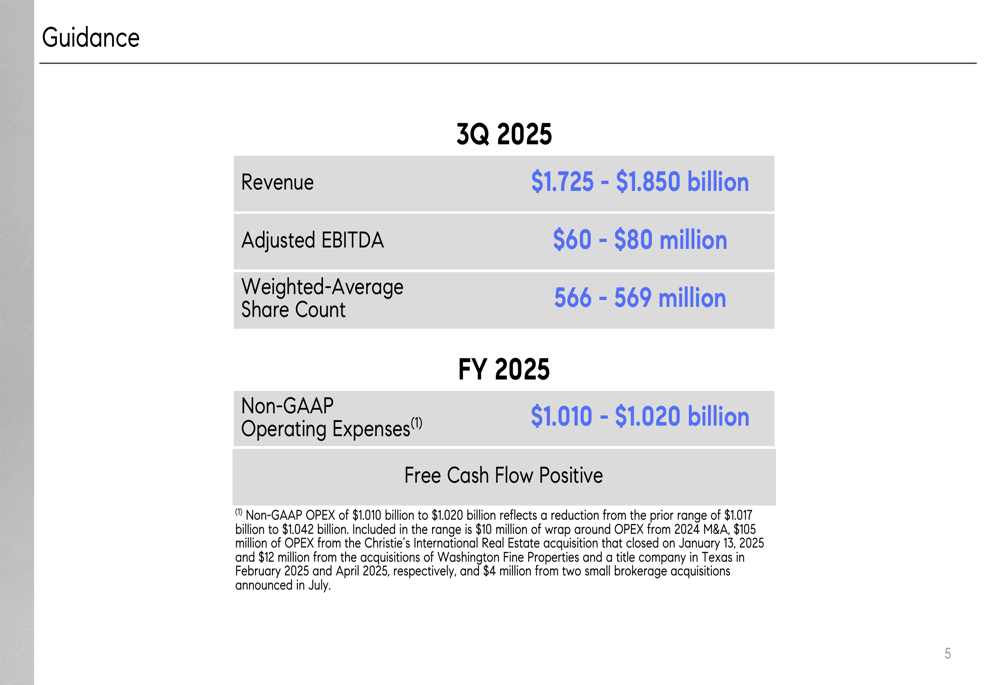
For Q3 2025, the company expects revenue between $1.725 billion and $1.850 billion, with adjusted EBITDA projected to range from $60 million to $80 million. The weighted-average share count is anticipated to be between 566 million and 569 million.
For the full year 2025, Compass projects non-GAAP operating expenses between $1.010 billion and $1.020 billion, with positive free cash flow expected for the year. A footnote mentioned adjustments to non-GAAP operating expenses due to recent acquisitions, suggesting the company continues to pursue strategic growth opportunities.
Conclusion
Compass’s Q2 2025 presentation paints a picture of a company executing effectively on its growth strategy despite challenging market conditions. The significant improvements in revenue, profitability, and market share demonstrate the company’s ability to outperform the broader real estate market.
With continued agent growth, expanding margins, and positive free cash flow, Compass appears well-positioned to maintain its momentum through the remainder of 2025. However, investors should remain mindful of the inherent volatility in the housing market and potential competitive pressures in the real estate technology sector.
The stock’s recent trading at $6.92, with a slight dip in premarket trading despite the strong results, suggests that investors may be taking a cautious approach, potentially due to broader market concerns rather than company-specific issues. Nonetheless, the fundamental performance indicators presented in the Q2 slides provide a solid foundation for Compass’s continued growth.
Full presentation:
This article was generated with the support of AI and reviewed by an editor. For more information see our T&C.