ReElement Technologies stock soars after securing $1.4B government deal

Introduction & Market Context
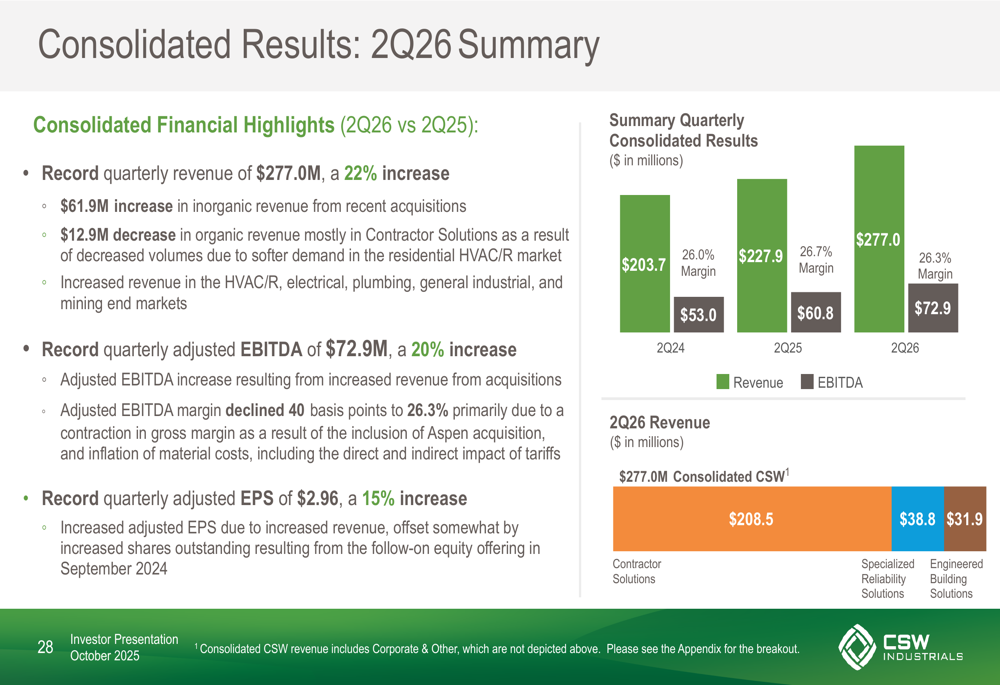
CSW Industrials Inc (NASDAQ:CSWI) reported strong financial results for its fiscal second quarter of 2026, with revenue increasing 22% year-over-year to $277 million. The company’s presentation, released on October 30, 2025, revealed that growth was primarily driven by acquisitions, which contributed $61.9 million in inorganic revenue, while organic revenue declined by $12.9 million.
The diversified industrial company, which focuses on providing niche, value-added products across various end markets, saw its adjusted EBITDA rise 20% to $72.9 million, though adjusted EBITDA margin declined slightly by 40 basis points to 26.3%. Adjusted earnings per share increased 15% to $2.96.
As shown in the following consolidated results summary, CSW Industrials maintained its growth trajectory despite challenging market conditions:
Quarterly Performance Highlights
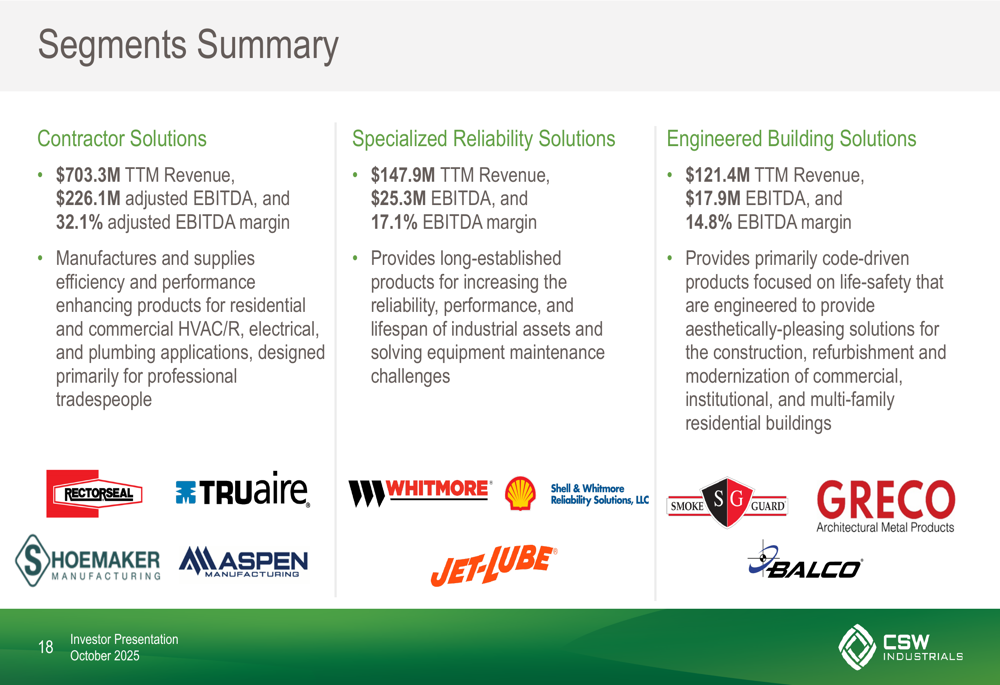
The Contractor Solutions segment, which now represents 74% of consolidated revenue (up from 69% in Q2 2025), was the primary driver of growth. This segment saw revenue increase 31% to $208.5 million, though this was entirely due to inorganic growth of $61.9 million, as organic revenue decreased by $12.3 million. Segment adjusted EBITDA increased 26% to $67.6 million, with margin decreasing 140 basis points to 32.4%.
The Specialized Reliability Solutions segment, representing 14% of total revenue, reported a modest 0.7% revenue increase to $38.8 million, while EBITDA decreased 10% with margin declining 190 basis points.
The Engineered Building Solutions segment, accounting for 12% of revenue, saw a 2% decrease in revenue to $31.9 million, with EBITDA decreasing 20% and margin declining 370 basis points.
The following segment summary provides a comprehensive breakdown of CSW Industrials’ three business segments and their respective performance metrics:
Strategic Evolution
CSW Industrials has undergone a significant transformation since its spin-off in 2015. The company has evolved from a diversified portfolio with relatively balanced revenue distribution across segments to a business heavily focused on Contractor Solutions, which now accounts for 72% of trailing twelve months revenue.
As illustrated in the following chart, this strategic shift has yielded impressive results, with sales growing from $262 million in FY15 to $965 million in the trailing twelve months ending Q2 2026. During the same period, adjusted EBITDA increased from $56 million to $243 million, while adjusted EPS rose from $2.12 to $10.21:
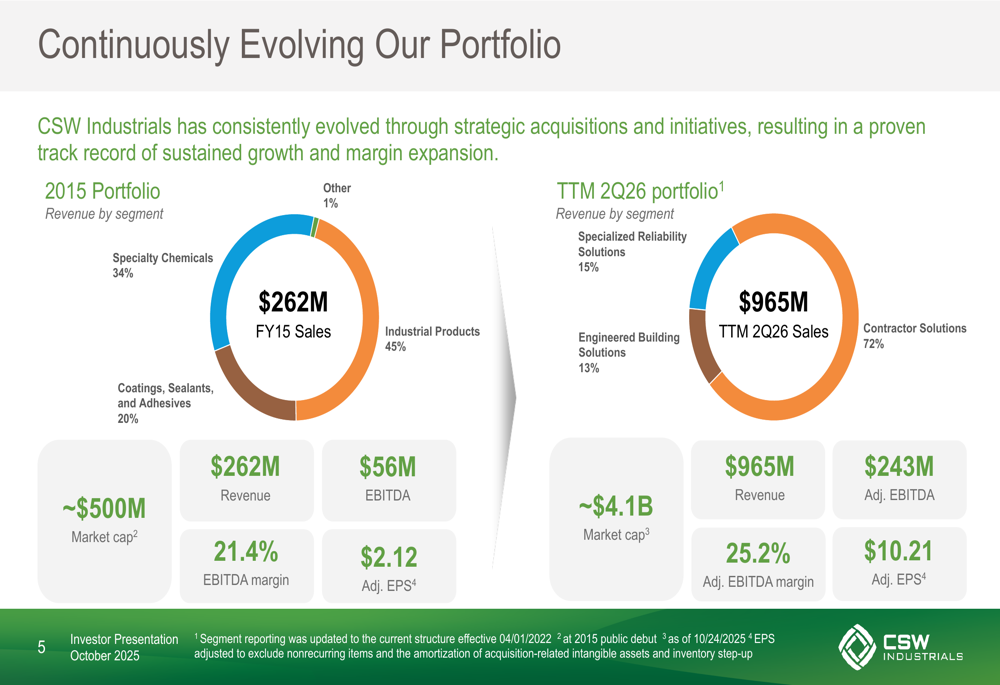
This transformation has been achieved through strategic acquisitions and organic growth initiatives. The company has completed 17 acquisitions since October 2015, deploying approximately $1 billion in capital at a weighted average purchase price multiple of 9.6x.
Investment Thesis and Growth Strategy
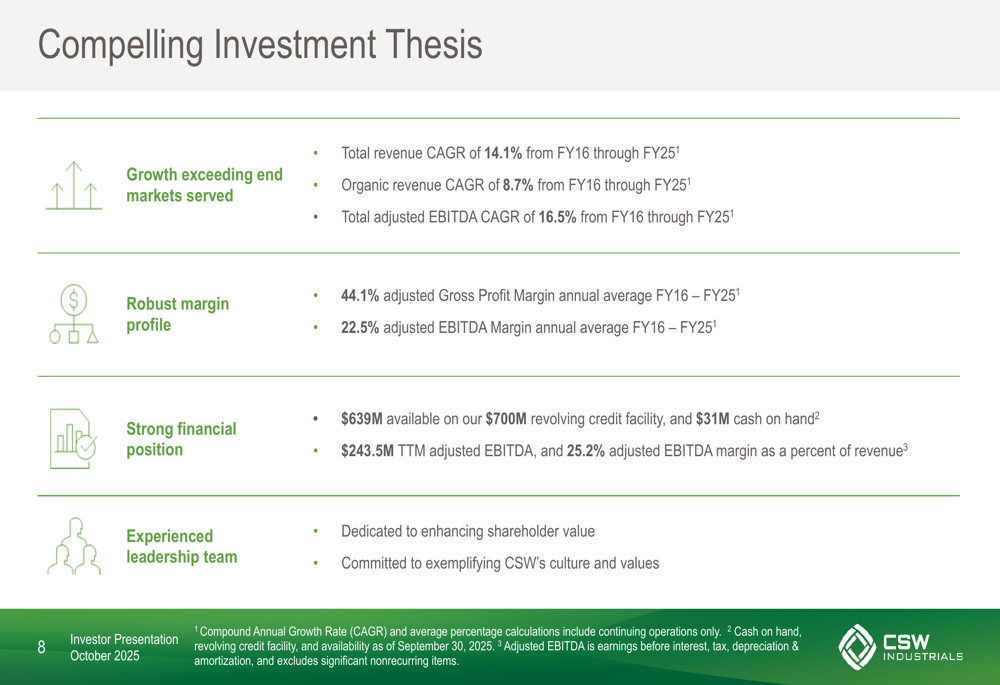
CSW Industrials’ investment thesis centers around growth exceeding end markets, robust margin profile, strong financial position, and experienced leadership. The company has delivered impressive financial results, with total revenue CAGR of 14.1% and organic revenue CAGR of 8.7% from FY16 through FY25.
The following slide highlights the key components of CSW Industrials’ investment thesis:
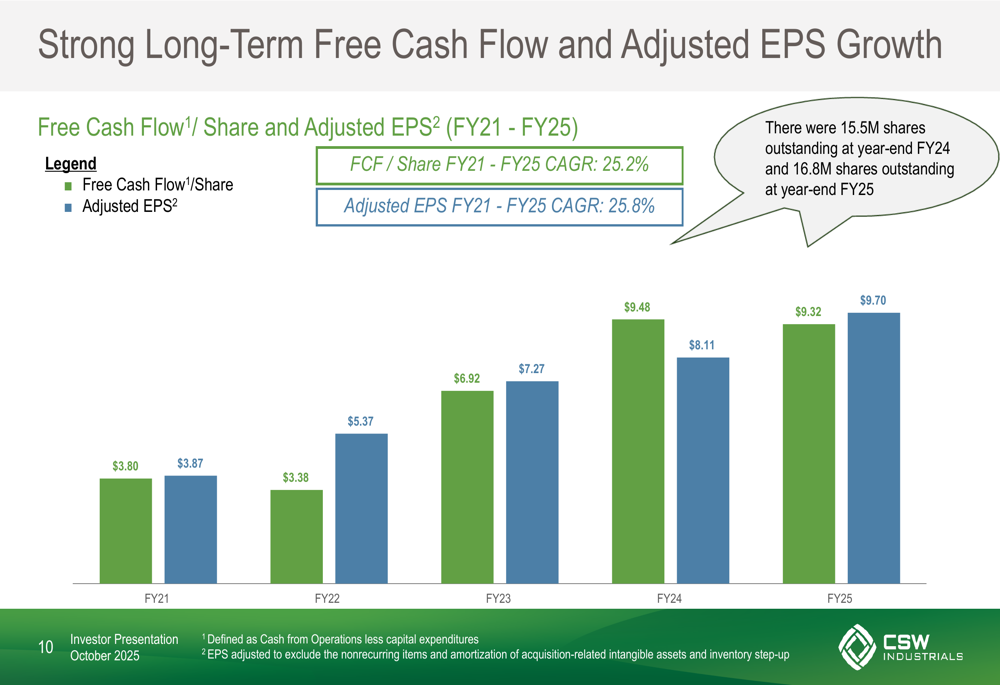
The company’s strong free cash flow generation has supported its growth strategy and shareholder returns. From FY21 to FY25, CSW Industrials achieved a free cash flow per share CAGR of 25.2% and an adjusted EPS CAGR of 25.8%, as shown in the following chart:
CSW Industrials’ capital allocation strategy prioritizes maintaining a strong balance sheet, supporting organic and inorganic growth, and returning excess cash to shareholders. In the trailing twelve months, the company allocated $437 million of capital, with $377.9 million directed toward acquisitions, $32.4 million to share repurchases, $13.7 million to capital expenditures, and $13.1 million to dividends.
Market Challenges and Outlook
Despite the strong headline numbers, CSW Industrials faces challenges in organic growth. The decline in organic revenue across all segments suggests underlying market weakness, particularly in the HVAC/R sector, which is a key end market for the company’s Contractor Solutions segment.
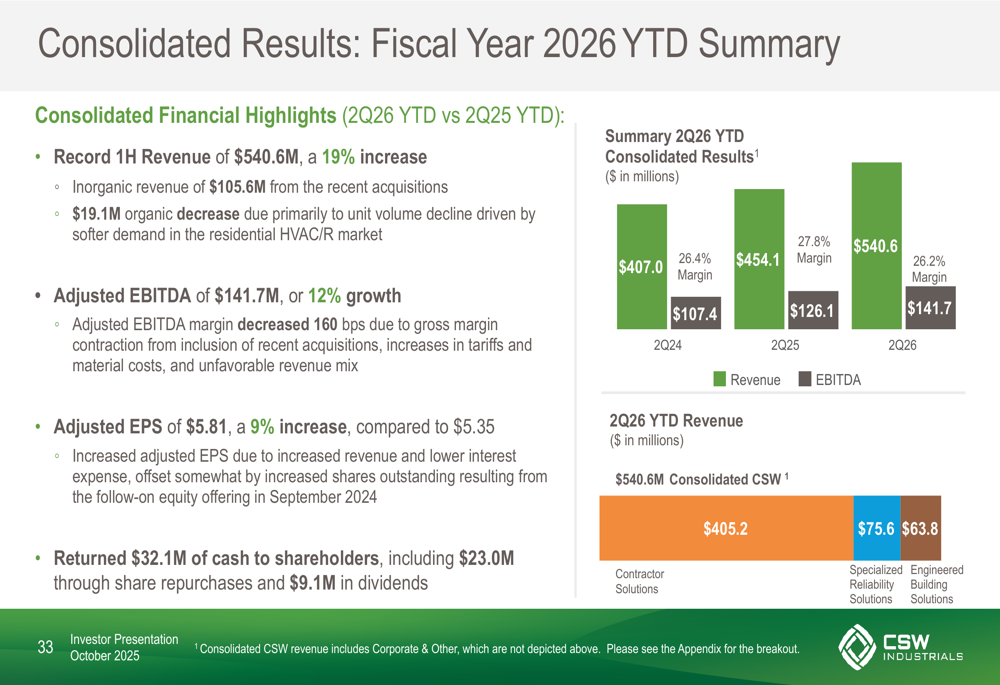
The year-to-date results further illustrate these challenges. While total revenue for the first half of fiscal 2026 increased 19% to $540.6 million, this was driven by $105.6 million in inorganic growth, offset by a $19.1 million decrease in organic revenue. Adjusted EBITDA increased 12% to $141.7 million, but adjusted EBITDA margin decreased 160 basis points.
The following chart summarizes the company’s year-to-date performance:
Despite these challenges, CSW Industrials maintains a strong financial position with $639 million available on its revolving credit facility and $31 million in cash on hand. The company’s market capitalization has grown to approximately $4.1 billion, up from around $500 million at the time of its spin-off in 2015.
Looking ahead, CSW Industrials remains focused on its guiding objectives of treating team members well, serving customers effectively, managing supply chains efficiently, and positioning the company for sustainable growth and profitability. While market headwinds persist, the company’s diversified product portfolio, strong balance sheet, and disciplined acquisition strategy provide a solid foundation for long-term growth.
Full presentation:
This article was generated with the support of AI and reviewed by an editor. For more information see our T&C.