Raytheon awarded $71 million in Navy contracts for missile systems

Introduction & Market Context
Dollar Tree Inc . (NASDAQ:DLTR) presented its first quarter fiscal 2025 financial results on June 4, 2025, revealing accelerated comparable store sales growth amid its strategic transformation following the Family Dollar divestiture. The stock, which had gained 6.01% to close at $96.72 on June 3, was trading down 3.83% in pre-market activity at $93.02, suggesting investors had mixed reactions to the results.
The discount retailer reported adjusted diluted earnings per share from continuing operations of $1.26, slightly above the $1.23 reported in the same quarter last year, as strong sales growth was partially offset by margin compression.
Quarterly Performance Highlights
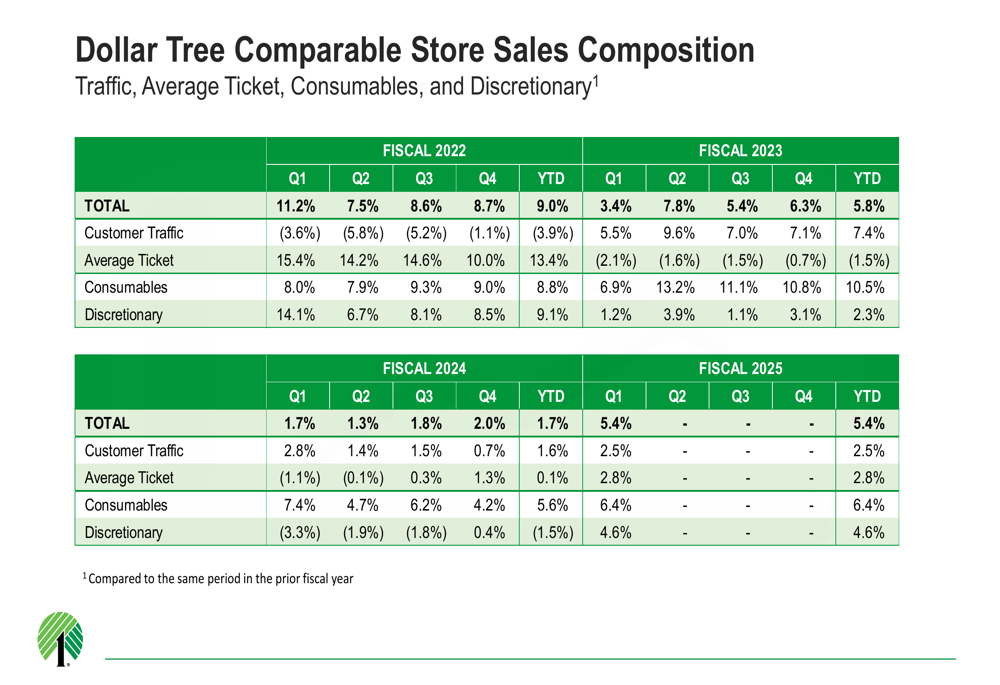
Dollar Tree’s comparable store sales increased 5.4% in Q1 2025, showing significant acceleration from the 1.7% growth reported in Q1 2024. This growth was driven by both increased traffic (up 2.5%) and higher average ticket (up 2.8%), indicating strengthening consumer engagement with the brand.
As shown in the following chart of comparable store sales composition, Dollar Tree has demonstrated consistent improvement in traffic and ticket metrics over recent quarters:
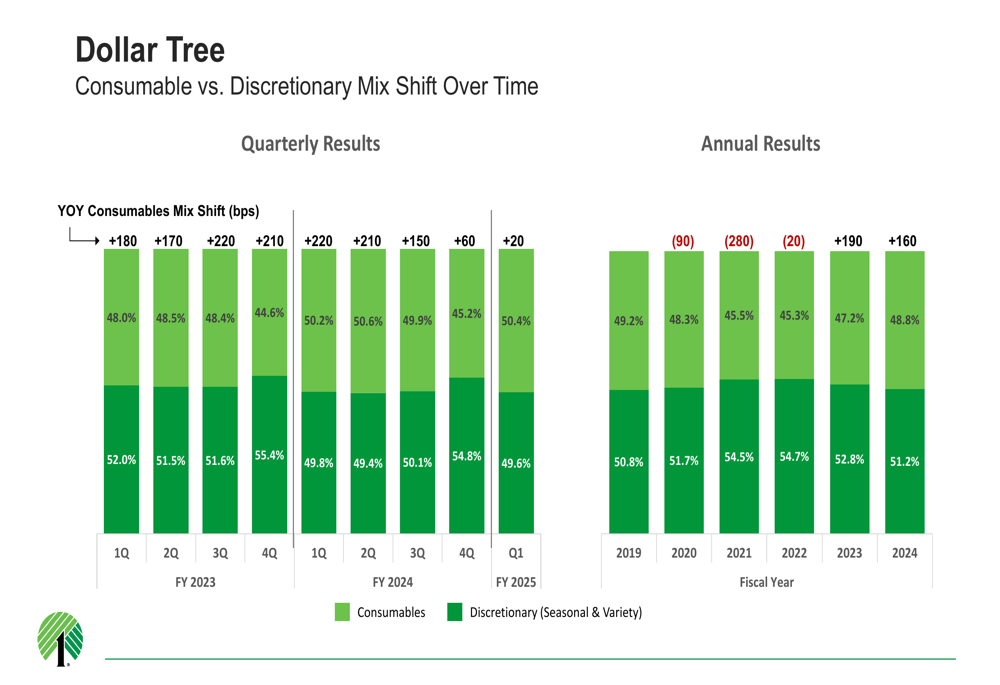
The company’s product mix continued to shift toward consumables, which now represent 50.4% of sales (a 20 basis point increase year-over-year). Consumables comparable sales grew 6.4%, while discretionary comparable sales showed renewed strength with 4.6% growth.
The following chart illustrates this ongoing mix shift toward consumables:
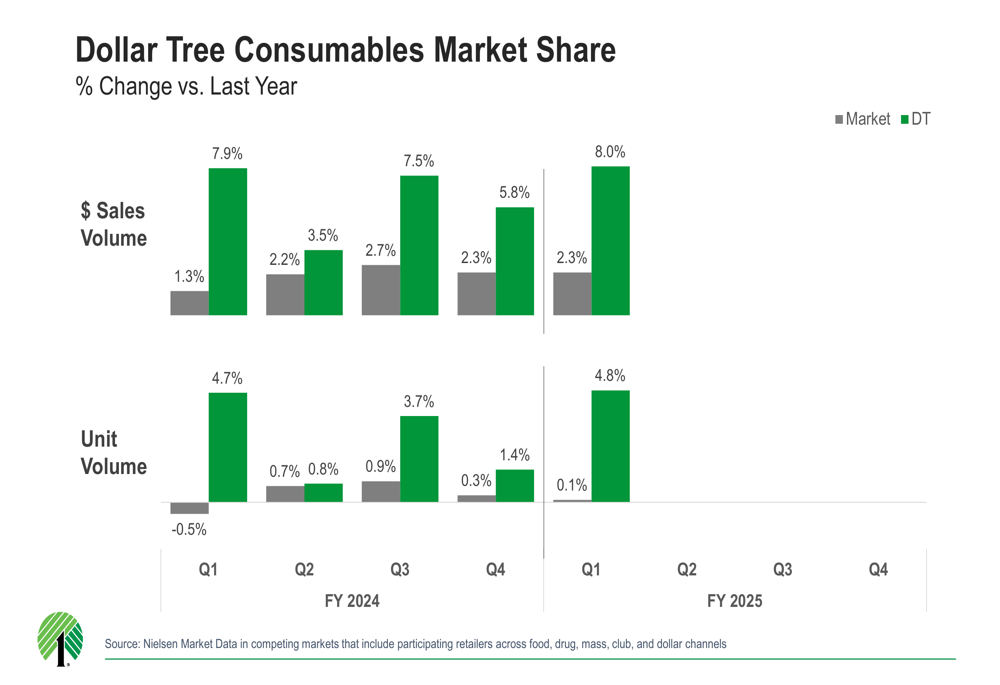
Notably, Dollar Tree is outperforming the broader market in consumables, gaining market share in both dollar sales volume and unit volume. In Q1 2025, Dollar Tree’s dollar sales volume increased 8.0% compared to the market’s 2.3% growth, while unit volume grew 4.8% versus the market’s 0.1%.
Strategic Initiatives
A key element of Dollar Tree’s strategy is the rollout of its Multi-Price 3.0 Format stores, which reached 3,500 locations by the end of Q1, including 3,000 conversions completed since last year and 500 new stores. These 3.0 format stores are outperforming other formats with a 150 basis point lift in comparable sales, driven by a 120 basis point increase in average ticket and a 20 basis point improvement in traffic.
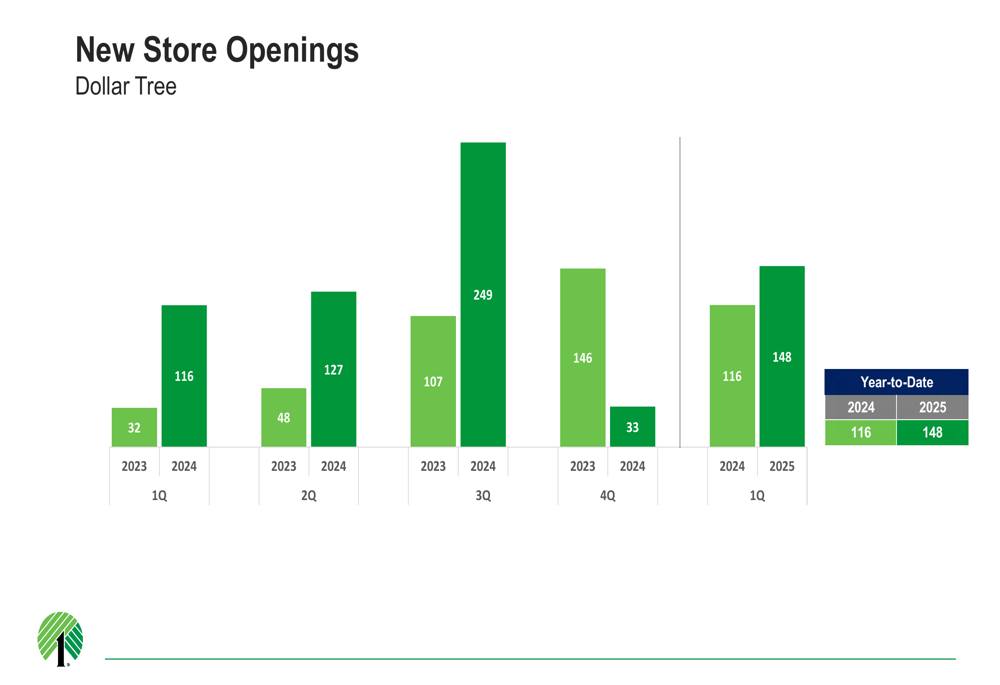
The company celebrated the opening of its 9,000th store during the quarter, located in Plano, Texas. Dollar Tree opened a total of 148 new stores in Q1 2025, a significant increase from the 116 stores opened in Q1 2024, demonstrating the company’s accelerated expansion following its strategic focus on the Dollar Tree brand.
The following chart shows the company’s accelerating pace of new store openings:
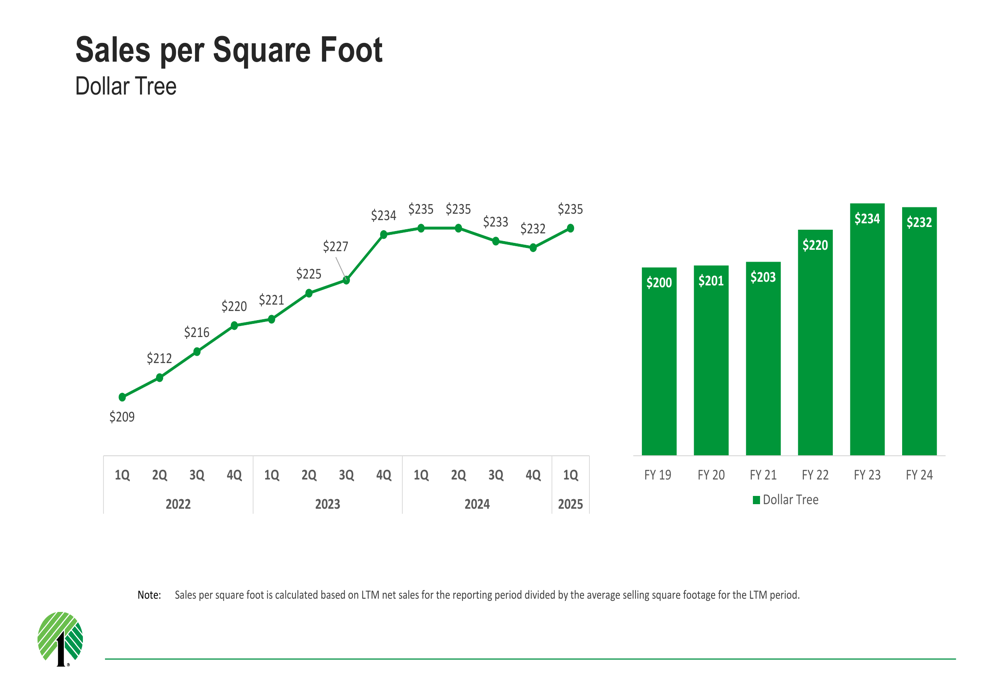
Store productivity continues to improve, with sales per square foot reaching $235 in Q1 2025, compared to $234 in Q1 2024 and $209 in Q1 2022, reflecting the success of the company’s merchandising and format strategies.
Detailed Financial Analysis
Despite the strong sales performance, Dollar Tree faced margin pressure during the quarter. The Dollar Tree segment’s gross margin expanded by 20 basis points, but adjusted operating margin contracted by 110 basis points to 11.4%, compared to 12.5% in Q1 2024.
The following chart details the factors affecting operating margin performance:
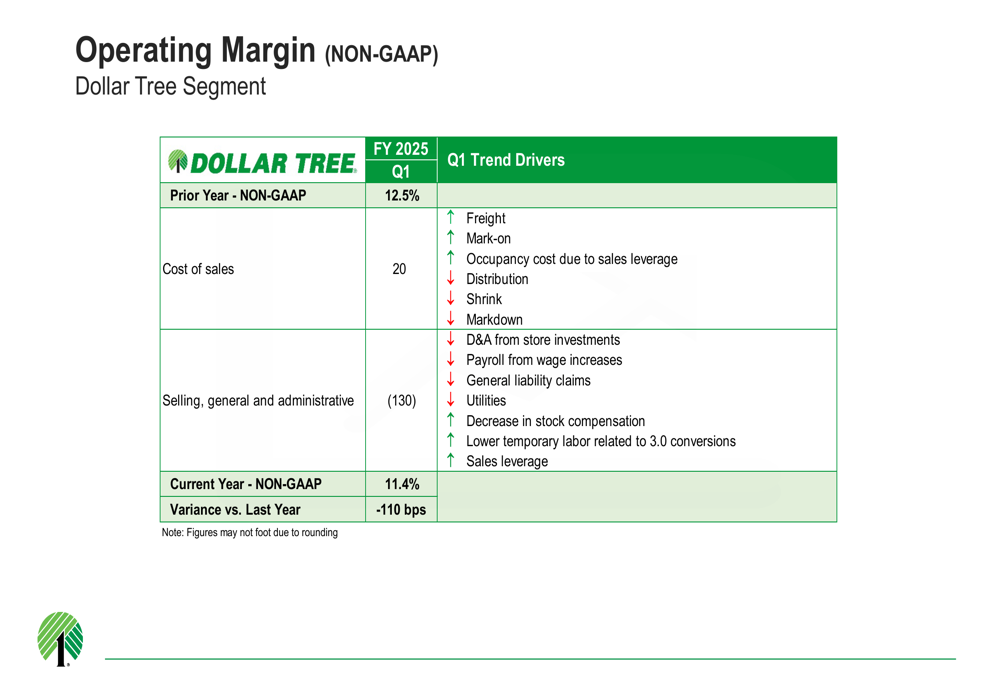
The margin contraction was primarily driven by selling, general, and administrative expenses, which deleveraged by 130 basis points on a non-GAAP basis. This was partially offset by the 20 basis point improvement in gross margin, which benefited from favorable freight costs and improved mark-on (initial markup).
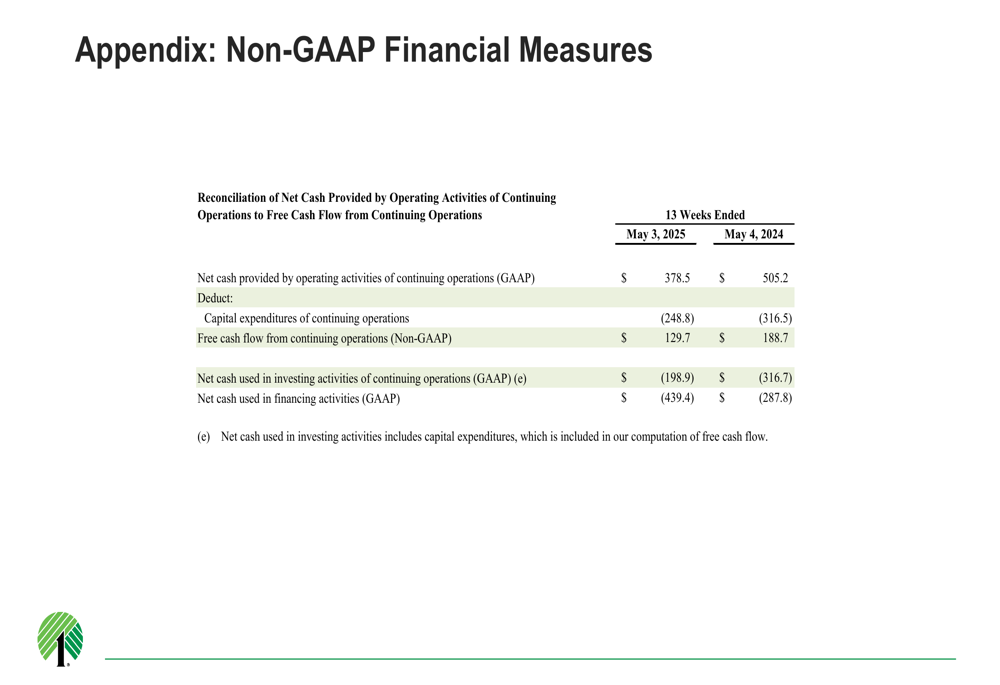
Dollar Tree generated $130 million in free cash flow from continuing operations during Q1, down from $189 million in the prior-year period. The company ended the quarter with $1.0 billion in cash and cash equivalents.
The company actively returned capital to shareholders, repurchasing 5.9 million shares for approximately $430 million during the quarter, with an additional 780,000 shares repurchased for approximately $68 million subsequent to quarter-end. Dollar Tree also paid off $1.0 billion of maturing senior notes using cash on hand and commercial paper borrowings.
Forward-Looking Statements
Dollar Tree provided an updated outlook for fiscal 2025, projecting sales between $18.5 billion and $19.1 billion, with comparable store sales growth of 3% to 5%. The company expects gross margin to improve by 50 to 75 basis points, while the Dollar Tree segment’s adjusted SG&A rate is anticipated to deleverage by 100 to 110 basis points.
The following chart details the company’s full fiscal 2025 outlook:
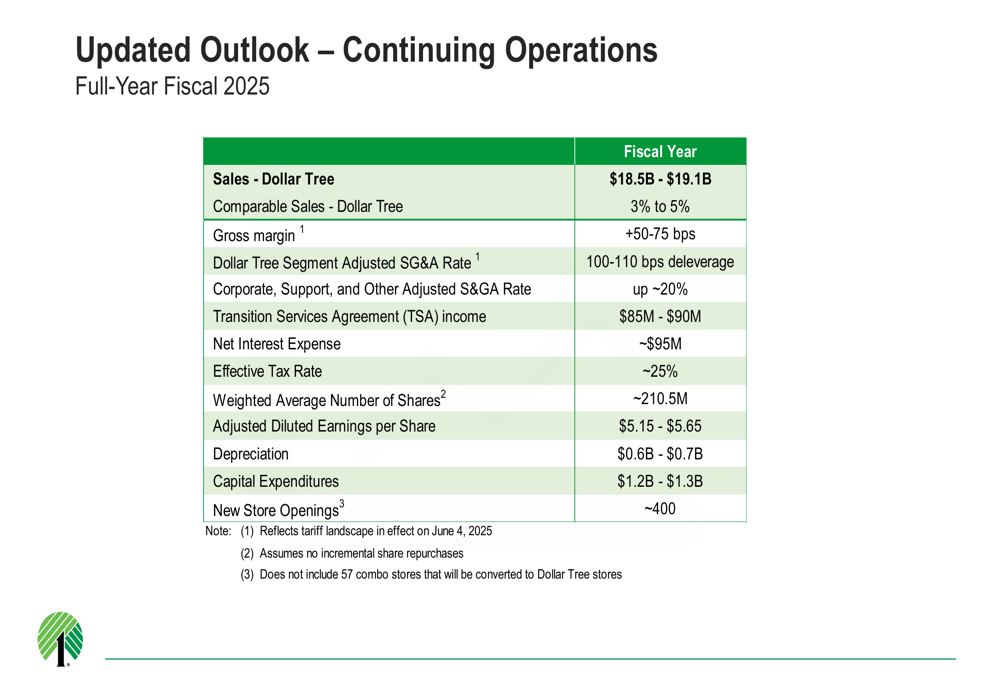
Management expects adjusted diluted earnings per share to range from $5.15 to $5.65 for the full year. The company plans to open approximately 400 new stores in fiscal 2025 and anticipates capital expenditures between $1.2 billion and $1.3 billion.
Dollar Tree also expects to receive approximately $800 million in net proceeds from the Family Dollar sale, along with a $350 million tax benefit, further strengthening its financial position to support its growth initiatives focused exclusively on the Dollar Tree brand.
Full presentation:
This article was generated with the support of AI and reviewed by an editor. For more information see our T&C.