Two 59%+ winners, four above 25% in Aug – How this AI model keeps picking winners

Introduction & Market Context
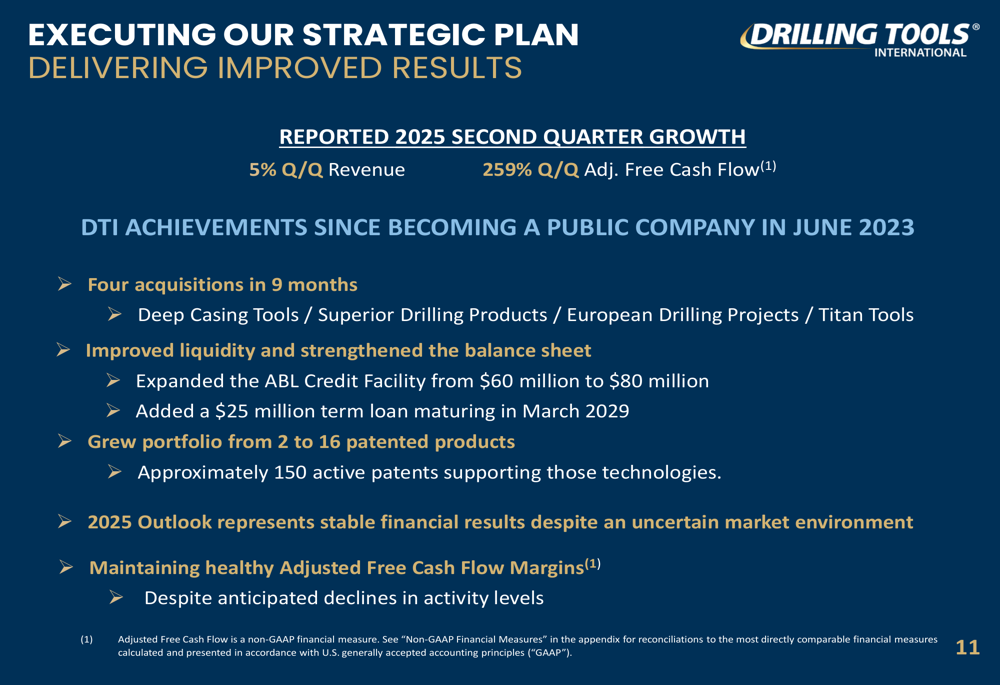
Drilling Tools International Corp (NASDAQ:DTI) presented its Fall 2025 Investor Presentation highlighting the company’s strategic initiatives, financial performance, and growth outlook amid challenging market conditions. Despite a 7% global rig count decline, DTI reported 5% quarter-over-quarter revenue growth in Q2 2025, with adjusted free cash flow surging 259% compared to the previous quarter.
The presentation comes after DTI’s Q1 2025 earnings report, which showed a 16% year-over-year revenue increase to $42.9 million. However, the stock has faced pressure, closing at $1.92 on August 13, 2025, down 4% in the most recent session.
Strategic Growth Initiatives
CEO Wayne Prejean emphasized that DTI is "built for outperformance" through strategic consolidation of the oilfield service rental tool industry and innovative technologies to meet evolving customer needs.
A cornerstone of DTI’s growth strategy has been its aggressive acquisition approach, completing four acquisitions in just nine months: Deep Casing Tools, Superior Drilling Products, European Drilling Projects, and Titan Tools. These acquisitions have expanded DTI’s patent portfolio from 2 to 16 patented products with approximately 150 active patents.
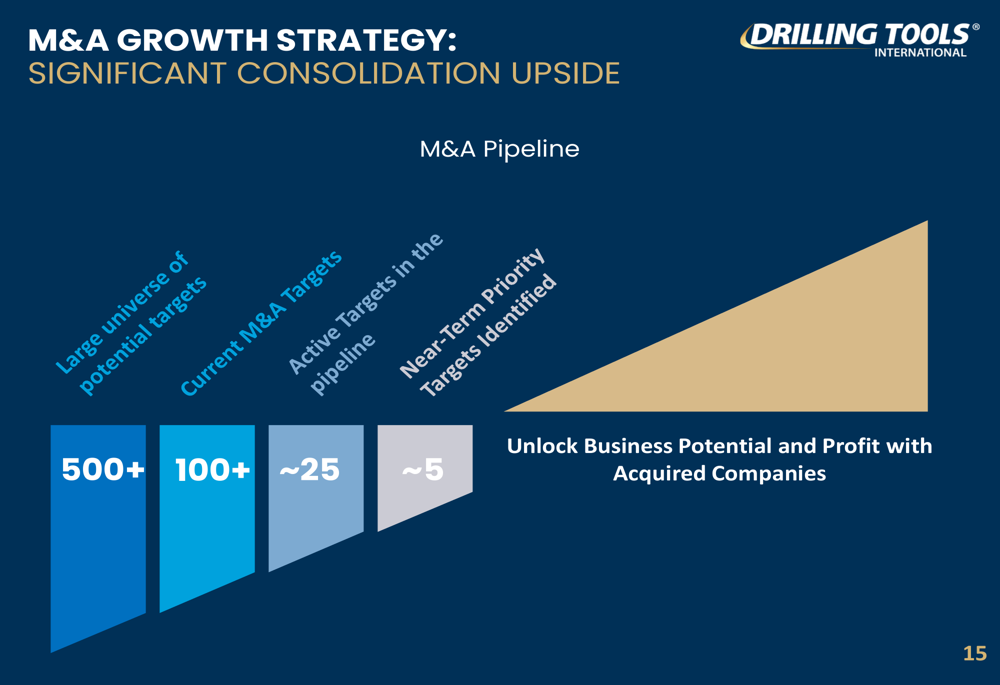
The company’s M&A pipeline remains robust, with management identifying over 500 potential targets, approximately 25 active targets in the pipeline, and 5 near-term priority targets. This strategy aims to consolidate a fragmented industry while expanding DTI’s international footprint and product sophistication.
International Expansion
A key focus of DTI’s growth strategy is expanding its Eastern Hemisphere operations. The presentation highlighted that Eastern Hemisphere revenue contribution has grown dramatically from approximately 1% in 2023 to 8% in 2024, and is projected to reach around 16% in 2025.
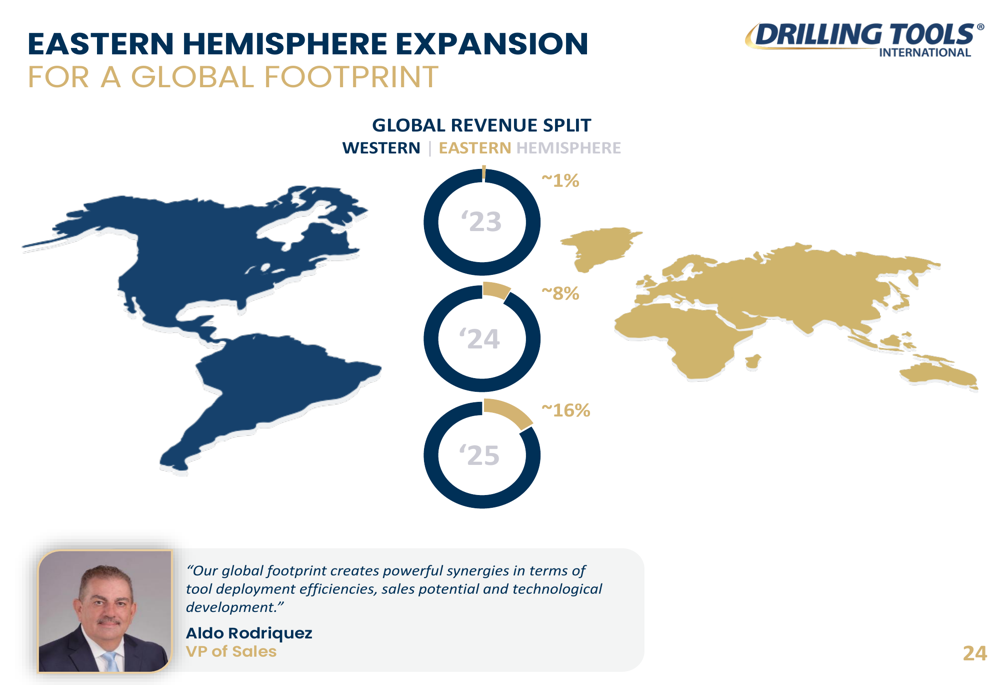
The company now maintains 11 service and support centers in the Eastern Hemisphere, complementing its 15 facilities in the Western Hemisphere. This expanded global footprint has yielded impressive results, with Eastern Hemisphere tool rental revenue increasing 838% quarter-over-quarter in Q2 2025.
Financial Performance
DTI’s Q2 2025 financial results demonstrated resilience despite industry headwinds. The company reported $39.4 million in revenue for the quarter, with 86% coming from the Western Hemisphere and 14% from the Eastern Hemisphere. The standout metric was adjusted free cash flow, which grew 259% quarter-over-quarter.
The company has also strengthened its balance sheet by expanding its ABL Credit Facility from $60 million to $80 million and adding a $25 million term loan maturing in March 2029. This improved liquidity supports DTI’s acquisition strategy and operational needs.
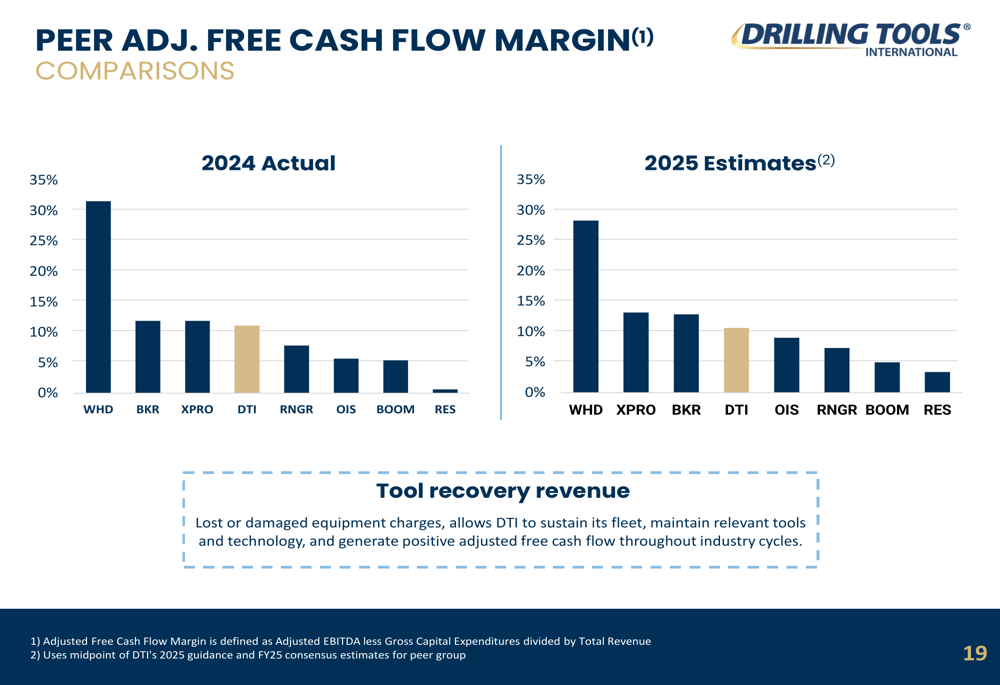
The presentation highlighted DTI’s strong adjusted free cash flow margin compared to peers. For 2025, DTI projects a 13% adjusted FCF margin, placing it fourth among its peer group and ahead of companies like OIS, RNGR, BOOM, and RES.
Blue Chip Customer Base
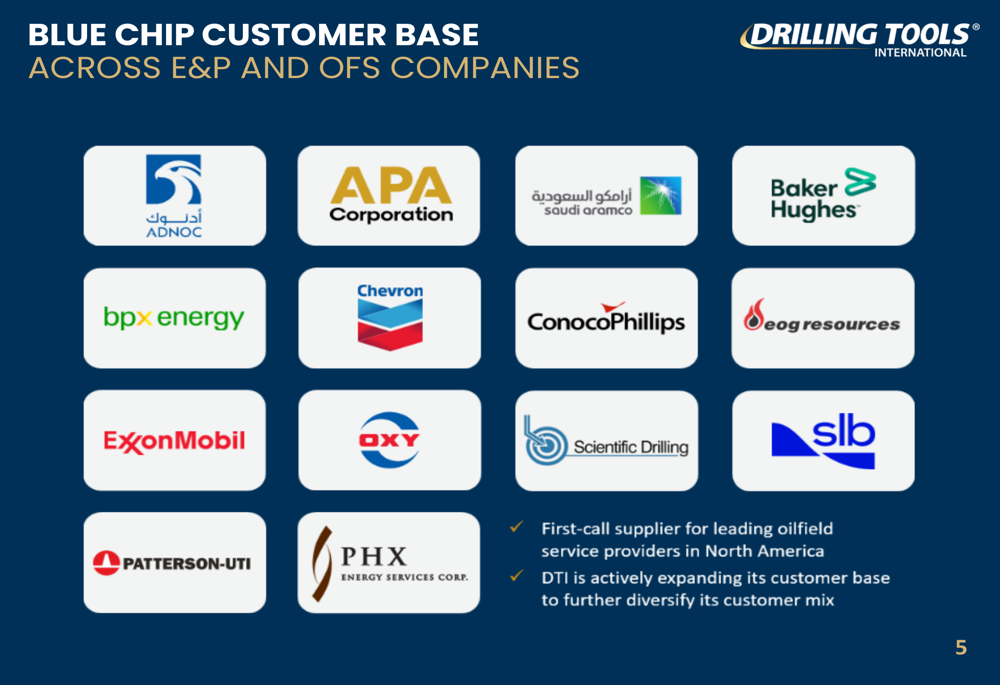
A significant competitive advantage for DTI is its impressive customer base, which includes major energy companies and oilfield service providers. The presentation showcased logos of industry giants such as ADNOC, Saudi Aramco, Baker Hughes, Chevron, ConocoPhillips, ExxonMobil, and Schlumberger, among others.
As shown in the following customer breakdown, DTI’s revenue is nearly evenly split between E&P operators (49%) and oilfield service companies (48%), with the remaining 3% coming from other sources:
Acquisition Synergies
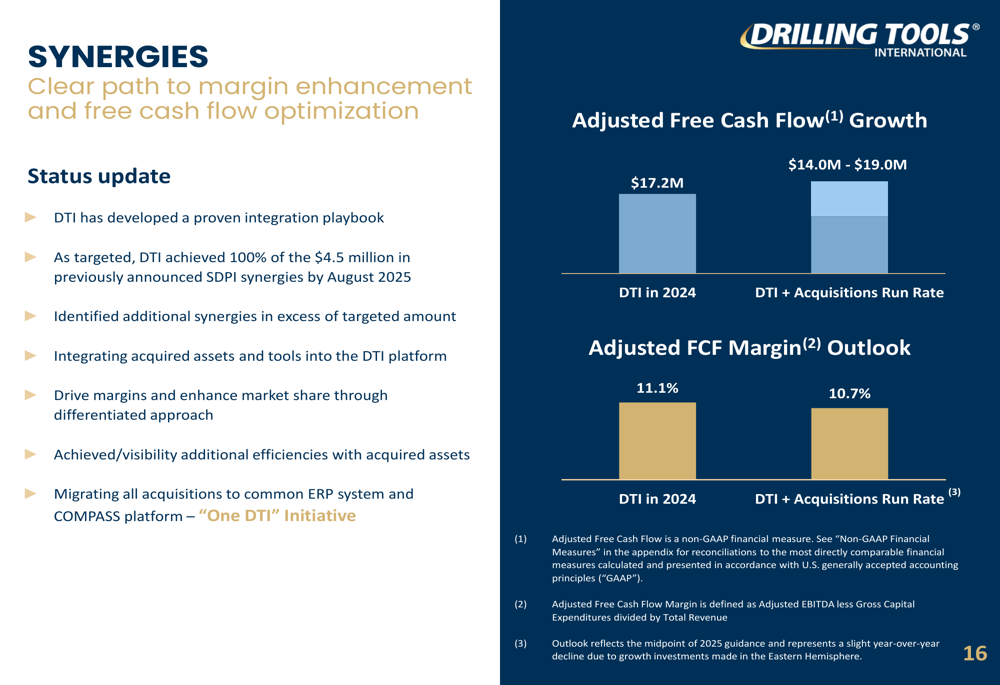
The presentation emphasized DTI’s success in integrating acquisitions and realizing synergies. Management reported achieving 100% of the targeted $4.5 million in synergies from the Superior Drilling Products acquisition by August 2025, with additional synergies identified beyond the initial target.
The company’s integration efforts have contributed to adjusted free cash flow growth, as illustrated in the following chart showing the progression from $17.2 million in 2024 to a projected range of $14.0-$19.0 million in the combined DTI and acquisitions run rate:
Capital Allocation Strategy
DTI outlined a disciplined capital allocation strategy focused on three priorities: maintenance and organic growth investments, strategic acquisitions, and return of capital to shareholders. For 2025, the company expects maintenance CapEx to be approximately 10% of revenue and growth CapEx to be approximately 4% of revenue.
The company has authorized a $10 million share repurchase program, with approximately $600,000 of common stock repurchased during Q2 2025. This program allows DTI to "opportunistically capitalize on dislocations between share price and perceived value," according to CFO David Johnson.
Forward Outlook
For the full year 2025, DTI provided the following financial guidance:
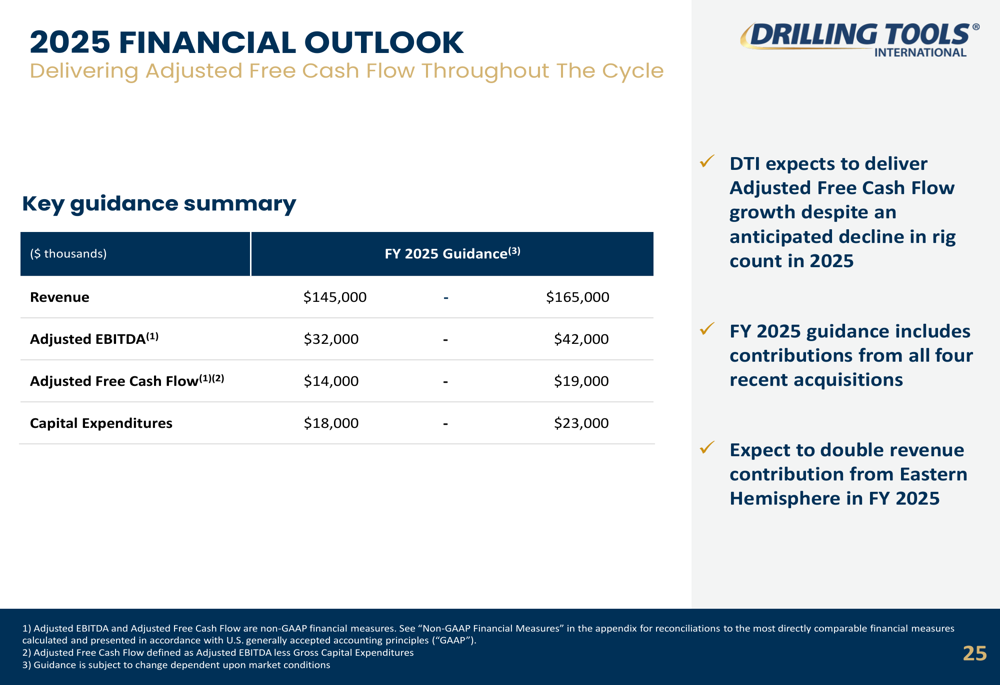
- Revenue: $145 million - $165 million
- Adjusted EBITDA: $32 million - $42 million
- Adjusted Free Cash Flow: $14 million - $19 million
- Capital Expenditures: $18 million - $23 million
This guidance incorporates contributions from all four recent acquisitions and reflects management’s expectation to deliver adjusted free cash flow growth despite an anticipated decline in rig count in 2025. The company also expects to double revenue contribution from the Eastern Hemisphere in FY 2025.
Valuation Perspective
The presentation made a case that DTI is significantly undervalued compared to peers. Based on 2025 estimated EV/EBITDA multiples, DTI’s peer group trades at 4.0x, while other industry segments trade at higher multiples ranging from 4.5x for North American land services to 7.9x for manufacturers and capital equipment.
This valuation gap suggests potential upside for DTI shares if the company continues to execute its growth strategy and the market recognizes its improved financial performance and expanded global footprint.
Conclusion
DTI’s Fall 2025 Investor Presentation portrays a company executing a clear growth strategy focused on acquisitions, international expansion, and technological differentiation. Despite challenging industry conditions evidenced by declining global rig counts, the company has demonstrated resilience with growing revenue and surging free cash flow.
However, investors should note that the stock has faced pressure, trading at $1.92 as of August 13, 2025, down from its 52-week high of $4.47. This disconnect between operational performance and stock price performance may reflect broader market concerns about the energy sector or specific challenges facing DTI that weren’t fully addressed in the presentation.
As DTI continues to integrate its recent acquisitions and expand its global footprint, investors will be watching closely to see if the company can deliver on its 2025 financial guidance and translate its operational success into shareholder value.
Full presentation:
This article was generated with the support of AI and reviewed by an editor. For more information see our T&C.