Microvast Holdings announces departure of chief financial officer

Dynex Capital Inc . (NYSE:DX) reported a decline in book value and negative economic returns for the second quarter of 2025, despite growing its balance sheet and maintaining a high dividend yield. The mortgage REIT presented its quarterly results on July 21, 2025, highlighting both challenges and strategic positioning in the current market environment.
Quarterly Performance Highlights
Dynex Capital’s second quarter results showed deterioration across several key metrics compared to the first quarter. Book value per common share decreased to $11.95 from $12.56 in Q1, while the company reported a comprehensive loss of $0.11 per share compared to income of $0.16 in the previous quarter. Total (EPA:TTEF) economic return turned negative at -0.8%, a significant drop from the positive 2.6% return in Q1.
As shown in the following quarterly performance comparison:
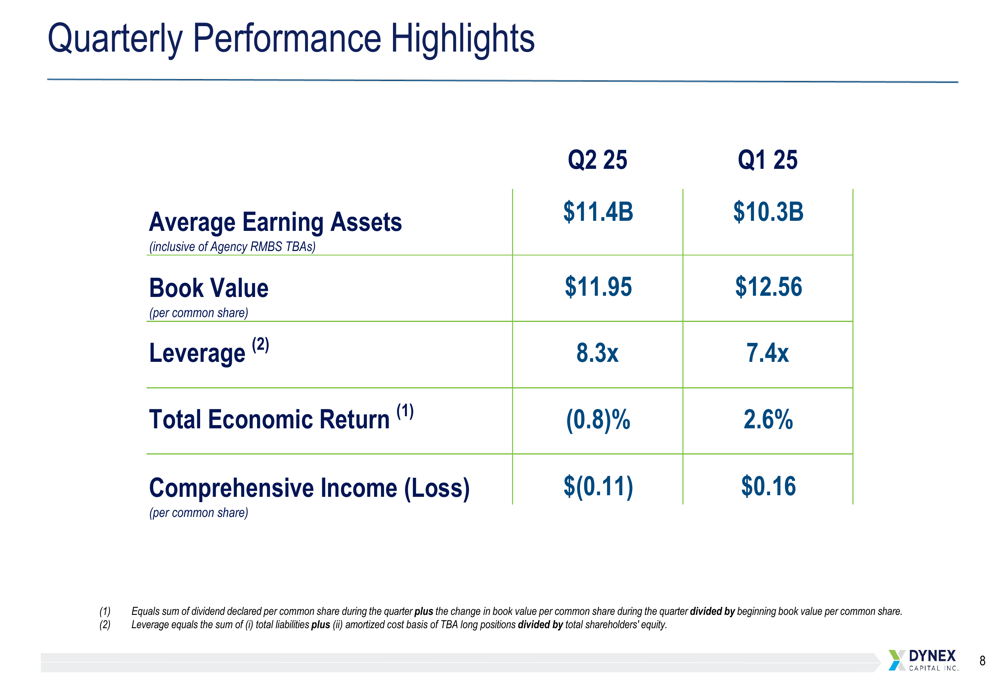
Despite these challenges, Dynex grew its average earning assets to $11.4 billion, up from $10.3 billion in Q1, while increasing leverage from 7.4x to 8.3x. The company maintained its substantial dividend, declaring $0.51 per common share for the quarter, which translates to an annualized yield of 16.7% based on current share prices.
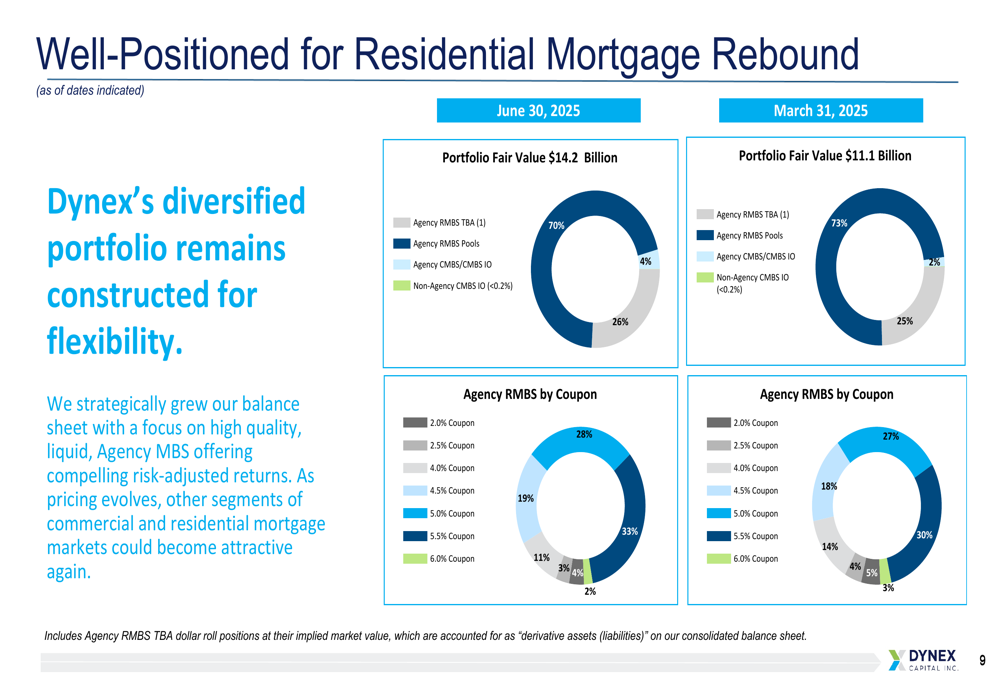
Portfolio Strategy and Composition
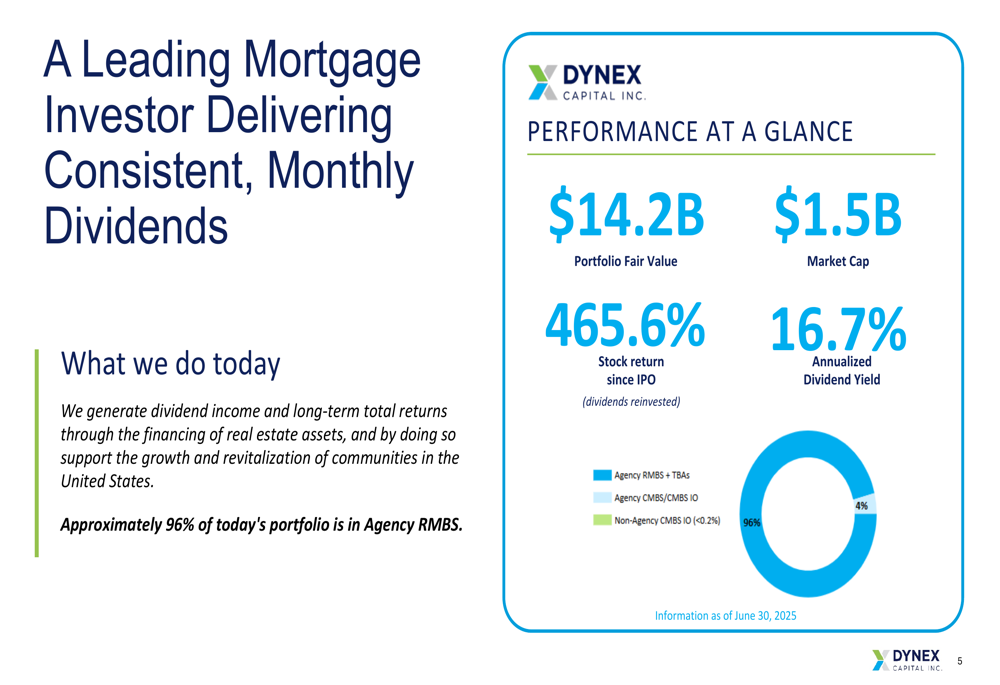
Dynex Capital’s portfolio remains heavily weighted toward Agency Residential Mortgage-Backed Securities (RMBS), which comprise 96% of total holdings. The company made slight adjustments to its portfolio composition in Q2, increasing its allocation to Agency RMBS pools while reducing TBA positions, and doubling its Agency CMBS/CMBS IO allocation from 2% to 4%.
The portfolio composition and coupon distribution is illustrated here:
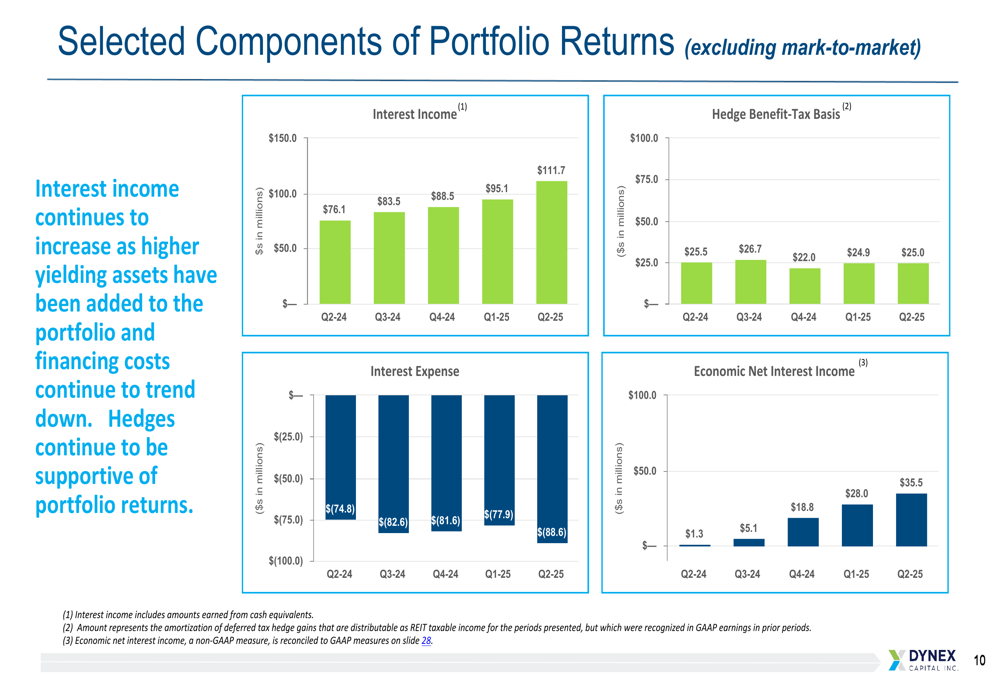
The company’s strategy continues to focus on high-quality, liquid Agency MBS, which management believes offers compelling returns for private capital. Economic net interest income has shown significant improvement year-over-year, increasing from $1.3 million in Q2 2024 to $35.5 million in Q2 2025, demonstrating the potential earning power of the portfolio.
The components of portfolio returns show this positive trend:
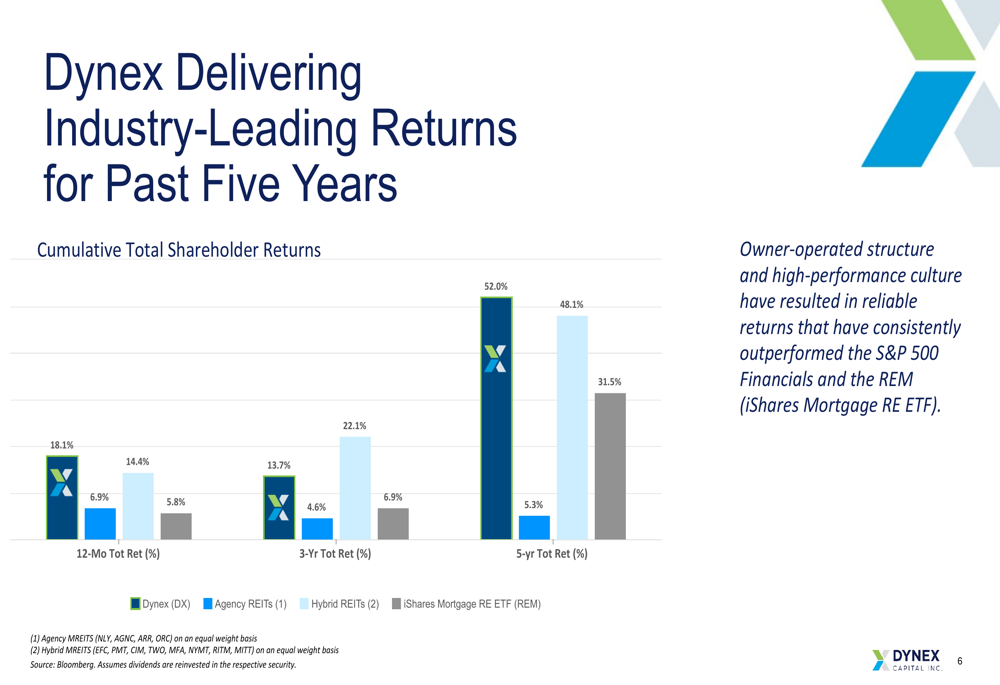
Market Context and Competitive Positioning
Despite the quarterly setback, Dynex Capital continues to outperform its peers over longer time horizons. The company’s total shareholder returns exceed those of Agency REITs, Hybrid REITs, and the iShares Mortgage RE ETF (REM) across 12-month, 3-year, and 5-year periods.
The following chart illustrates this outperformance:
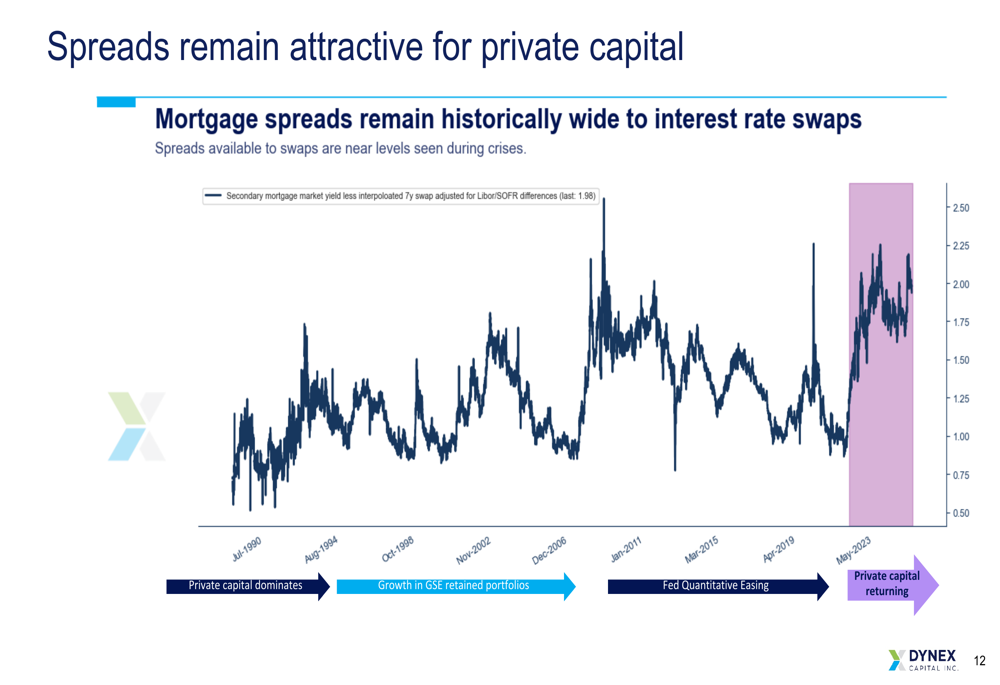
Management highlighted that mortgage spreads remain historically wide relative to interest rate swaps, creating attractive opportunities for private capital. This market dynamic supports Dynex’s strategy of generating returns from the yield spread premium that mortgages offer.
The mortgage spread environment is shown in this historical context:
Macroeconomic Outlook and Risk Management
Dynex is monitoring several key macroeconomic themes that could impact its portfolio, including global power shifts, government policy changes, fiscal deficits, Federal Reserve policy, system liquidity, and demographic trends. The company emphasized its disciplined approach to risk management, maintaining high liquidity to protect the portfolio during volatile periods.
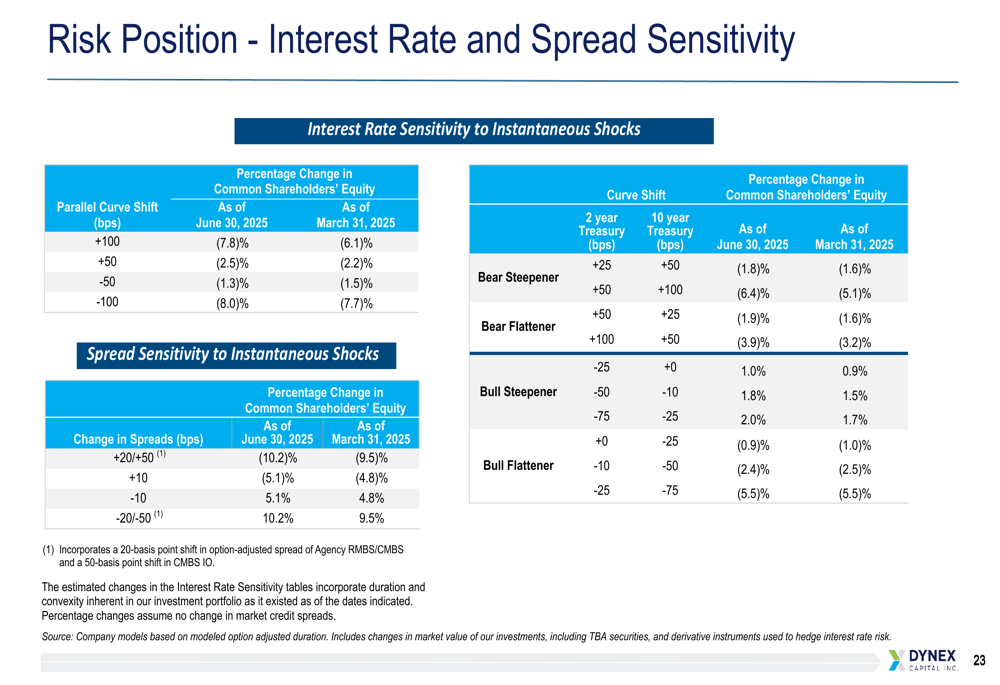
The presentation included an analysis of interest rate and spread sensitivity, demonstrating the potential impact of various market scenarios on shareholder equity:
Forward-Looking Strategy
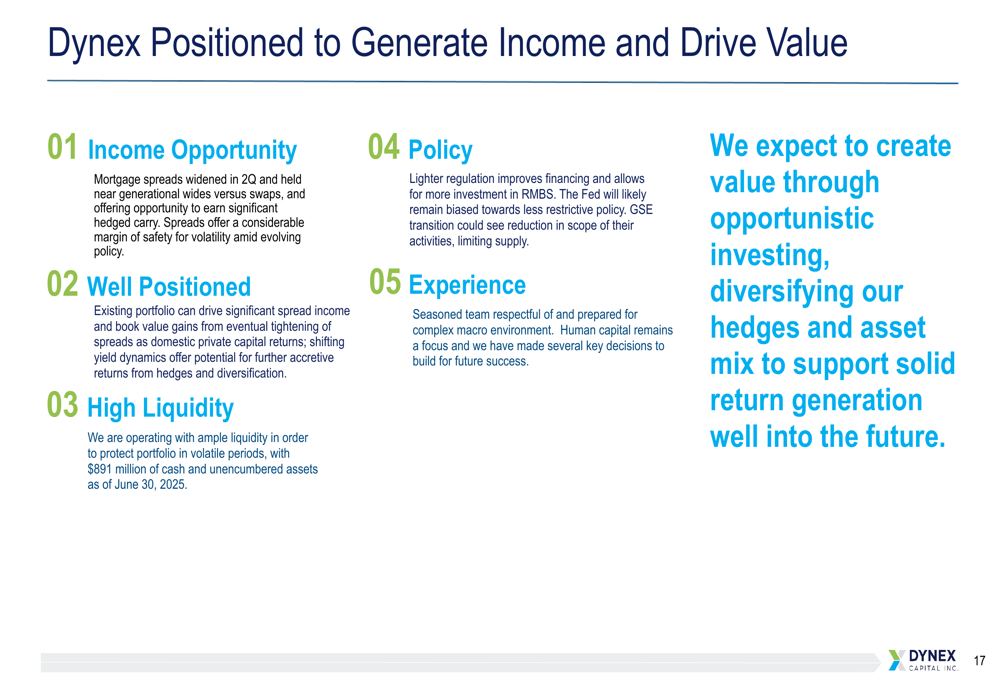
Looking ahead, Dynex Capital believes it is well-positioned to generate income and drive value through several factors: wide mortgage spreads offering significant hedged carry, potential book value gains if spreads tighten, high liquidity to protect during volatile periods, and a seasoned management team prepared for a complex macro environment.
The company’s positioning is summarized in this strategic overview:
Performance at a Glance
Dynex Capital maintains a substantial portfolio with a fair value of $14.2 billion and a market capitalization of $1.5 billion. The company has delivered a 465.6% stock return since its IPO (with dividends reinvested), highlighting its long-term performance despite quarterly fluctuations.
Key metrics are illustrated in this performance snapshot:
The recent decline in book value and negative economic return in Q2 2025 represents a reversal from the positive performance reported in Q1, when the company beat EPS expectations with $0.33 per share versus the forecasted $0.28. The stock has been trading below its 52-week high of $14.52, with the fundamentals data showing a slight premarket decline of 0.24% to $12.50 on the day of the earnings presentation.
Despite the quarterly setback, Dynex Capital continues to emphasize its disciplined risk management approach and strategic positioning to capitalize on current market conditions while maintaining its substantial dividend yield of 16.7%.
Full presentation:
This article was generated with the support of AI and reviewed by an editor. For more information see our T&C.