Morgan Stanley adds Amazon.com as Top Pick

First Horizon National Corporation (NYSE:FHN) released its second quarter 2025 earnings presentation on July 16, showing continued momentum with a 10% sequential increase in earnings per share and solid growth in both loans and deposits. The stock jumped 8.34% in premarket trading to $22.99 following the release, reflecting positive market reception to the results.
Quarterly Performance Highlights
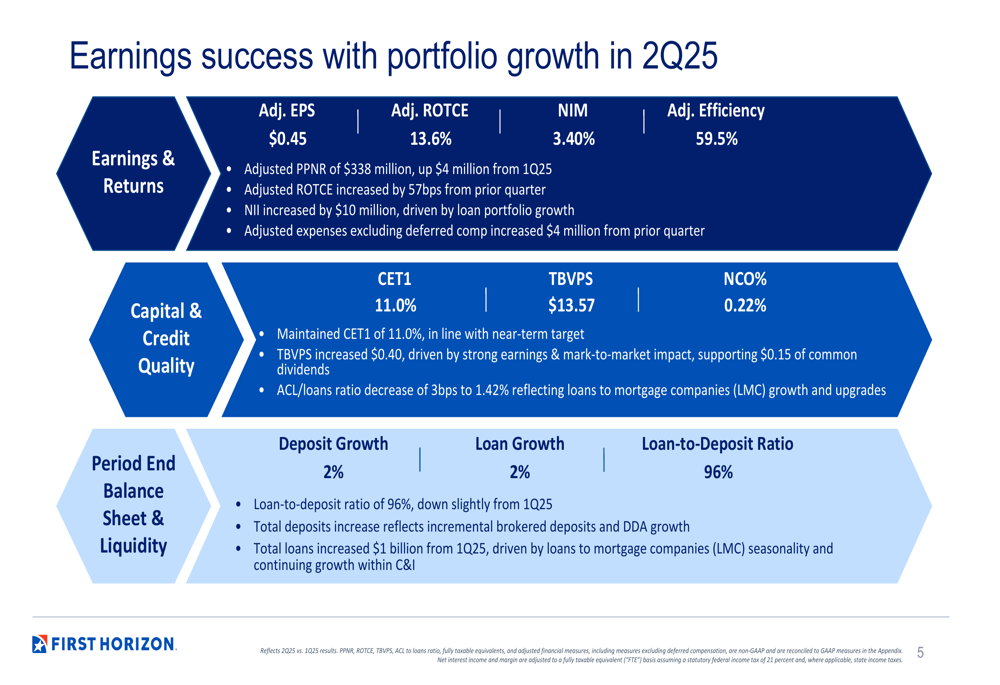
First Horizon reported adjusted earnings per share of $0.45 for Q2 2025, up from $0.41 in the previous quarter and $0.34 in the same period last year, representing a 32% year-over-year increase. The bank’s adjusted return on tangible common equity (ROTCE) improved to 13.6%, up 57 basis points from Q1 2025.
Total (EPA:TTEF) revenue reached $830 million, a 2% increase from the previous quarter’s $812 million, driven by growth in both net interest income and fee income. Pre-provision net revenue (PPNR) grew to $339 million, up 4% from Q1 2025 and 8% from Q2 2024.
As shown in the following comprehensive financial summary:
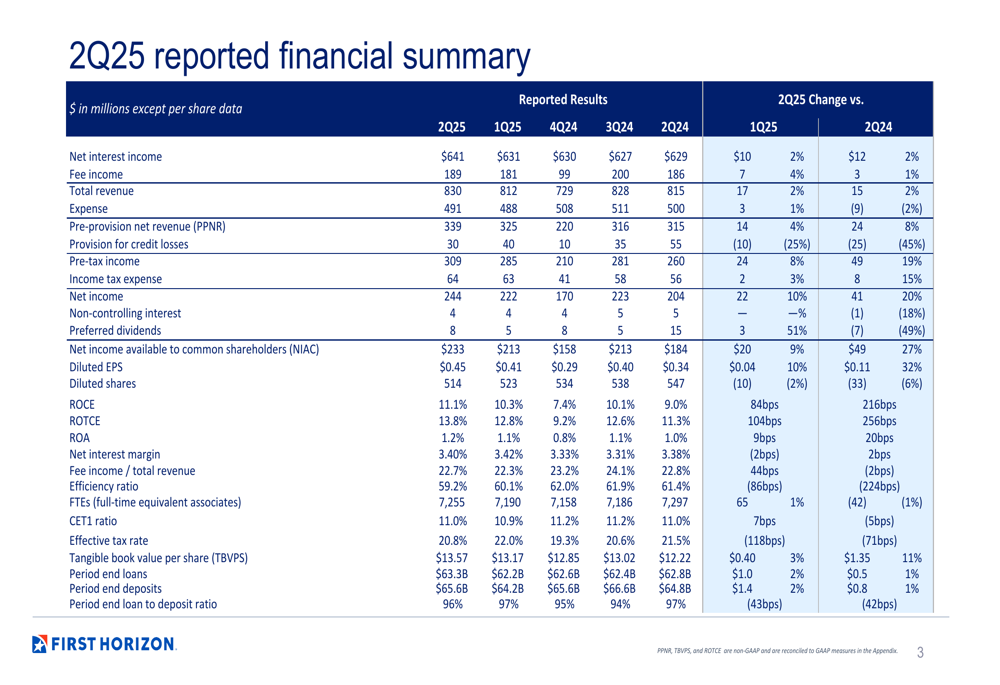
"Our second quarter results demonstrate the strength and resilience of our diversified business model," said the company in its presentation. The bank maintained an adjusted efficiency ratio of 59.5%, reflecting its continued focus on expense discipline while growing revenue.
Loan and Deposit Growth Analysis
First Horizon’s loan portfolio expanded to $63.3 billion at quarter-end, up 2% from the previous quarter. This growth was primarily driven by a $689 million increase in loans to mortgage companies and a $316 million rise in commercial and industrial loans, partially offset by a $203 million decline in commercial real estate balances.
The bank’s deposit base grew to $65.6 billion, an increase of $1.4 billion compared to Q1 2025. This deposit growth supported the loan portfolio expansion while maintaining a loan-to-deposit ratio of 96%.
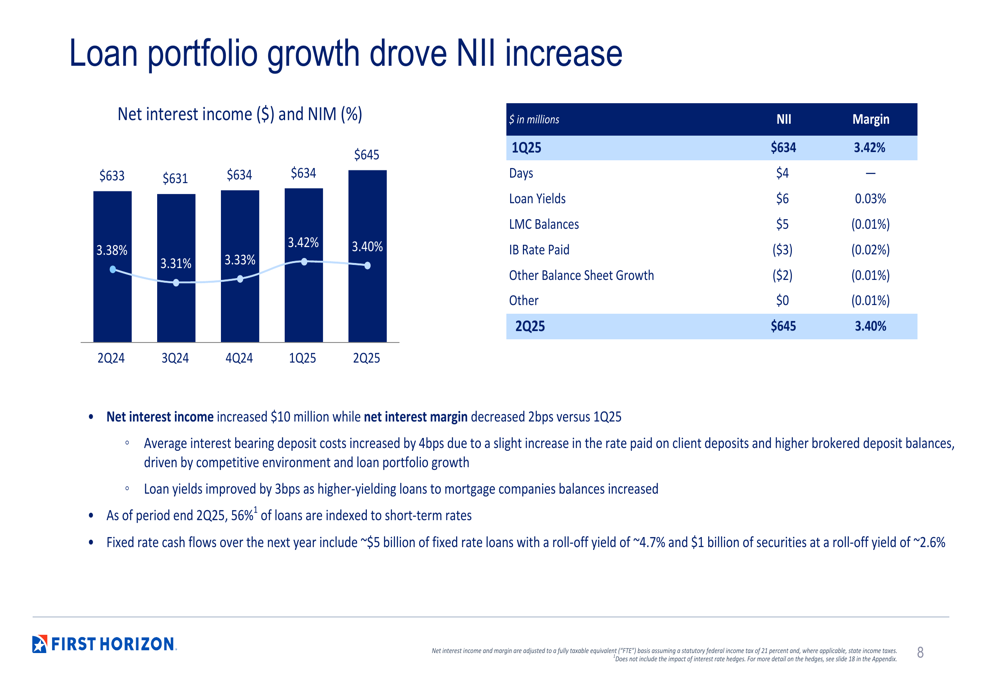
Despite a slight 2 basis point compression in net interest margin to 3.40% from 3.42% in Q1, net interest income increased by $10 million to $645 million. The margin compression was primarily due to a 4 basis point increase in average interest-bearing deposit costs, partially offset by a 3 basis point improvement in loan yields.
The following slide illustrates the key earnings metrics and portfolio growth:
The bank’s net interest income growth was driven by loan portfolio expansion, as shown in this chart:
Credit Quality and Capital Position
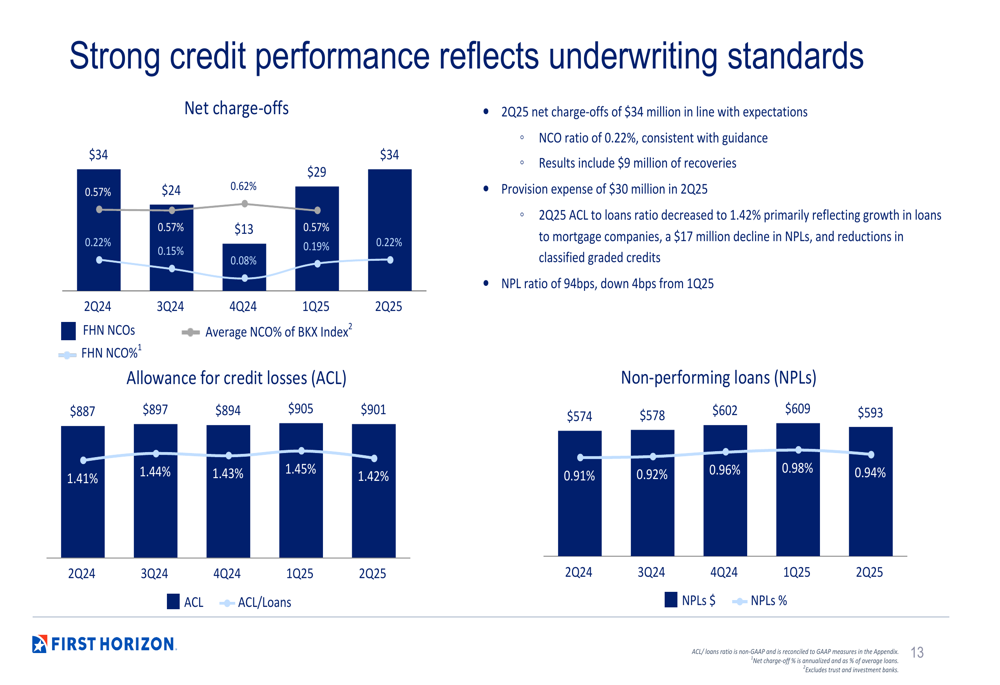
First Horizon maintained strong credit quality in the second quarter, with net charge-offs of $34 million, representing 0.22% of loans. The provision for credit losses was $30 million, down $10 million from the previous quarter. The allowance for credit losses to loans ratio decreased slightly to 1.42%, while the non-performing loan ratio improved by 4 basis points to 0.94%.
The following chart illustrates the bank’s credit performance metrics:
Capital levels remained robust, with the Common Equity Tier 1 (CET1) ratio increasing slightly to 11.0%. Tangible book value per share grew to $13.57, up $0.40 from the previous quarter, reflecting the bank’s continued profitability and capital generation.
Strategic Focus and Outlook
First Horizon reiterated its 2025 outlook, projecting adjusted revenue growth of flat to 4% and adjusted expense growth of flat to 2%. The bank expects net charge-offs to remain in the 0.15% to 0.25% range and aims to maintain a CET1 ratio between 10.5% and 11.0%.
Looking beyond 2025, the bank outlined its strategy to achieve an intermediate-term ROTCE target of 15% or higher. Key components of this strategy include strategic capital management, leveraging its attractive geographic footprint in growth markets, and capitalizing on its diversified business model.
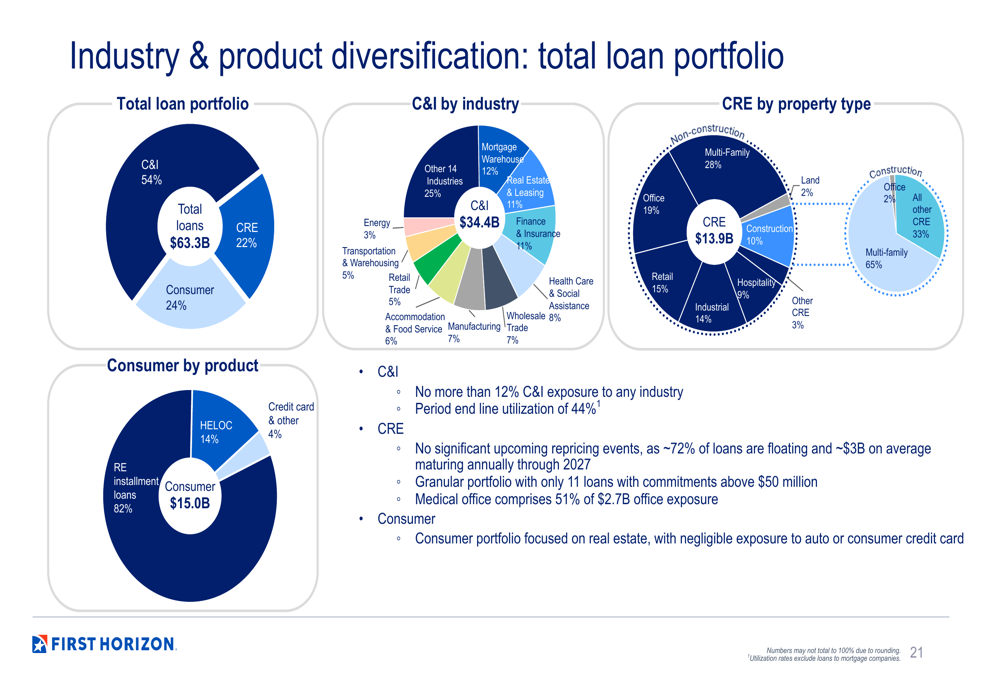
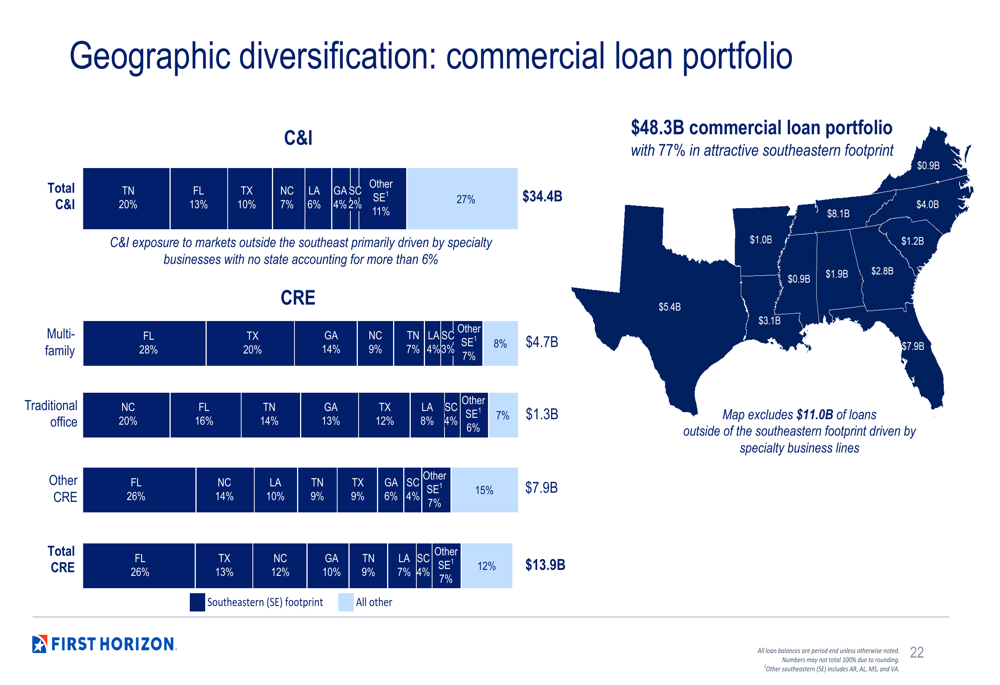
The bank’s loan portfolio remains well-diversified across industries and geographies, with 77% of its commercial loan portfolio concentrated in the attractive southeastern U.S. footprint. This diversification helps mitigate risk while positioning the bank for continued growth.
As illustrated in this breakdown of the loan portfolio:
The geographic distribution of the commercial loan portfolio highlights the bank’s strong presence in the Southeast:
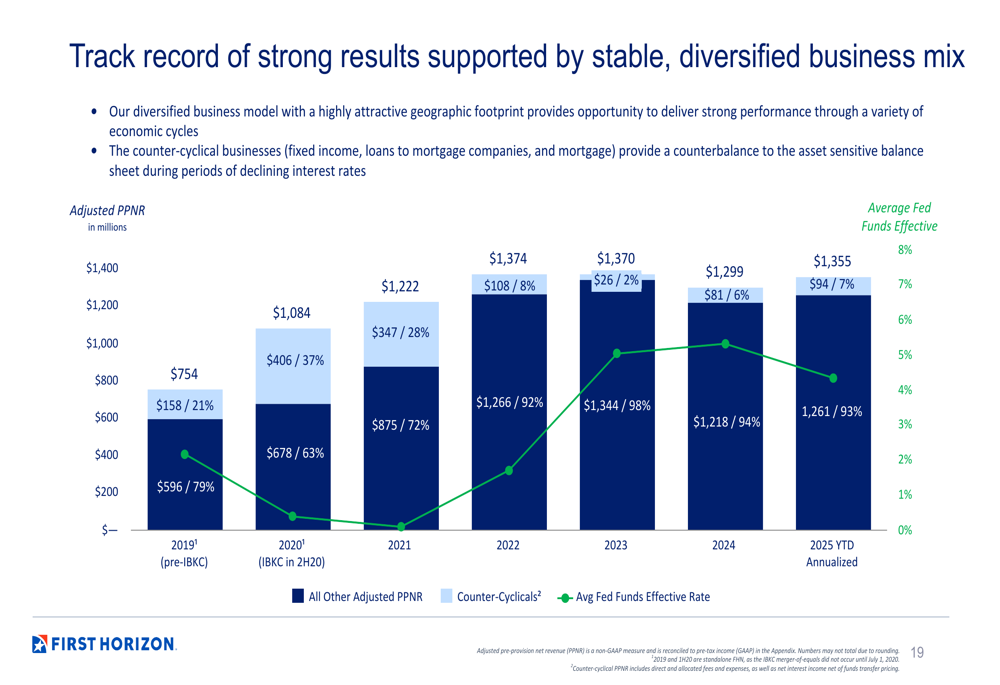
First Horizon’s track record of strong results is supported by its stable, diversified business mix, as shown in the following chart of adjusted PPNR growth:
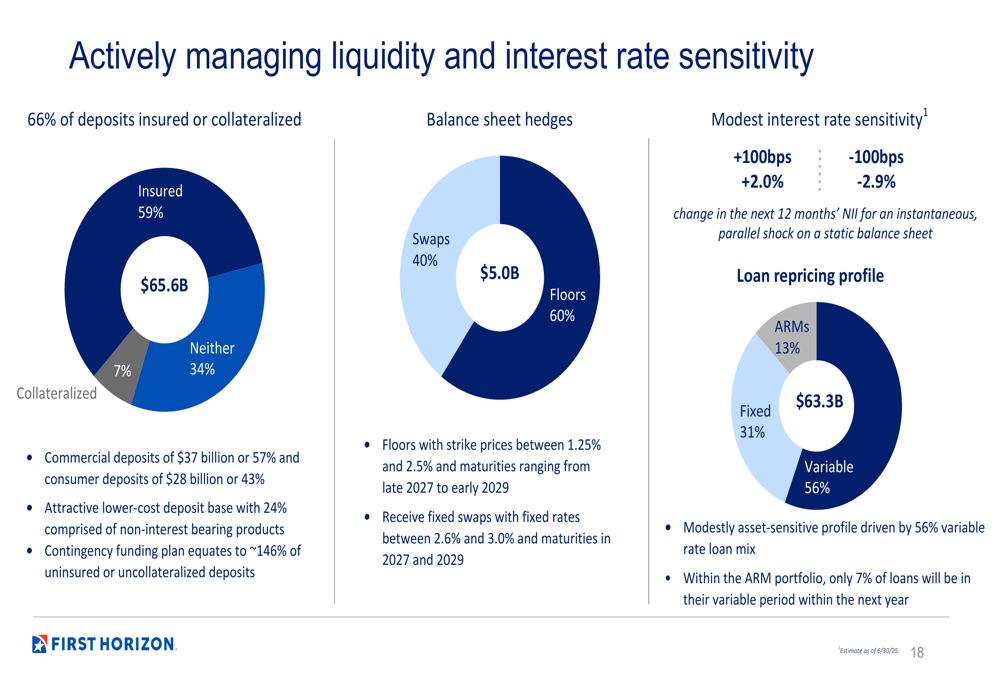
The bank continues to actively manage liquidity and interest rate sensitivity, with 66% of deposits insured or collateralized and a modestly asset-sensitive profile driven by its 56% variable rate loan mix.
With its strong Q2 performance, First Horizon appears well-positioned to continue executing its strategic plan while navigating the evolving economic environment. The market’s positive reaction to the results suggests investors are optimistic about the bank’s growth trajectory and ability to deliver on its intermediate-term profitability targets.
Full presentation:
This article was generated with the support of AI and reviewed by an editor. For more information see our T&C.