Microvast Holdings announces departure of chief financial officer
Introduction & Market Context
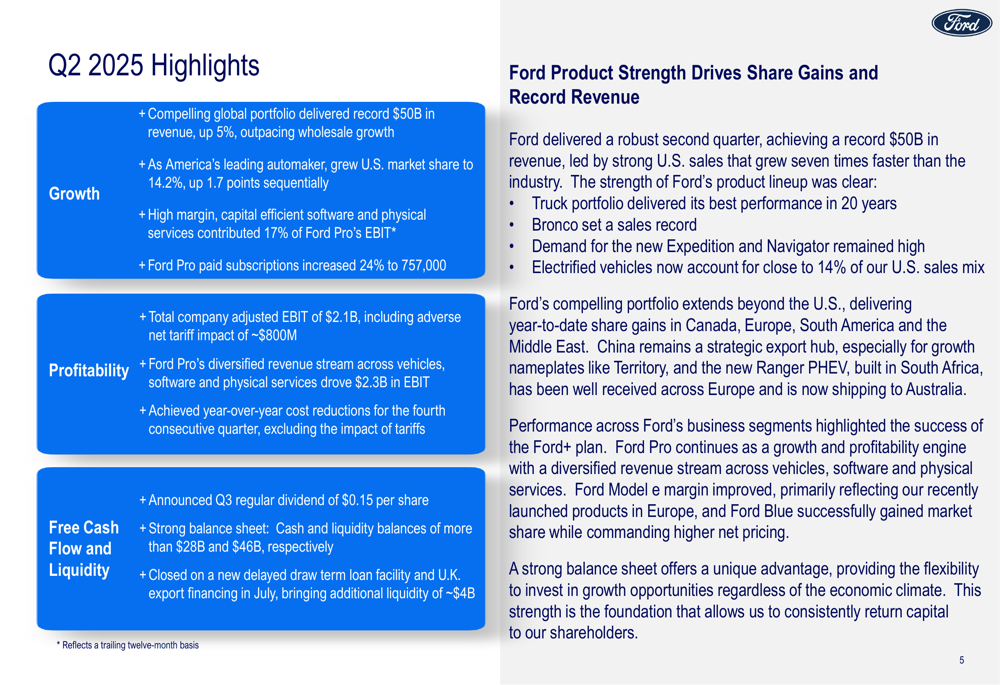
Ford Motor Company (NYSE:F) reported record quarterly revenue of $50.2 billion in its Q2 2025 earnings presentation, representing a 5% year-over-year increase. However, profitability metrics declined across the board as the automaker navigates challenging market conditions and tariff impacts. The company’s stock closed at $11.08 on July 30, down 1.58% for the day, though it showed modest gains of 0.27% in after-hours trading.
Ford’s quarterly performance demonstrated the company’s continued strength in its commercial vehicle segment while highlighting ongoing challenges in its electric vehicle business. The presentation also revealed a downward revision to full-year guidance, primarily attributed to tariff impacts.
Quarterly Performance Highlights
Ford achieved record Q2 revenue of $50.2 billion, up 5% year-over-year, driven by strong performance in its truck portfolio and market share gains in the U.S. to 14.2%. Despite the revenue growth, adjusted EBIT declined 22% to $2.1 billion, with adjusted EBIT margin falling 1.5 percentage points to 4.3%. Adjusted earnings per share came in at $0.37, down $0.10 from the prior year.
As shown in the following comprehensive financial snapshot from Ford’s presentation, the company’s performance varied significantly across its business segments:
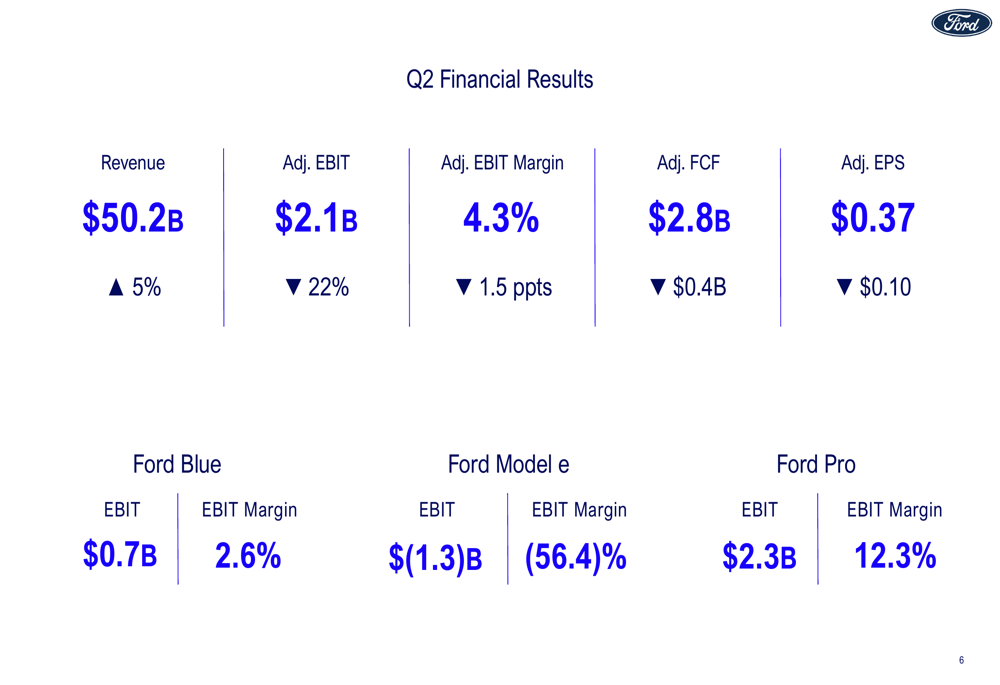
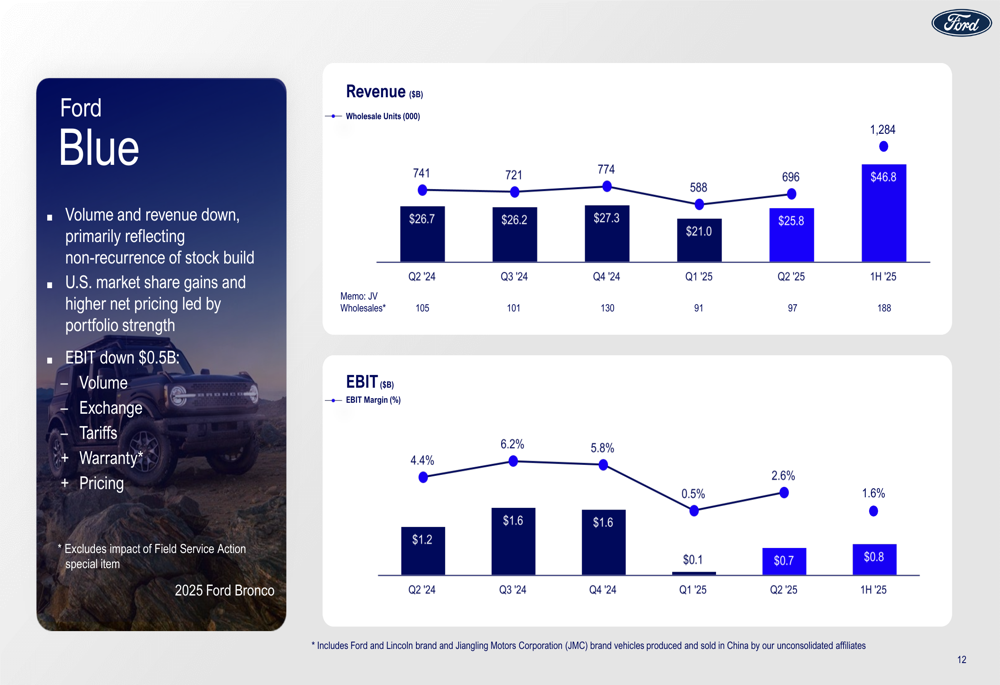
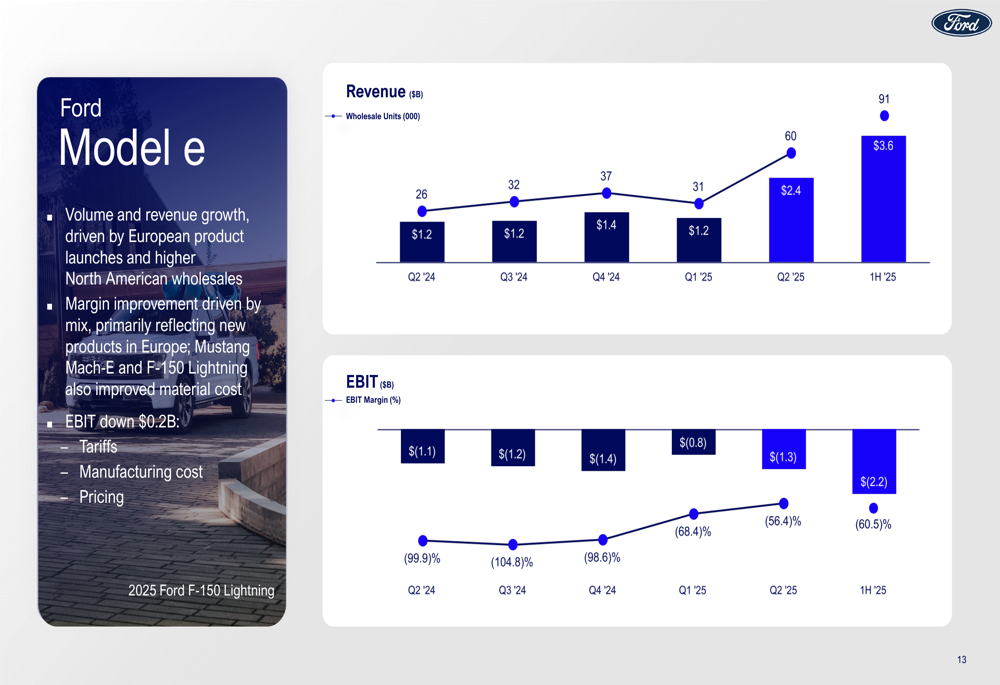
Ford Pro emerged as the standout performer with $2.3 billion in EBIT and a robust 12.3% margin. Ford Blue, the traditional internal combustion engine business, generated $0.7 billion in EBIT with a 2.6% margin. Meanwhile, Ford Model e, the electric vehicle division, continued to post losses with a negative EBIT of $1.3 billion, though its margin improved to -56.4% compared to deeper losses in previous quarters.
The company highlighted its fourth consecutive quarter of year-over-year cost reductions as a positive development amid profitability challenges.
Segment Performance Analysis
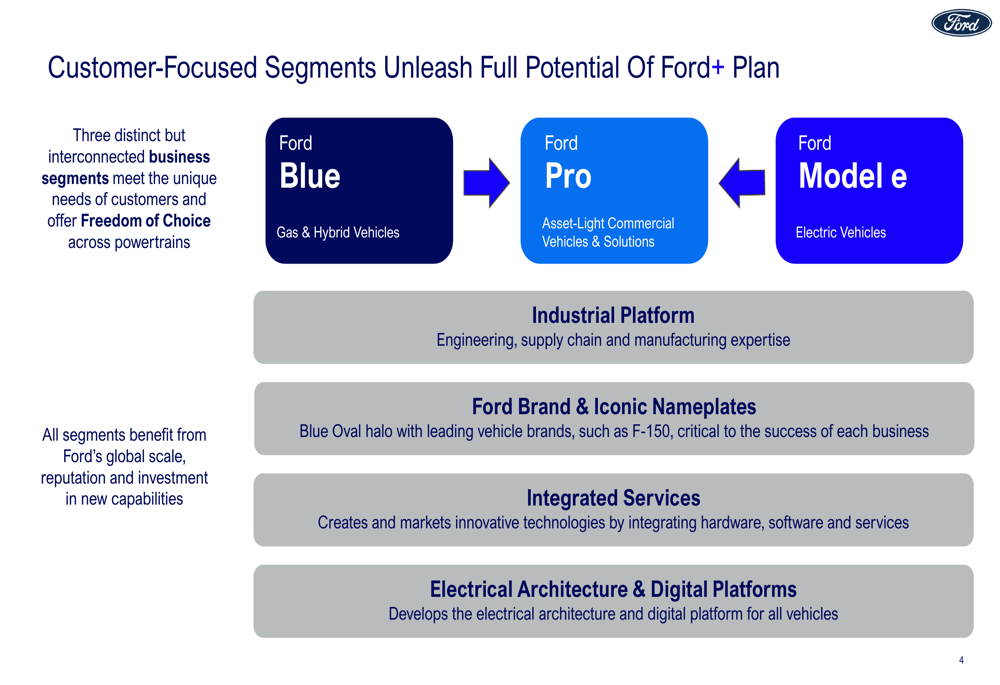
Ford’s segmented approach to its business continues to show varying results across its three core divisions. The company’s strategy of offering "Freedom of Choice" across powertrains is illustrated in this organizational structure:
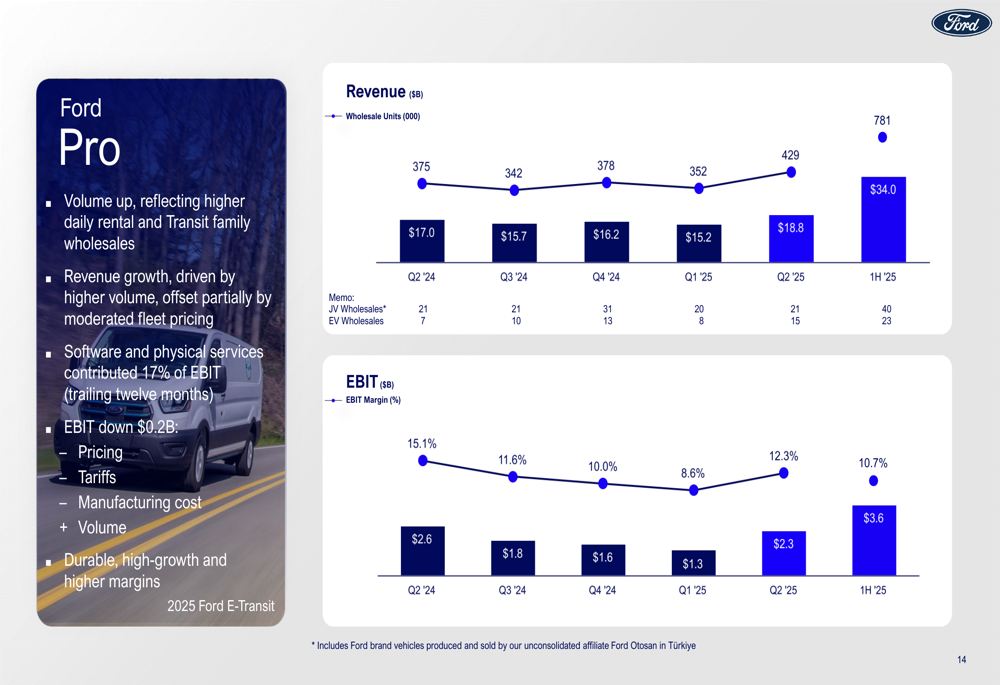
Ford Pro, the commercial vehicle division, remained the profit engine for the company. High-margin software and services contributed 17% of Ford Pro’s EBIT, with paid subscriptions increasing 24% to 757,000. The following chart details Ford Pro’s performance metrics over recent quarters:
Ford Blue showed modest profitability with $0.7 billion in EBIT and a 2.6% margin. The segment benefited from strong truck sales, with Ford noting its truck portfolio delivered its best performance in 20 years. The segment’s quarterly performance is illustrated here:
Ford Model e continued to generate significant losses, though with improving margins compared to previous periods. Revenue doubled year-over-year to $2.4 billion as wholesale units increased to 60,000 units. The division’s performance trajectory is shown below:
Cash Position and Liquidity
Ford maintained a strong financial position with cash and liquidity balances exceeding $28 billion and $46 billion, respectively. The company generated $2.8 billion in adjusted free cash flow during Q2, though this represented a $0.4 billion decline from the prior year. Ford also secured new financing providing additional liquidity of approximately $4 billion.
The following chart illustrates Ford’s cash flow, cash balance, and liquidity trends over recent quarters:
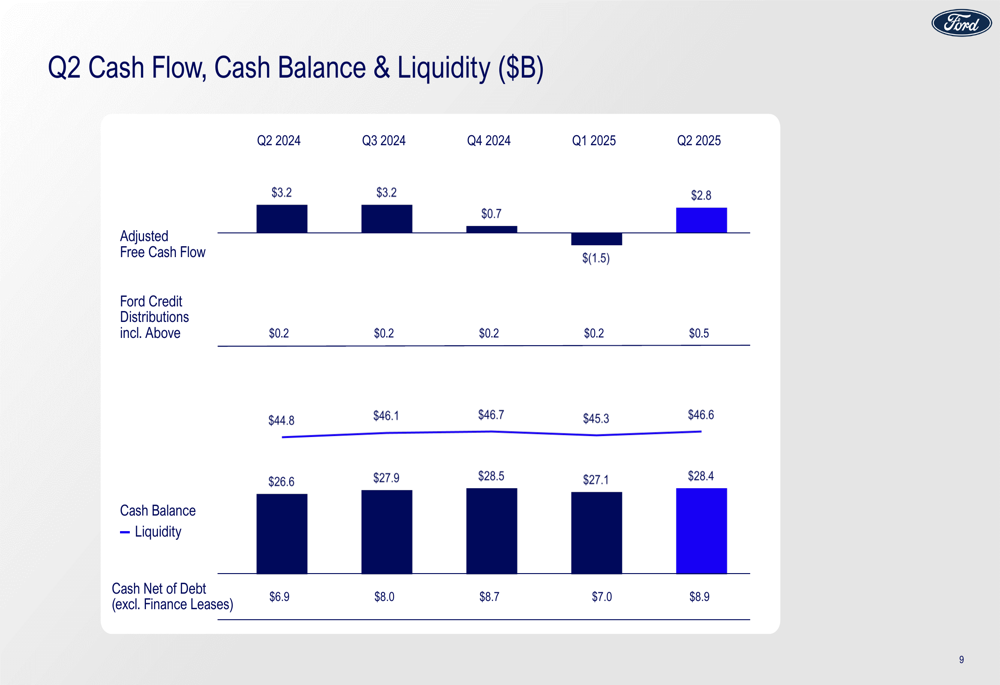
The company declared a Q3 regular dividend of $0.15 per share, maintaining its commitment to shareholder returns despite profitability challenges.
Revised 2025 Guidance
Ford revised its full-year 2025 guidance downward, primarily due to tariff impacts. The company now expects adjusted EBIT of $6.5 billion to $7.5 billion, compared to its previous outlook of $7.0 billion to $8.5 billion. The net tariff impact is estimated at approximately $2.0 billion for the full year.
The updated guidance and key assumptions are detailed in this slide:
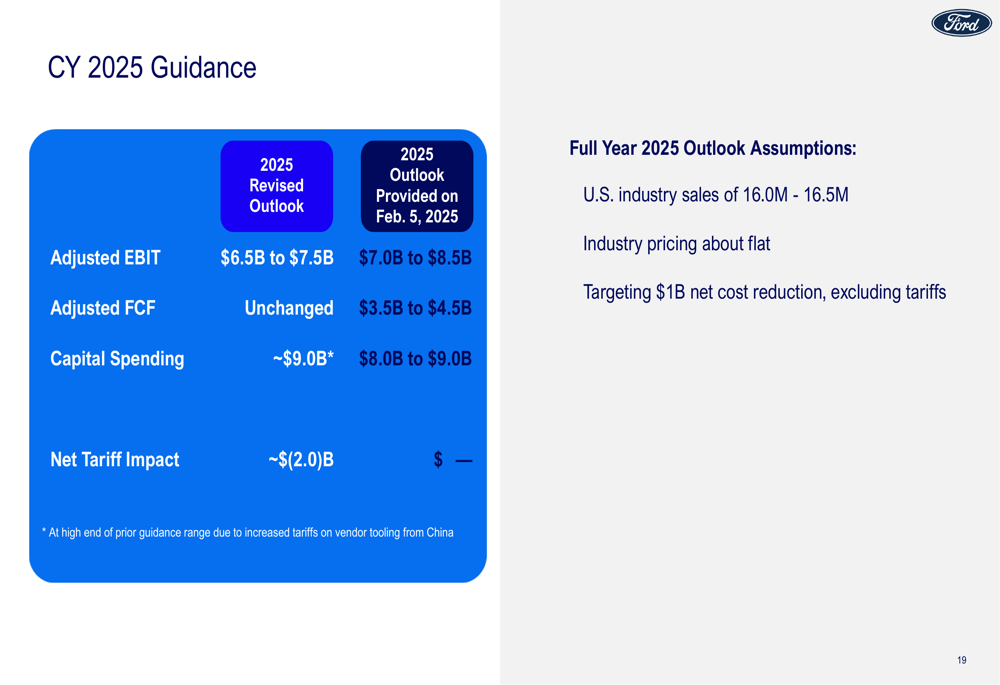
Capital spending is now projected at approximately $9.0 billion, up from the previous range of $8.0 billion to $9.0 billion. The company maintained its adjusted free cash flow guidance of $3.5 billion to $4.5 billion.
Ford’s outlook assumptions include U.S. industry sales of 16.0 million to 16.5 million vehicles, flat industry pricing, and a target of $1 billion in net cost reduction, excluding tariffs.
Strategic Initiatives and Outlook
Ford’s presentation emphasized several strategic initiatives aimed at improving long-term performance. The company highlighted its continued focus on cost reduction and quality improvement, noting progress in warranty costs and customer satisfaction metrics.
The new Ranger PHEV (Plug-in Hybrid Electric Vehicle) is now shipping to Australia, representing Ford’s ongoing commitment to electrification alongside traditional powertrains. This product strategy aligns with the company’s "Freedom of Choice" approach across its portfolio.
As shown in the quarterly highlights slide, Ford is placing increasing emphasis on software and services, particularly within its Pro segment:
Looking ahead, Ford faces challenges from tariff impacts and competitive pressures but maintains advantages from its strong U.S. manufacturing footprint and diversified powertrain strategy. The company’s ability to execute on cost reduction targets while navigating tariff headwinds will be crucial to meeting its revised guidance for the remainder of 2025.
Despite the profitability challenges and guidance revision, Ford’s record revenue and strong cash position provide a foundation for continued investment in its strategic priorities across its three business segments.
Full presentation:
This article was generated with the support of AI and reviewed by an editor. For more information see our T&C.