Is this U.S.-China selloff a buy? A top Wall Street voice weighs in

Introduction & Market Context
Franklin Street Properties Corp. (NYSE American:FSP) released its second quarter 2025 supplemental operating and financial data, revealing a mixed performance with improved bottom-line results despite continued pressure on rental revenue and occupancy rates. The office REIT, which focuses on infill and central business district properties in the U.S. Sunbelt and Mountain West regions, owned 14 properties totaling 4.8 million square feet as of June 30, 2025.
The company’s performance comes amid a challenging environment for office REITs, with FSP’s stock price declining from $1.78 at the end of Q1 2025 to $1.64 at the end of Q2 2025. This represents a continuation of the downward trend from the company’s 52-week high of $2.21, though still above its 52-week low of $1.36.
Quarterly Performance Highlights
FSP reported a net loss of $7.88 million or $0.08 per share for Q2 2025, a significant improvement from the $21.44 million or $0.21 per share loss reported in Q1 2025. This improvement came despite a slight decline in rental revenue, which fell to $26.72 million in Q2 from $27.11 million in Q1.
As shown in the following comprehensive financial highlights table, the company’s performance metrics show mixed results across several quarters:
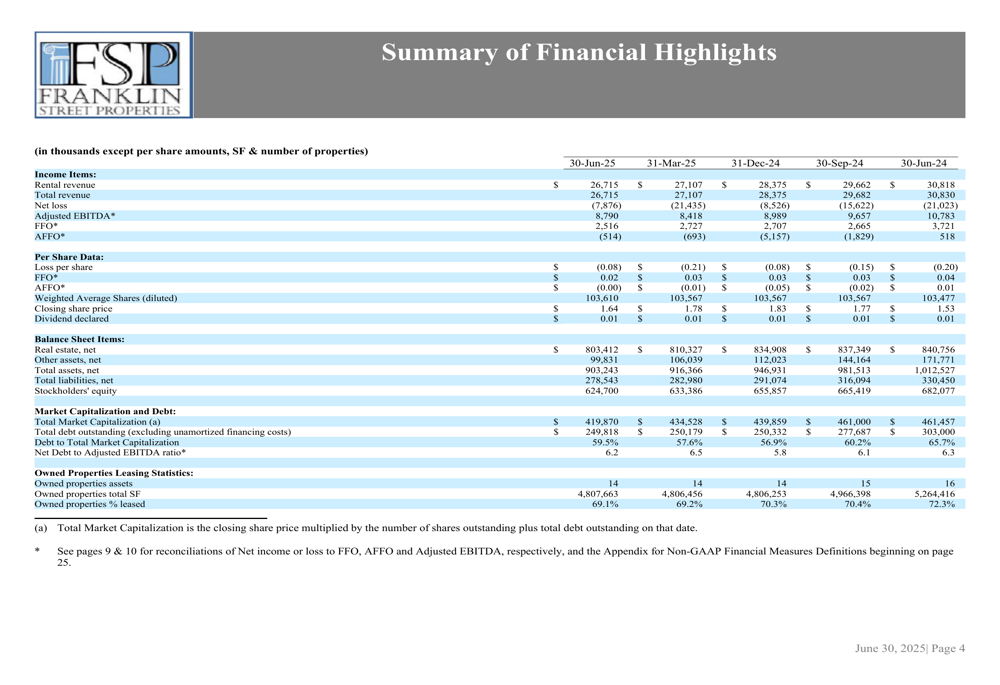
A key contributor to the improved bottom line was a $384,000 gain on property sales in Q2 2025, contrasting sharply with the $13.28 million loss on property sales recorded in Q1. This positive swing helped offset ongoing operational challenges, including a slight decline in the company’s occupancy rate from 69.2% in Q1 to 69.1% in Q2 2025.
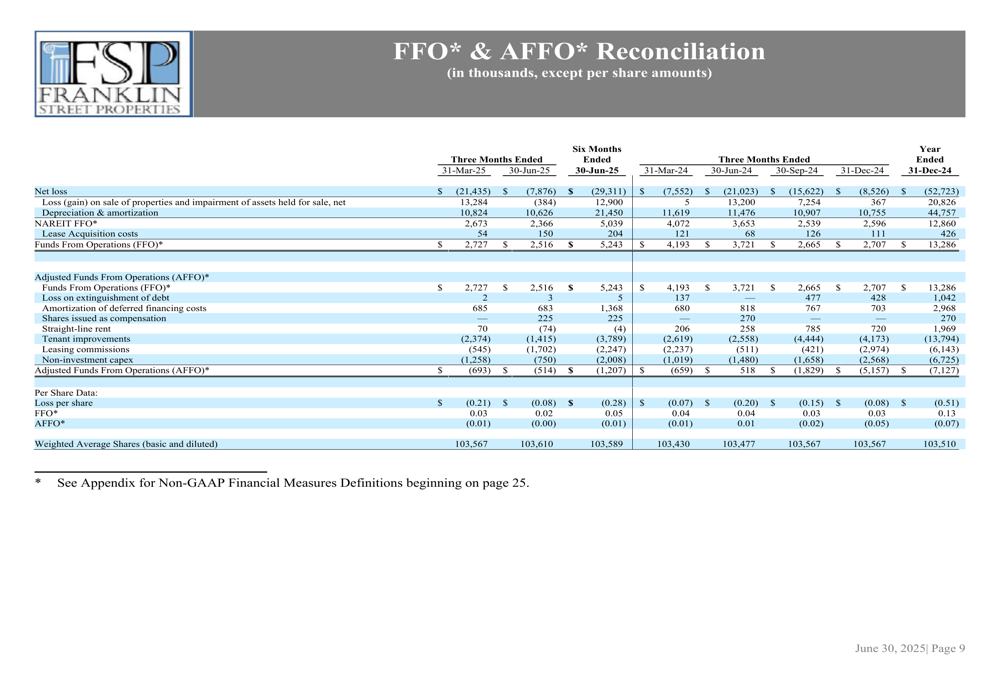
Funds From Operations (FFO), a critical metric for REITs, decreased slightly to $2.52 million ($0.02 per share) in Q2 from $2.73 million ($0.03 per share) in Q1. However, Adjusted Funds From Operations (AFFO) improved to -$514,000 in Q2 from -$693,000 in Q1, though still remaining in negative territory.
The following reconciliation details the calculation of these important REIT performance metrics:
Detailed Financial Analysis
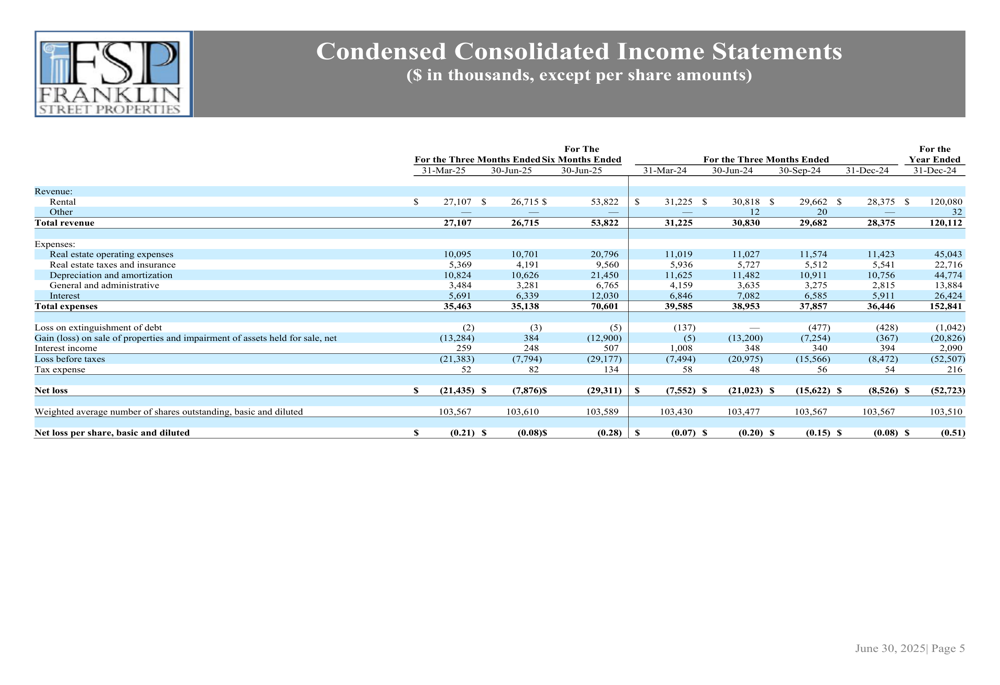
FSP’s income statement reveals the ongoing pressure on revenue coupled with relatively stable expenses. Interest expenses increased to $6.34 million in Q2 from $5.69 million in Q1, while real estate operating expenses rose slightly to $10.70 million from $10.10 million. However, real estate taxes and insurance decreased significantly to $4.19 million from $5.37 million.
The company’s condensed consolidated income statement provides a comprehensive view of these financial dynamics:
From a balance sheet perspective, FSP maintained a relatively stable financial position with total assets of $903.24 million as of June 30, 2025, down from $916.37 million at the end of Q1. Total liabilities decreased to $278.54 million from $282.98 million, while stockholders’ equity declined to $624.70 million from $633.39 million.
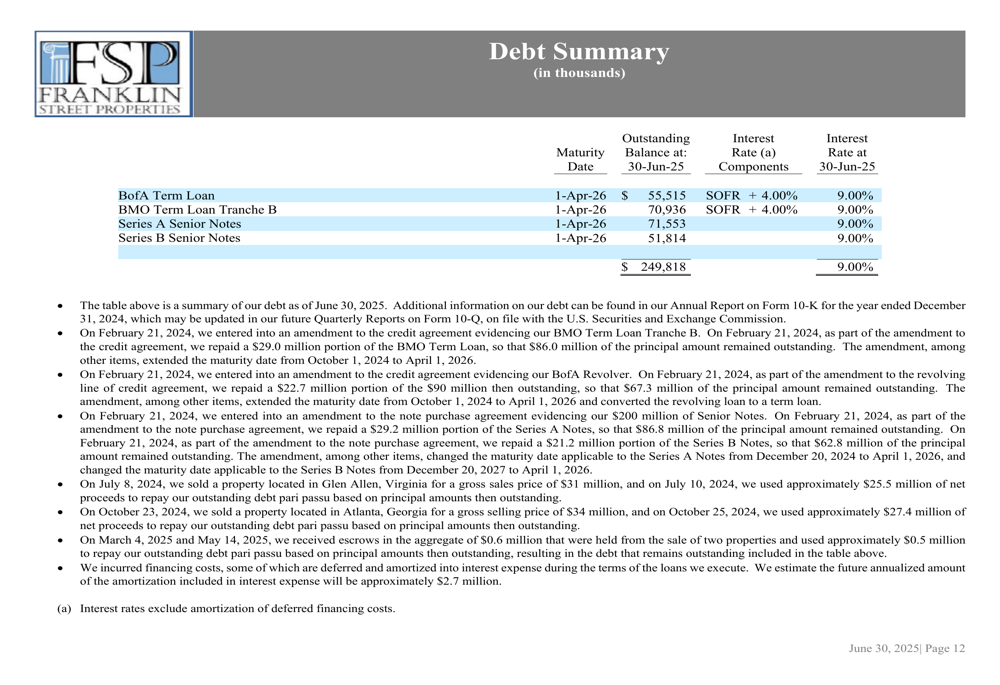
The company’s debt profile remained relatively stable with total debt outstanding of $249.82 million at the end of Q2, slightly down from $250.18 million at the end of Q1. However, the debt to total market capitalization ratio increased to 59.5% from 57.6%, primarily due to the decline in stock price affecting the equity component of market capitalization.
The following debt summary provides details on FSP’s borrowing structure:
Property Performance Analysis
FSP’s property portfolio continued to generate positive Net Operating Income (NOI), with Property NOI increasing slightly to $11.56 million in Q2 from $11.34 million in Q1. The company’s properties are distributed across three regions, with the West region contributing the highest NOI at $5.52 million, followed by the South at $4.39 million and the Midwest at $1.76 million.
The regional breakdown of Property NOI is illustrated in this detailed comparison:
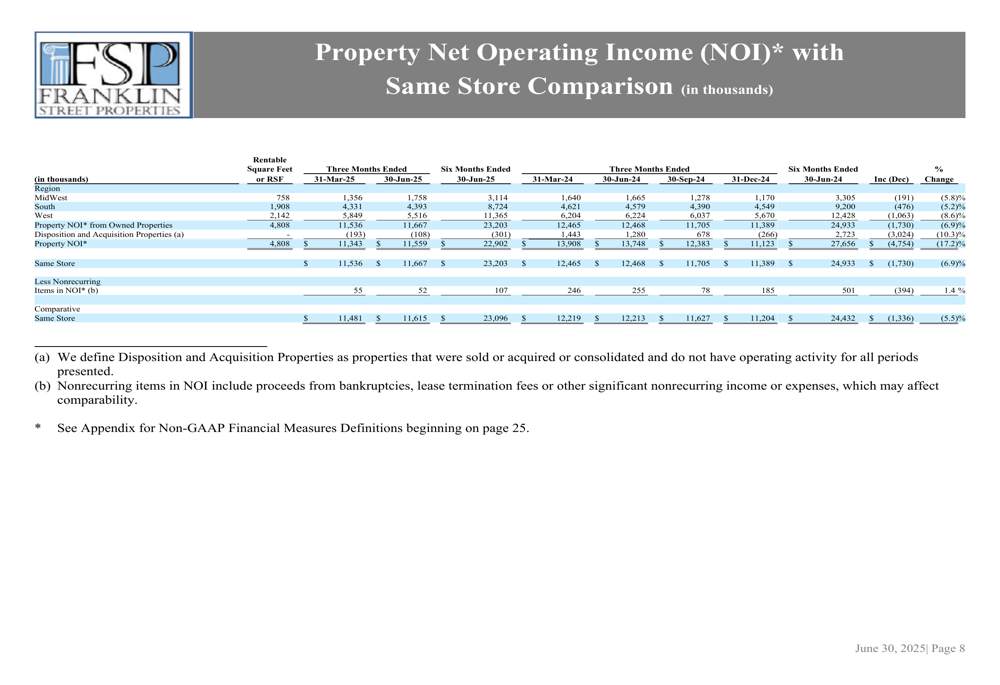
This regional performance data reveals that the West region, while still the strongest contributor, saw a decline in NOI from $5.85 million in Q1 to $5.52 million in Q2. Conversely, both the South and Midwest regions showed improvement, with the Midwest experiencing a particularly strong increase from $1.36 million to $1.76 million.
The company’s ability to maintain stable Property NOI despite declining occupancy rates suggests effective expense management and potentially improved rental rates on existing leases. However, the continued downward trend in occupancy from 72.3% in Q2 2024 to 69.1% in Q2 2025 remains a concern for long-term performance.
Strategic Initiatives and Outlook
FSP’s Q2 2025 results reflect the company’s ongoing strategic efforts to navigate a challenging office real estate market. The positive gain on property sales in Q2 suggests successful execution of strategic dispositions, contrasting with the significant loss recorded in Q1 2025.
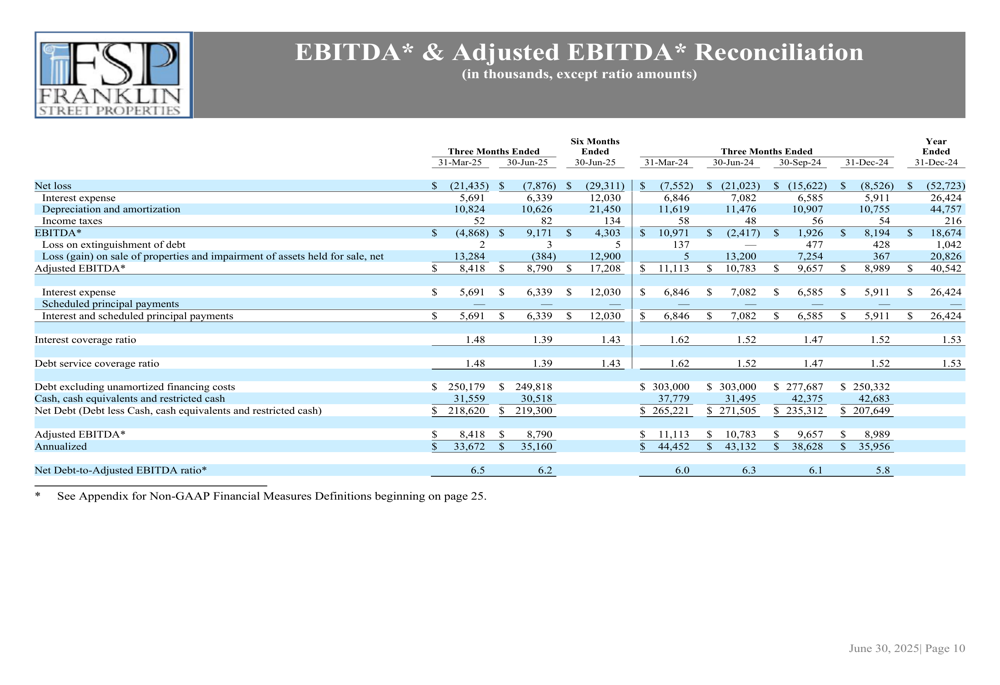
The company’s debt management strategy appears to be yielding modest results, with a slight reduction in total debt and an improved Net Debt to Adjusted EBITDA ratio of 6.2 in Q2 from 6.5 in Q1. This aligns with statements made during the Q1 2025 earnings call, where management emphasized debt reduction as a strategic priority.
As shown in the following EBITDA reconciliation, the company’s interest coverage and debt service coverage ratios remain above 1.0, though they declined slightly from Q1 to Q2:
Looking forward, FSP faces continued challenges in the office sector, particularly regarding occupancy rates and rental revenue. The company’s focus on the Sunbelt and Mountain West regions may provide some insulation from broader market trends, but the persistent decline in occupancy suggests ongoing headwinds.
During the Q1 2025 earnings call, management had expressed optimism about improved leasing activity in coming quarters, particularly in Texas markets. However, the Q2 results show limited progress on this front, with occupancy rates continuing to decline slightly. This suggests that the "wait-and-watch" position of prospective tenants noted in the Q1 call may be persisting longer than anticipated.
The company continues to pay a quarterly dividend of $0.01 per share, maintaining this level across all reported periods. While this represents a modest yield, it demonstrates management’s commitment to returning capital to shareholders despite ongoing operational challenges.
As FSP moves into the second half of 2025, investors will be watching closely for signs of stabilization in occupancy rates and rental revenue, as well as continued progress on strategic property sales and debt management initiatives.
Full presentation:
This article was generated with the support of AI and reviewed by an editor. For more information see our T&C.