United Homes Group stock plunges after Nikki Haley, directors resign

Introduction & Market Context
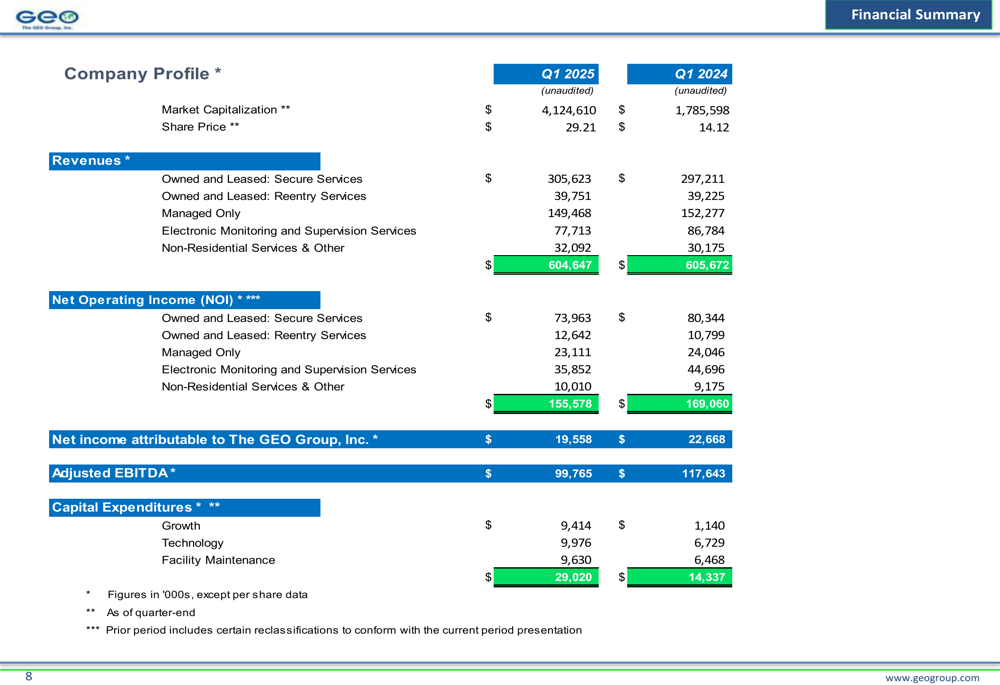
The GEO Group, Inc. (NYSE:GEO) released its first quarter 2025 supplemental information, revealing a mixed financial performance characterized by stable revenue but declining profitability compared to the same period last year. Despite these challenges, the company’s stock has experienced remarkable growth, more than doubling year-over-year from $14.12 to $29.21 per share.
However, GEO’s stock has retreated in recent trading, down 3.16% in the most recent session to $30.37, with premarket trading showing a further decline of 4.54% to $28.99. This pullback comes after the stock has traded in a wide 52-week range of $11.75 to $36.46.
The company continues to position itself as a leading diversified government service provider specializing in secure facilities, processing centers, and community reentry centers, with a significant portion of its business tied to U.S. Immigration & Customs Enforcement (ICE) contracts.
Quarterly Performance Highlights
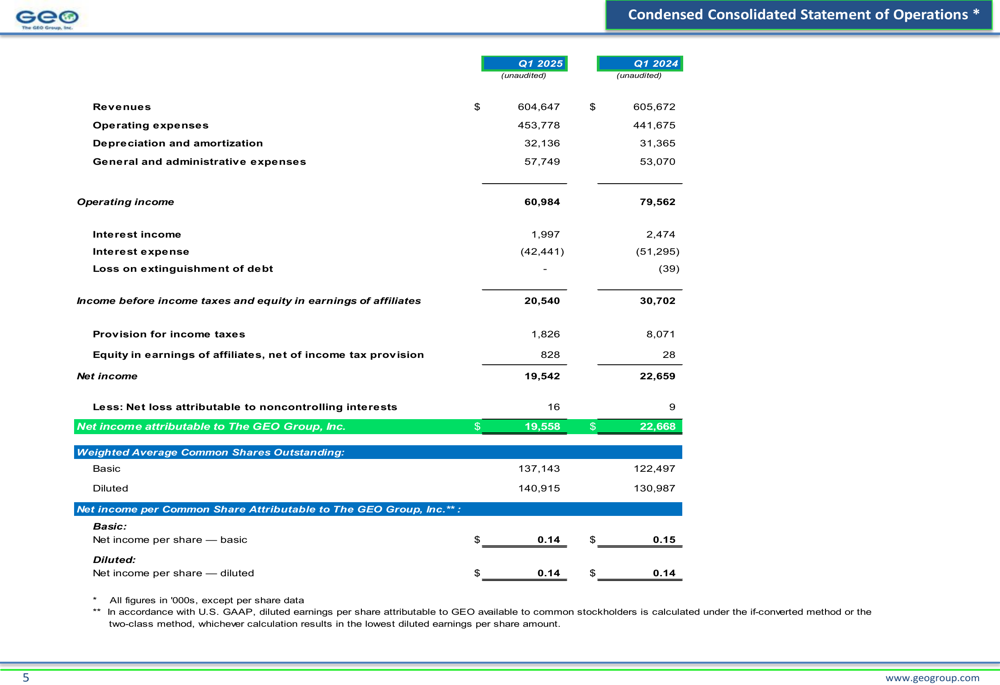
GEO Group reported Q1 2025 revenue of $604.6 million, representing a marginal decrease from $605.7 million in Q1 2024. Net income attributable to GEO declined to $19.6 million from $22.7 million in the prior-year period. This translated to earnings per share of $0.14 for both basic and diluted calculations, compared to $0.15 basic and $0.14 diluted EPS in Q1 2024.
The company’s corporate structure is divided into three main segments: GEO Secure Services, GEO Care, and GEO International Services, with operations spanning 98 facilities and approximately 77,000 beds worldwide.
As shown in the company profile and corporate structure overview:
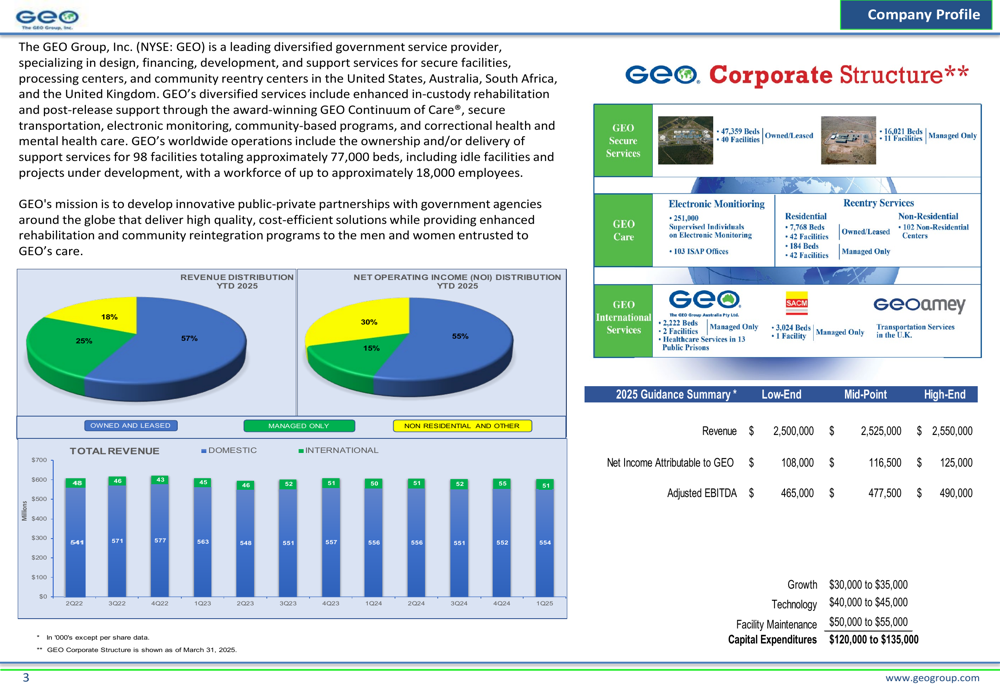
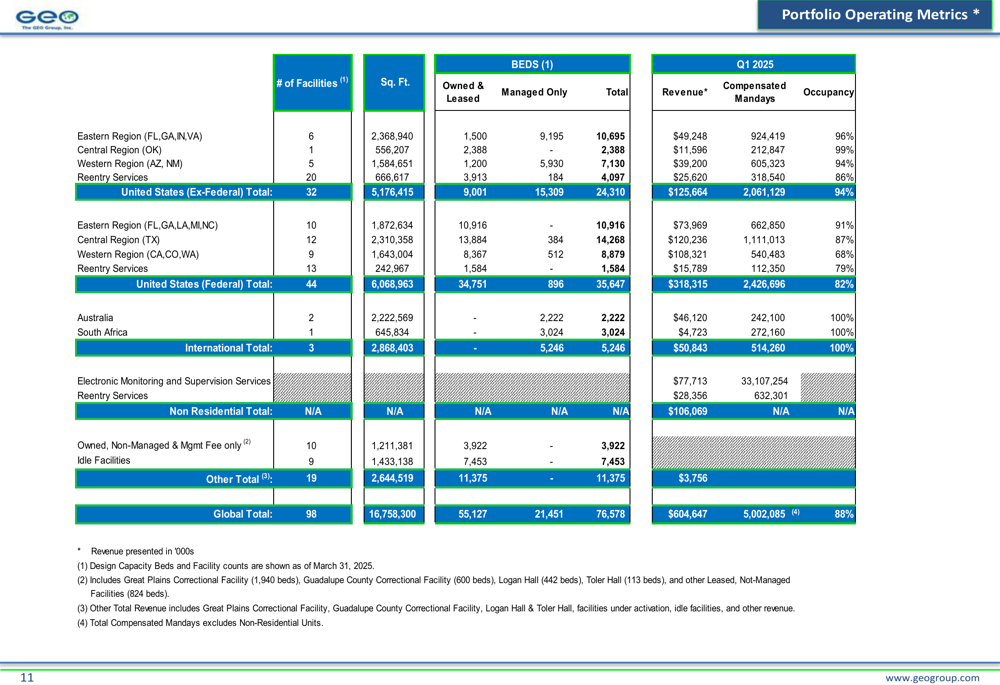
Adjusted EBITDA for Q1 2025 was $99.8 million, down from $117.6 million in Q1 2024, reflecting increased operational costs and investments. The company maintained a solid global occupancy rate of 88%, with particularly strong performance in international operations (100% occupancy) and U.S. non-federal facilities (94% occupancy).
Detailed Financial Analysis
The condensed consolidated statement of operations reveals the pressure on GEO’s profitability, with operating income decreasing to $61.0 million in Q1 2025 from $79.6 million in Q1 2024, primarily due to higher operating expenses.
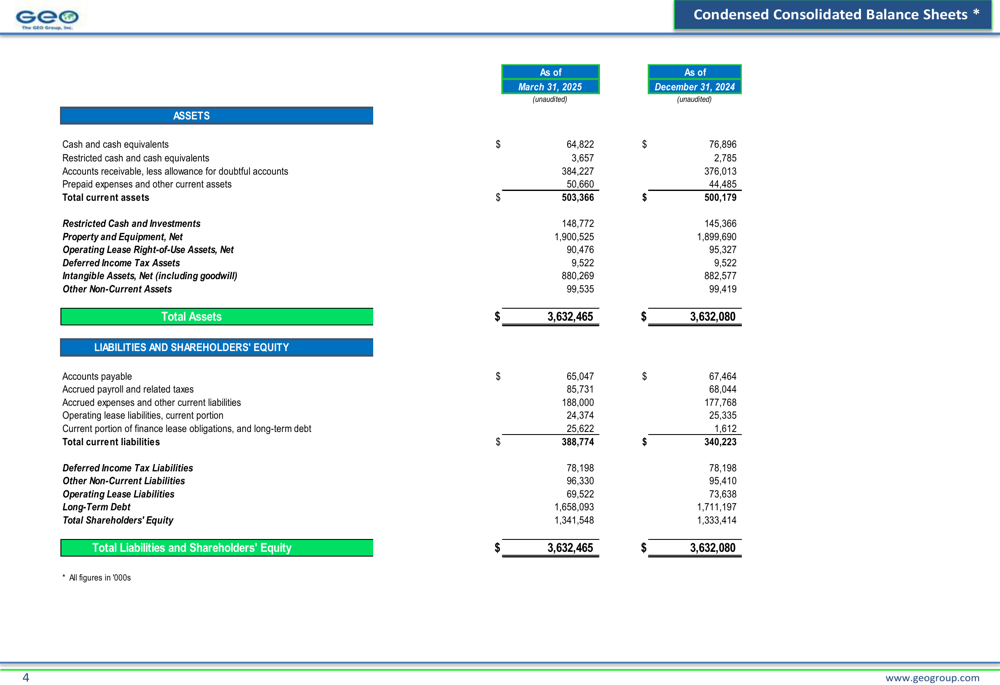
GEO’s balance sheet shows total assets of $3.63 billion as of March 31, 2025, virtually unchanged from December 31, 2024. The company’s long-term debt decreased slightly to $1.66 billion from $1.71 billion at the end of 2024, while total shareholders’ equity increased marginally to $1.34 billion.
Market capitalization has seen remarkable growth, reaching $4.12 billion in Q1 2025 compared to $1.79 billion in Q1 2024, reflecting strong investor confidence despite the earnings pressure. This substantial increase in market value has occurred despite relatively flat revenue performance.
Strategic Initiatives and Outlook
GEO Group’s global operations span across the United States, Australia, and South Africa, with the U.S. representing the vast majority of its footprint. Texas hosts the largest concentration of facilities with 20 locations and 17,875 beds.
The company’s global operations profile illustrates its extensive reach:
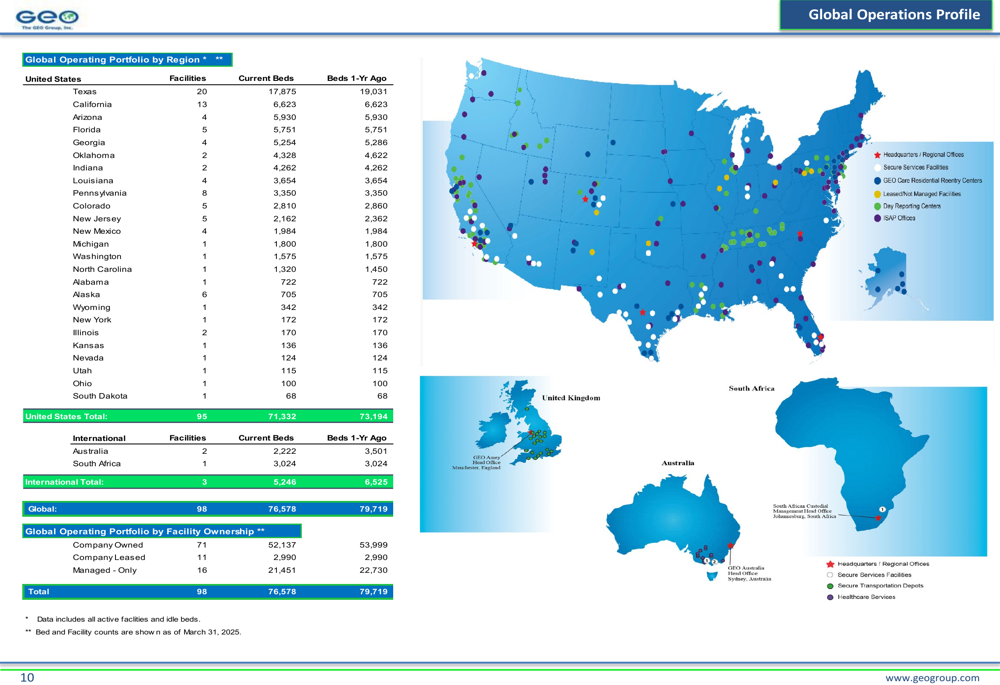
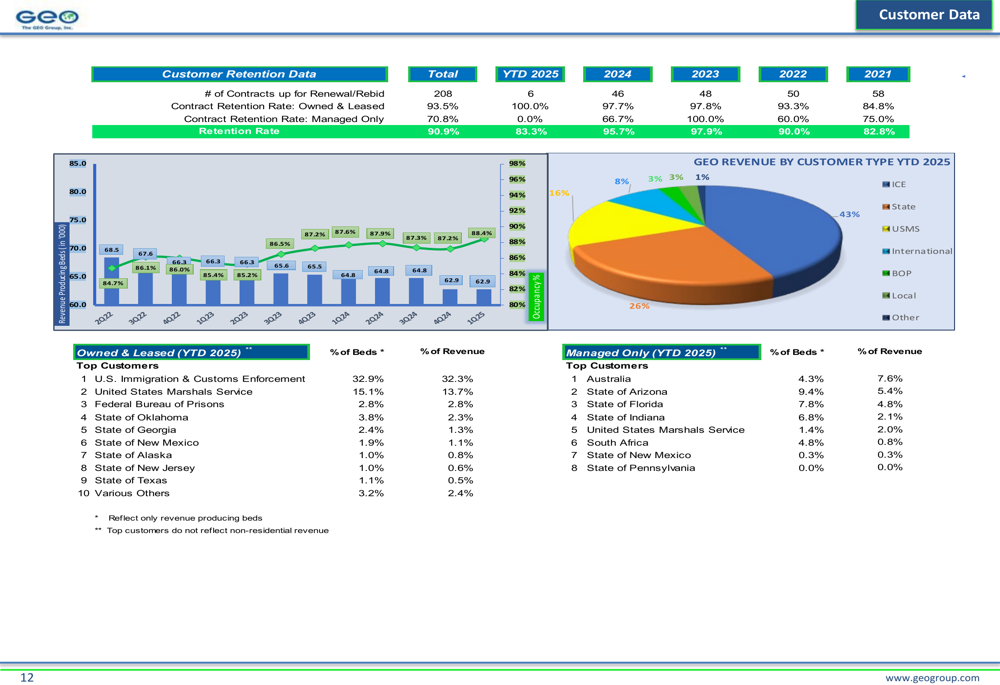
GEO maintains strong customer relationships, with an impressive 90.9% retention rate. U.S. Immigration & Customs Enforcement remains the company’s largest customer, accounting for 32.9% of beds and 32.3% of revenue in the owned and leased segment.
The following customer data highlights this concentration and the company’s diverse client base:
For 2025, GEO has provided guidance projecting revenue between $2.5 billion and $2.55 billion, net income attributable to GEO between $108 million and $125 million, and adjusted EBITDA between $465 million and $490 million. Capital expenditures are expected to range from $120 million to $135 million, with allocations for growth, technology, and facility maintenance.
Debt and Capital Structure
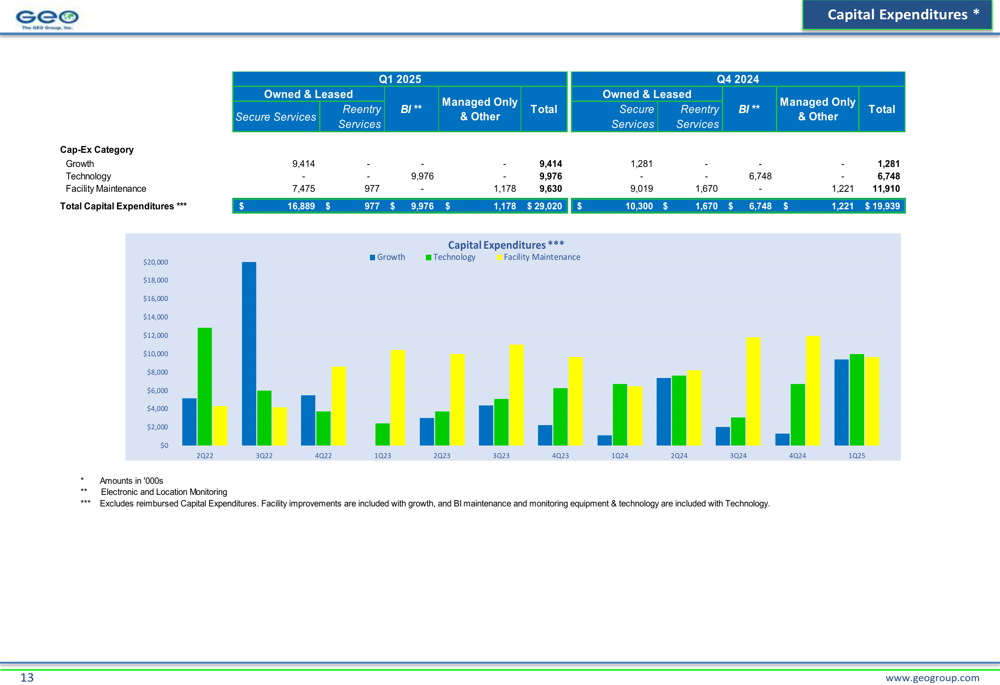
GEO Group’s capital expenditures for Q1 2025 totaled $29.0 million, a significant increase from $19.9 million in Q4 2024. These investments were distributed across growth initiatives ($9.4 million), technology improvements ($10.0 million), and facility maintenance ($9.6 million).
The company’s debt maturity schedule shows a total debt of $1.71 billion, with a mix of floating and fixed-rate obligations. GEO’s debt structure includes $650 million in senior secured notes due in 2029, a revolving credit facility with $80 million outstanding (out of $310 million capacity), and a term loan with $320.8 million outstanding.
Recent corporate activities include the acquisition of Tampa Residential Reentry Center for $1.2 million and Correct Care Australasia for $3.9 million, as well as the disposition of Talbot Hall for $13.9 million, indicating the company’s ongoing portfolio optimization efforts.
GEO’s portfolio operating metrics show strong performance across regions, with particularly robust occupancy rates in international operations:
Despite the quarterly earnings pressure, GEO Group’s substantial year-over-year stock price appreciation suggests investors remain optimistic about the company’s long-term prospects, particularly given its strong market position in government-contracted secure facilities and community reentry services.
Full presentation:
This article was generated with the support of AI and reviewed by an editor. For more information see our T&C.