Fed Governor Adriana Kugler to resign

Introduction & Market Context
Great Elm Capital Corp (NASDAQ:GECC) released its Q1 2025 investor presentation on May 6, 2025, highlighting record investment income and strong performance across key metrics. The business development company (BDC), which offers a substantial dividend yield of 14.7%, reported significant quarter-over-quarter growth in both total investment income and net investment income, rebounding strongly from its disappointing Q4 2024 results.
The company’s stock closed at $10.09 on May 2, 2025, according to the presentation, trading at a discount to its net asset value of $11.46 per share. This represents a continuation of the valuation gap that has persisted for the BDC, despite its attractive dividend yield and improved operational performance.
Quarterly Performance Highlights
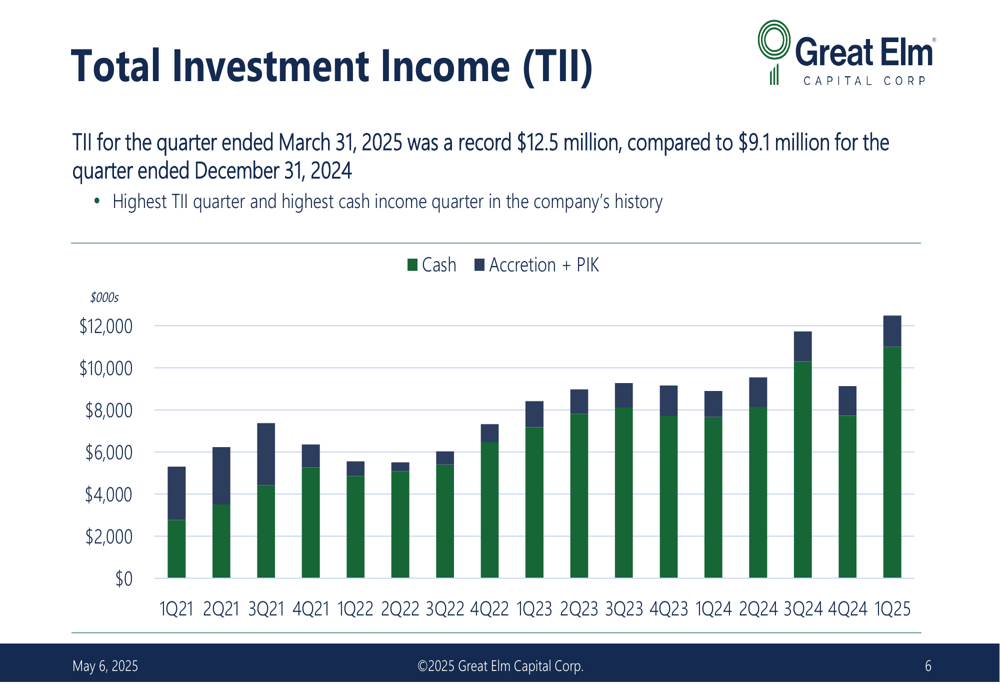
GECC reported total investment income (TII) of $12.5 million for Q1 2025, a substantial 36.7% increase from $9.1 million in Q4 2024. This marked the highest TII and cash income generation in the company’s history, demonstrating a strong recovery from the previous quarter’s underperformance.
As shown in the following chart of quarterly total investment income growth:
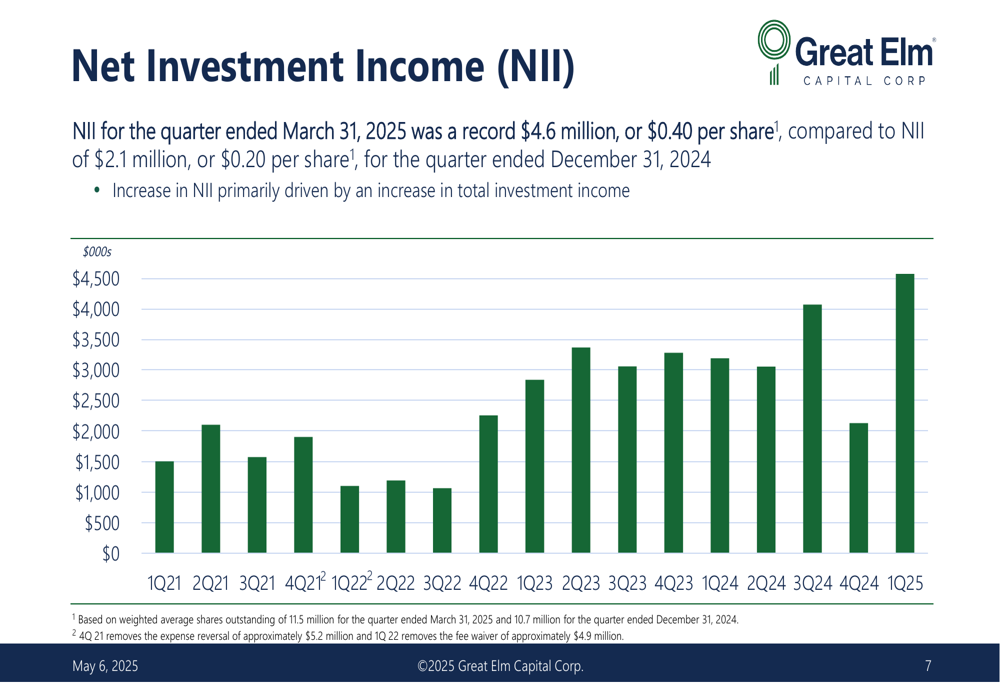
Net investment income (NII) also showed remarkable improvement, reaching $4.6 million ($0.40 per share) in Q1 2025, more than doubling from $2.1 million ($0.20 per share) in Q4 2024. The company attributed this growth primarily to increased CLO joint venture distributions and income from new investments.
The quarterly NII trend is illustrated in this chart:
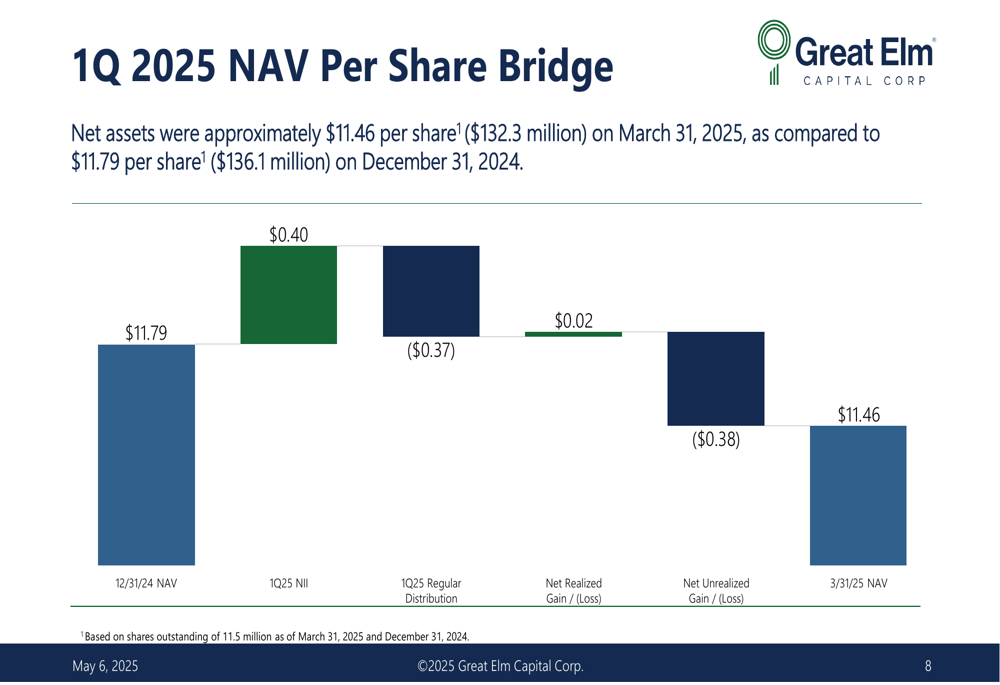
Despite the strong income performance, GECC’s net asset value (NAV) declined slightly to $132.3 million ($11.46 per share) as of March 31, 2025, compared to $136.1 million ($11.79 per share) at the end of December 2024. This decrease was primarily due to unrealized losses in the portfolio, which offset the strong investment income.
The following NAV bridge illustrates the components affecting the quarter’s NAV change:
GECC declared a quarterly distribution of $0.37 per share for Q2 2025, payable on June 30, 2025, to shareholders of record as of June 16, 2025. This distribution represents a 14.7% annualized yield based on the May 2, 2025 closing price of $10.09.
Portfolio Composition and Strategy
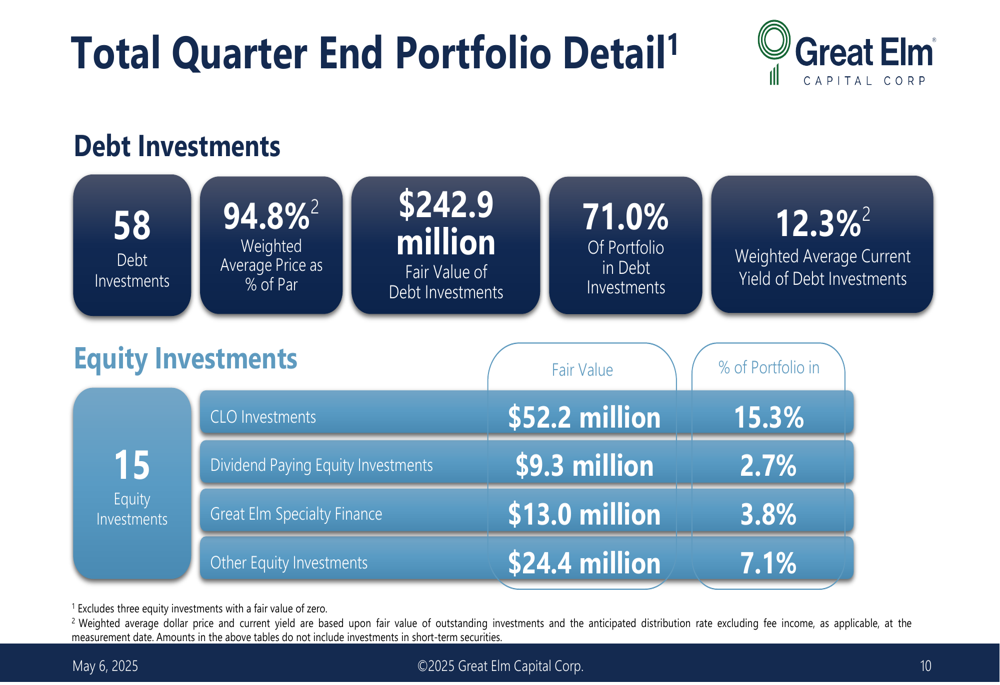
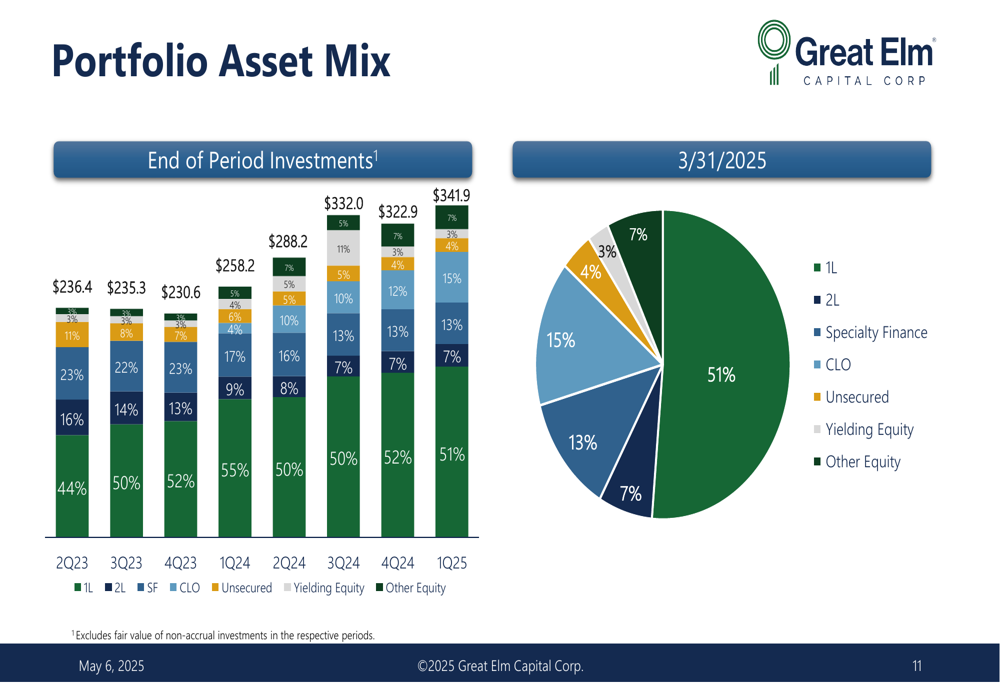
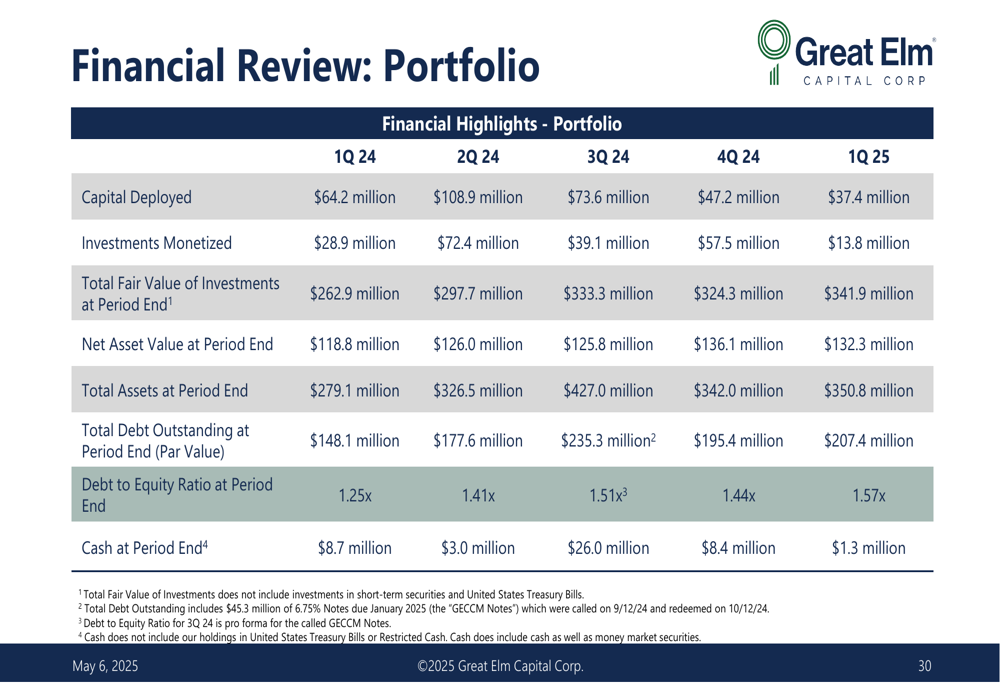
As of March 31, 2025, GECC’s investment portfolio had a fair value of $341.9 million, consisting of 76 investments (58 debt, 18 equity) across 56 companies in 28 industries. The weighted average current yield on debt investments was 12.3%.
The detailed portfolio composition is shown below:
The company’s portfolio asset mix has evolved over recent quarters, with a continued focus on first lien loans (51% of the portfolio) and increasing allocation to CLO investments (13%). The portfolio’s asset mix over time is illustrated in this chart:
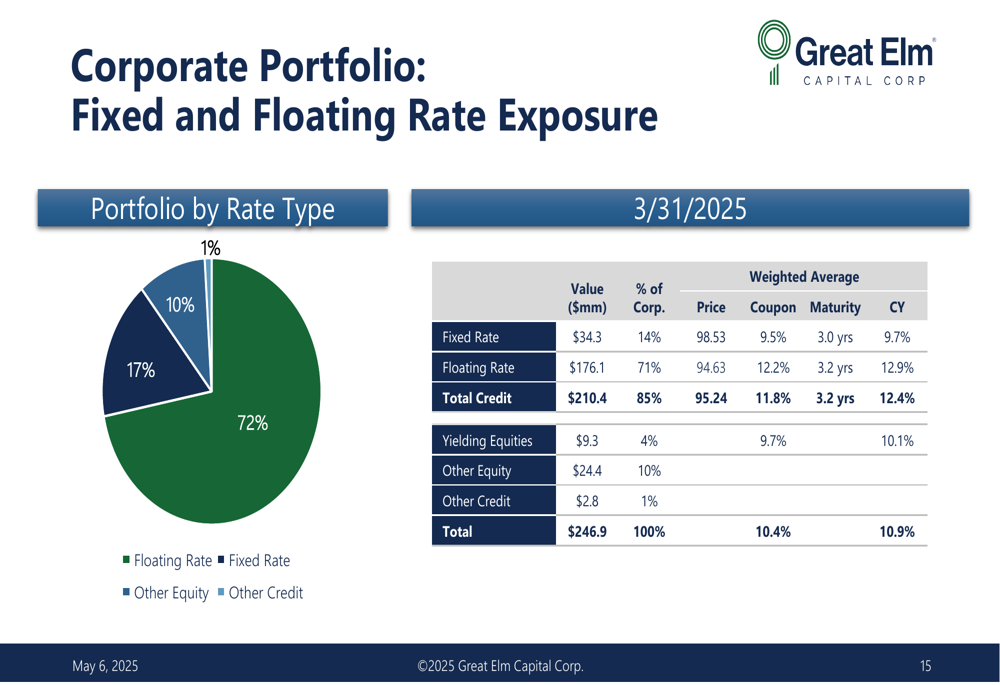
Within the corporate portfolio, GECC has maintained a strategic emphasis on floating rate exposure (72%) to position advantageously in the current interest rate environment. The fixed and floating rate exposure breakdown is shown here:
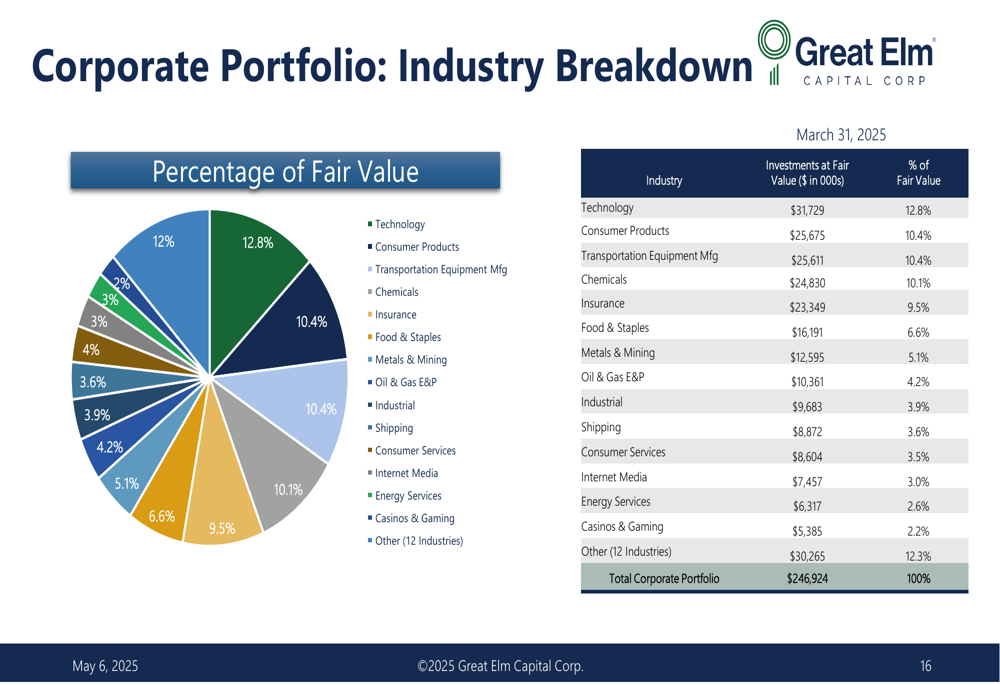
The corporate portfolio remains well-diversified across industries, with technology (12.8%), consumer products (10.4%), transportation equipment manufacturing (10.4%), and chemicals (10.1%) representing the largest exposures:
CLO Joint Venture Performance
A key strategic initiative for GECC is its CLO Joint Venture (CLO JV), in which the company holds a 71.25% interest. Through March 31, 2025, GECC had deployed approximately $48 million into the CLO JV, which holds majority equity positions in two CLOs and one CLO warehouse.
The CLO JV provides GECC with exposure to a diversified pool of floating rate loans, with the underlying portfolio consisting primarily of first lien loans (96%). Both CLOs comprise over 350 assets each, providing broad exposure to the broadly syndicated loan (BSL) asset class, with issuer overlap between the two CLOs at 59.6%.
The top 10 issuers in the CLO portfolio represent 10.8% of the combined CLOs, with no single issuer representing more than 1.1% of the portfolio, highlighting the diversified nature of these investments.
Specialty Finance Initiatives
Great Elm Specialty Finance (GESF), a subsidiary of GECC, oversees the company’s specialty finance investments and future acquisitions, strategic partnerships, and direct origination opportunities. The GESF platform operates across the "continuum of lending," including inventory/purchase order financing, factoring, asset-based lending, leveraged loans, real estate lending, bridge lending, and equipment lending.
Key components of the GESF platform include:
1. Prestige Capital - A provider of "spot factoring" services, allowing clients to sell individual accounts receivable for upfront payments
2. Great Elm Commercial Finance - Offers asset-based loans to small and middle market companies throughout the United States
3. Great Elm Healthcare Finance - Recently repositioned in Q1 2025 to hold healthcare-related real estate assets
Financial Analysis and Outlook
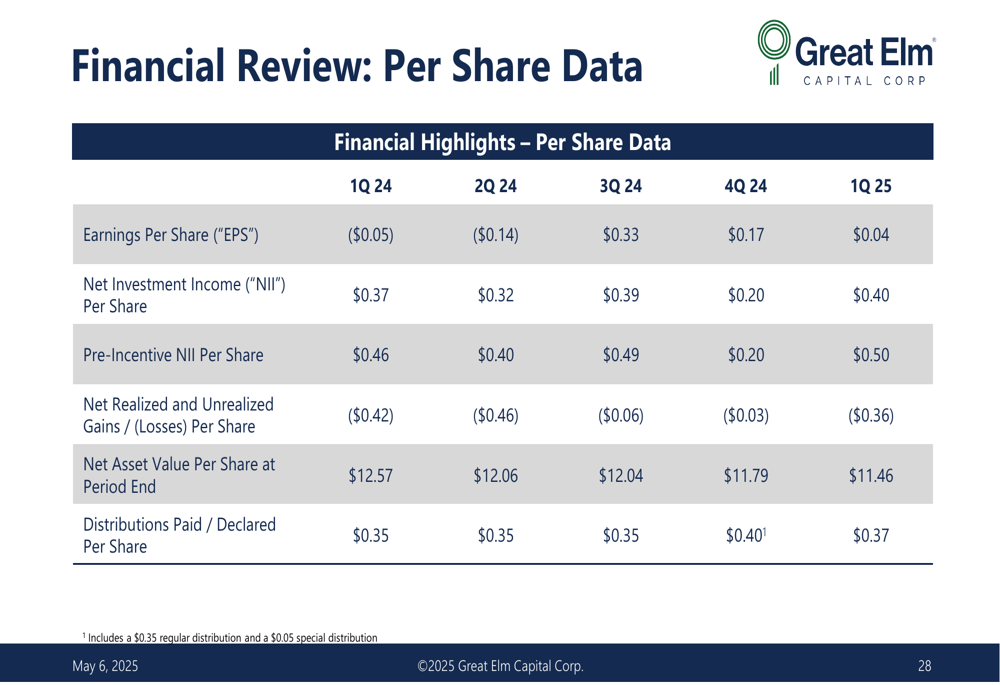
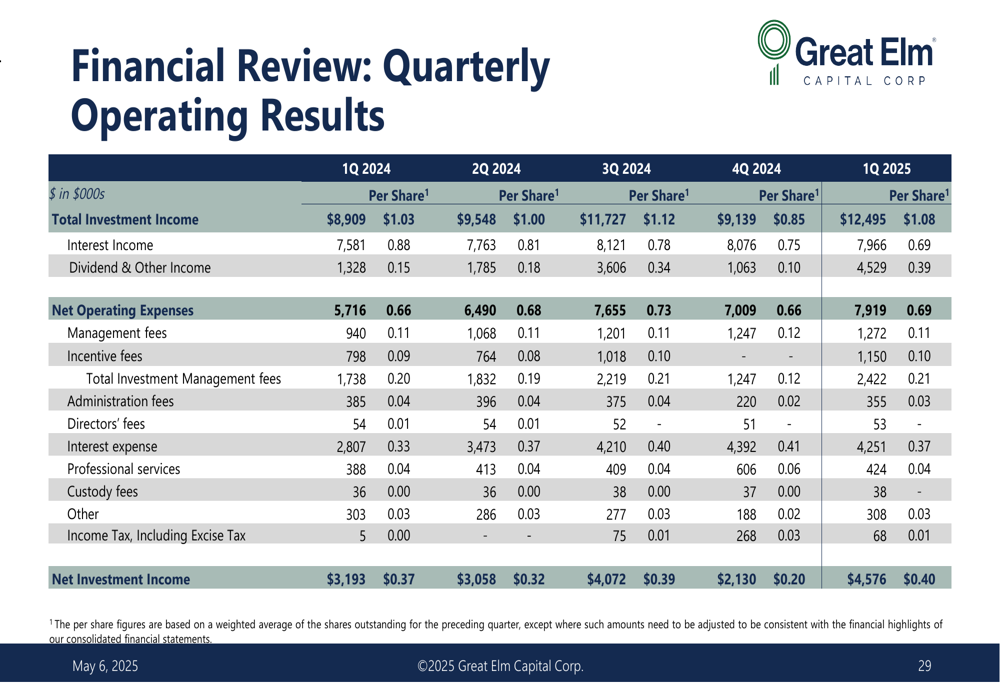
GECC’s financial performance over the past five quarters shows a generally positive trajectory, with Q1 2025 representing a significant improvement over previous periods. The following table provides a comprehensive view of the company’s per share financial metrics:
The quarterly operating results further illustrate the company’s strong performance in Q1 2025:
Looking at broader portfolio metrics, GECC deployed $37.4 million in new investments during Q1 2025 while monetizing $13.8 million. The company’s debt-to-equity ratio increased slightly to 1.57x from 1.44x in the previous quarter, reflecting increased leverage to enhance returns.
While GECC’s Q1 2025 performance represents a significant improvement from the disappointing Q4 2024 results, investors should note the slight decline in NAV per share and the increasing leverage. The company’s focus on CLO investments and specialty finance appears to be driving income growth, but unrealized losses in the portfolio remain a concern.
The 14.7% dividend yield remains attractive in the current market environment, and the company’s ability to more than cover its distribution with net investment income in Q1 2025 ($0.40 NII vs. $0.37 distribution) provides some reassurance regarding dividend sustainability. However, investors should monitor the company’s ability to maintain this performance in future quarters, particularly given the volatile macroeconomic environment and potential interest rate changes.
Full presentation:
This article was generated with the support of AI and reviewed by an editor. For more information see our T&C.