TSX runs higher on rate cut expectations

Great Elm Capital Corp (NASDAQ:GECC) reported record-breaking financial performance in its second quarter 2025 earnings presentation released on August 5, 2025. The business development company achieved its highest-ever total investment income while growing its net asset value significantly.
Quarterly Performance Highlights
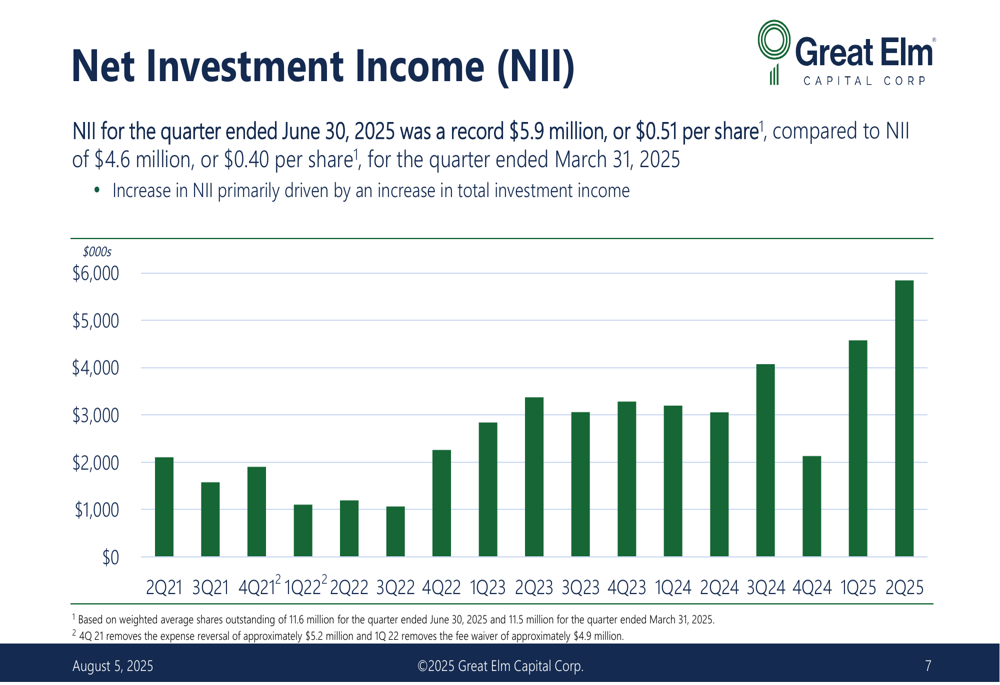
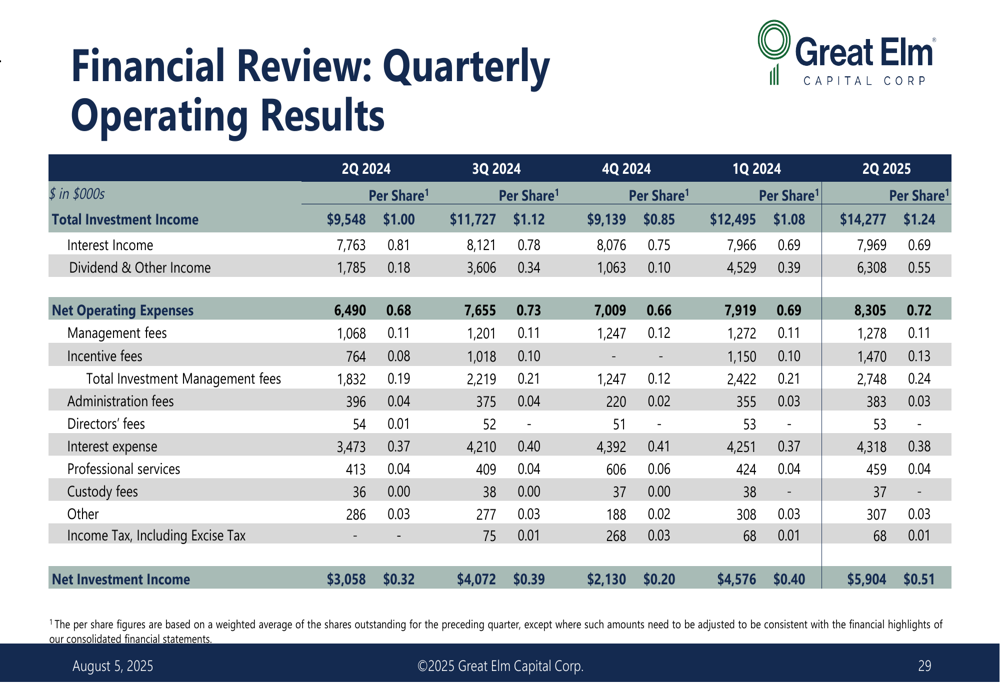
GECC reported total investment income (TII) of $14.3 million for Q2 2025, representing a 14.3% increase from $12.5 million in Q1 2025. This marks the highest TII in the company’s history. Net investment income (NII) reached $5.9 million ($0.51 per share), up from $4.6 million ($0.40 per share) in the previous quarter.
As shown in the following chart of quarterly net investment income, GECC has demonstrated a positive trajectory in 2025 after a dip in Q4 2024:
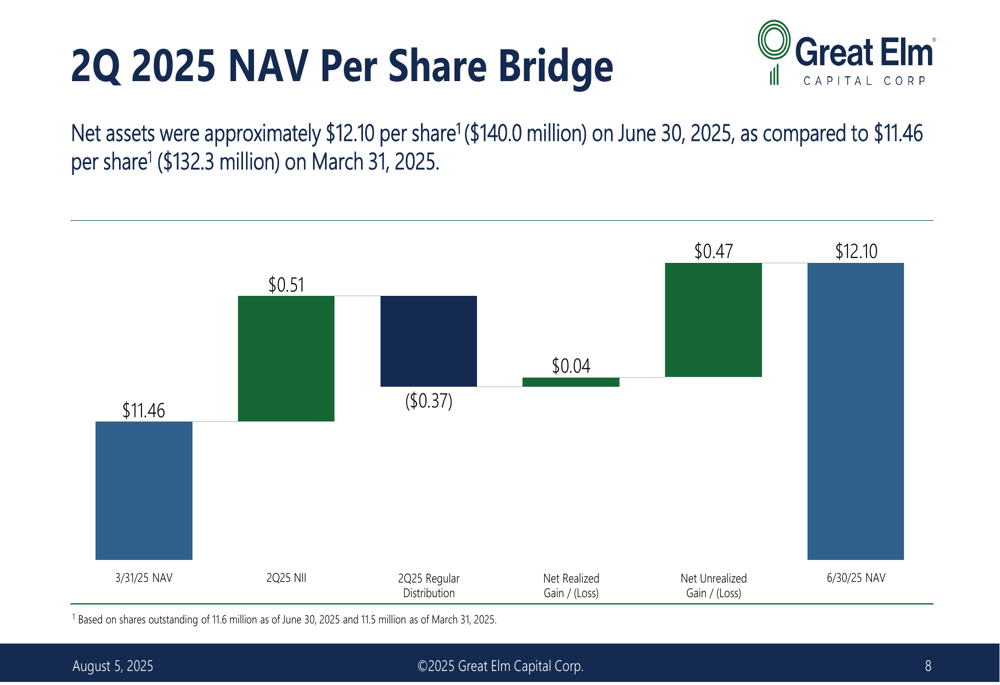
The company’s net asset value (NAV) increased to $140.0 million ($12.10 per share) as of June 30, 2025, compared to $132.3 million ($11.46 per share) at the end of Q1 2025. This 5.6% increase in NAV per share was primarily driven by unrealized gains on CoreWeave-related investments and NII exceeding the quarterly distribution by 38%.
The following bridge analysis illustrates the components contributing to the NAV increase during Q2 2025:
GECC’s Board of Directors approved a quarterly distribution of $0.37 per share for Q3 2025, equating to a 13.5% annualized yield based on the August 1, 2025 closing price of $10.98. The distribution will be payable on September 30, 2025, to stockholders of record as of September 15, 2025.
Portfolio Composition and Strategy
As of June 30, 2025, GECC’s portfolio had a fair value of $335.1 million, comprising 74 investments (56 debt, 18 equity) across 53 companies in 26 industries. The debt investments carry a weighted average current yield of 12.5%.
The portfolio’s asset mix reflects GECC’s diversified investment approach, as shown in the following chart:
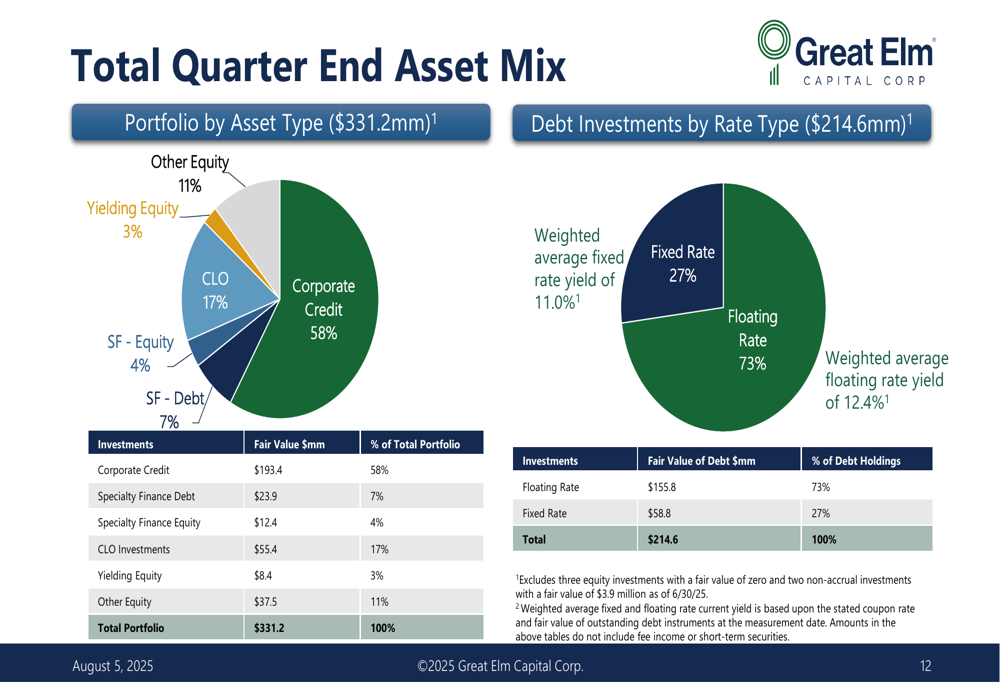
The corporate portfolio remains well-diversified across industries, with technology representing the largest sector at 18.4%, followed by consumer products (11.4%) and chemicals (11.3%). The portfolio maintains a balanced approach to interest rate exposure, with 66% in floating rate investments and 17% in fixed rate investments.
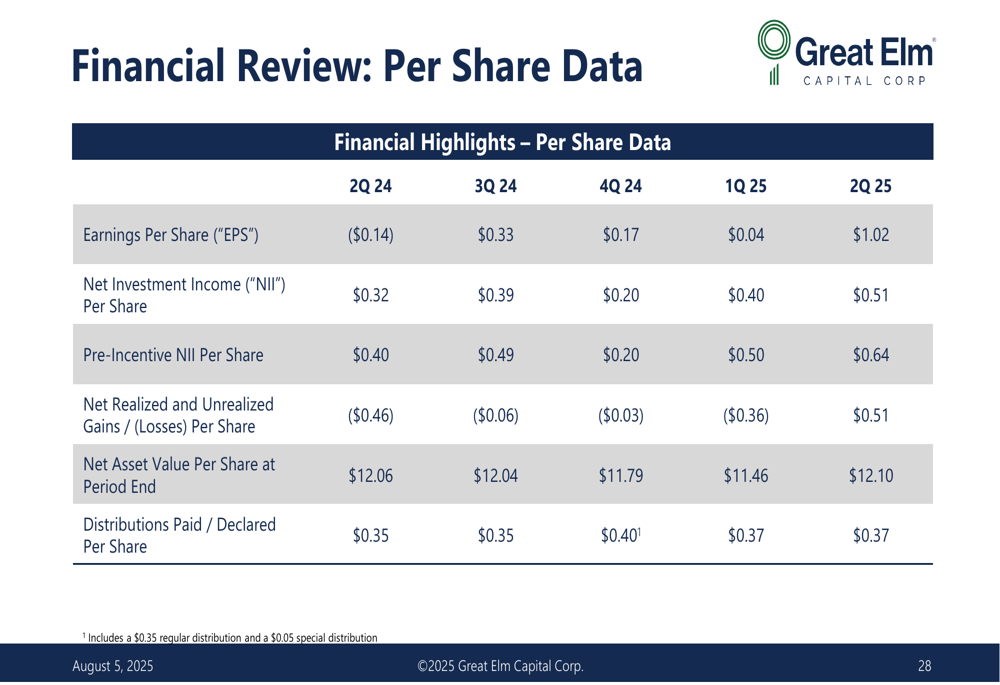
GECC’s financial performance metrics have shown consistent improvement over the past five quarters, as illustrated in the following table:
CLO Platform Performance
A significant contributor to GECC’s strong performance has been its CLO (Collateralized Loan Obligation) platform. The company has deployed $53.2 million into its CLO joint venture through June 30, 2025, and an additional $6.2 million in a direct CLO equity position.
As detailed in the following CLO platform update, GECC has received approximately $11.8 million in distributions from the CLO joint venture since its inception in April 2024, generating an impressive 18.2% IRR on its capital contributions:
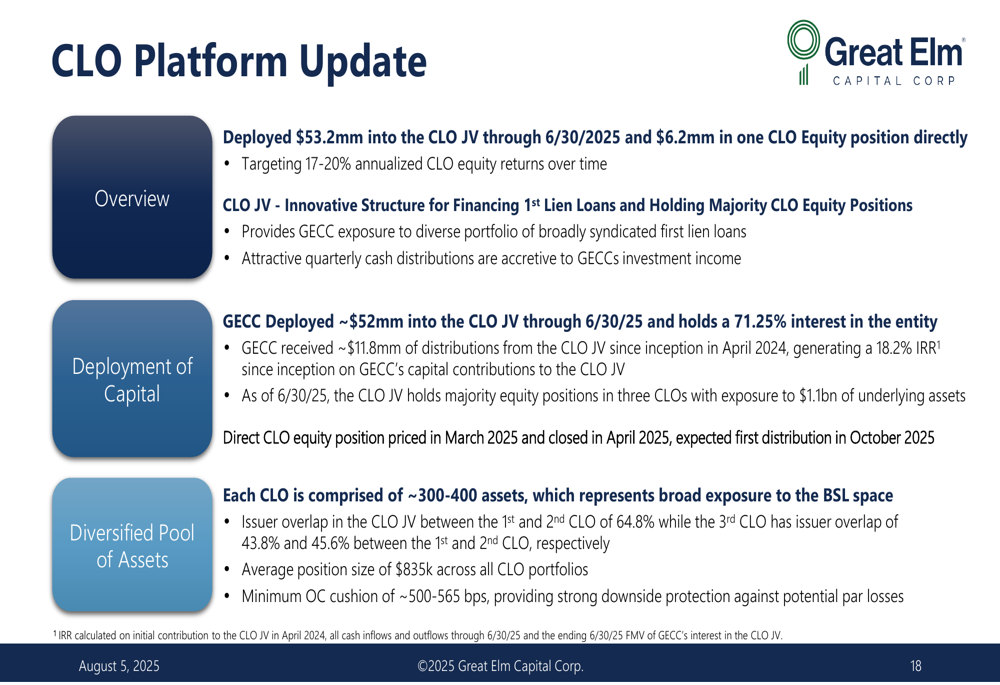
The CLO investments provide GECC with exposure to a diverse portfolio of broadly syndicated first lien loans. Each CLO comprises approximately 300-400 assets, with the underlying portfolios primarily consisting of A-rated (73.1%) and BBB-rated (20.8%) securities.
Specialty Finance Initiatives
GECC continues to expand its specialty finance platform, which provides uncorrelated investment opportunities across various lending categories. The company’s Great Elm Specialty Finance (GESF) subsidiary oversees investments in invoice finance, asset-based lending, and healthcare finance.
The following overview illustrates GESF’s strategic approach across the "Continuum of Lending":
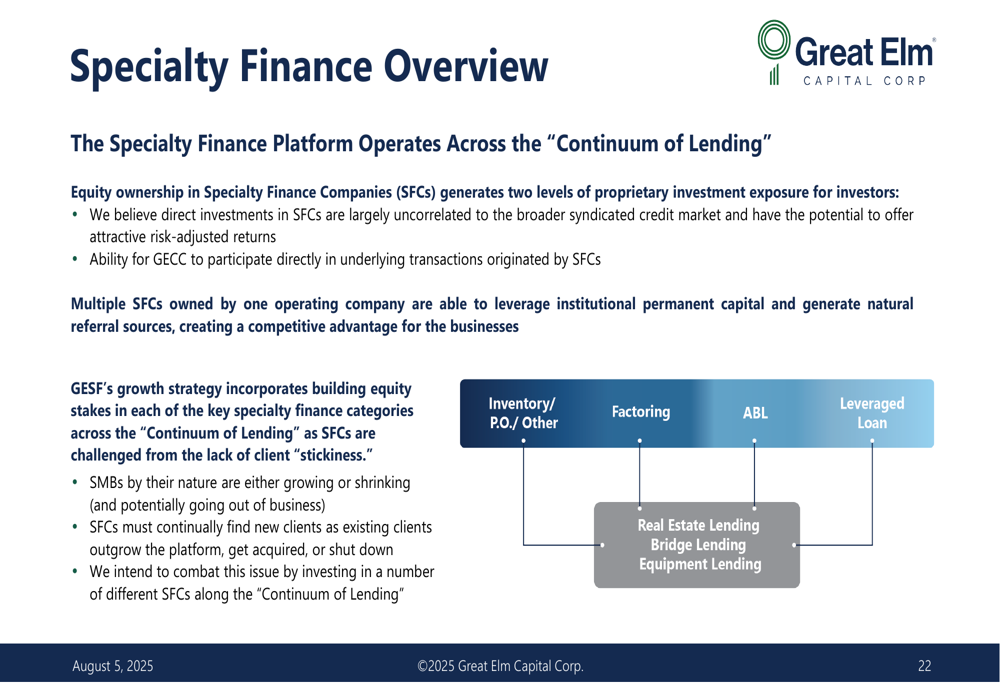
GESF’s portfolio includes Prestige Capital, a provider of "spot factoring" services with over 30 years of experience and $6+ billion in factored transactions; Great Elm Commercial Finance, which offers asset-based loans to small and middle-market companies; and Great Elm Healthcare Finance, which was repositioned in Q1 2025 to focus on healthcare-related real estate assets.
Financial Outlook and Market Position
GECC’s quarterly operating results demonstrate consistent improvement in total investment income and net investment income per share over the past year:
The company’s portfolio metrics show a strategic shift toward quality over quantity in capital deployment, with $22.6 million deployed in Q2 2025 compared to $108.9 million in Q2 2024. Meanwhile, the total fair value of investments has increased to $335.1 million from $297.7 million year-over-year.
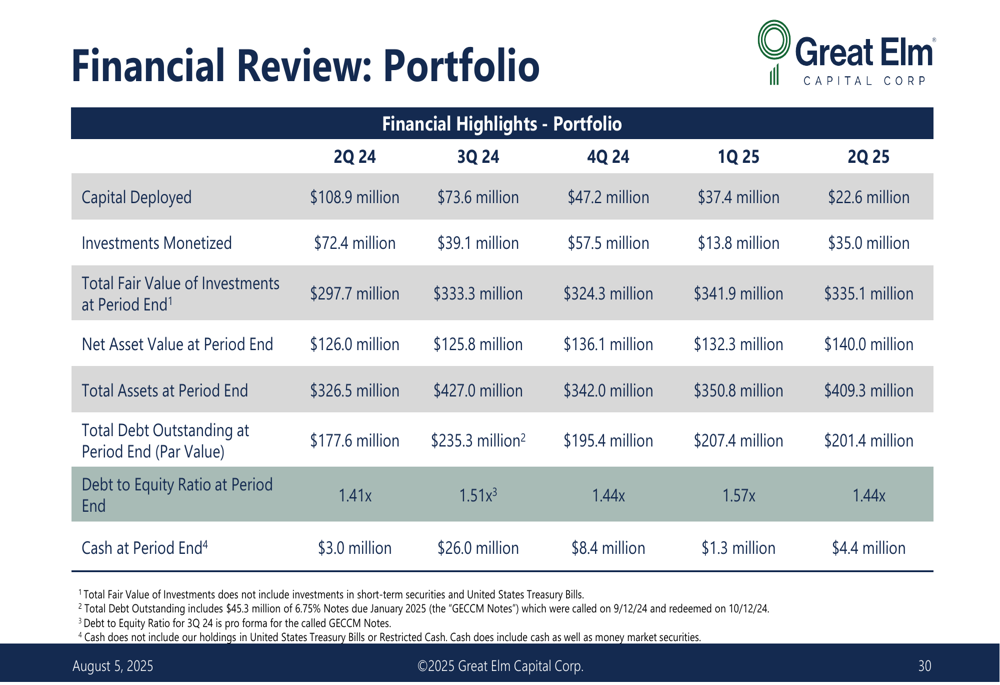
GECC’s stock closed at $10.98 on August 1, 2025, representing a discount to its NAV of $12.10 per share. The company’s debt-to-equity ratio stood at 1.44x as of June 30, 2025, down from 1.57x at the end of Q1 2025, indicating improved balance sheet strength.
These Q2 2025 results align with the company’s earlier guidance from Q1, which anticipated that Q2 net investment income would exceed Q1 levels. The record-setting performance in Q2 positions GECC to continue covering its dividend throughout 2025 while maintaining its strategic focus on specialty finance and CLO investments.
Full presentation:
This article was generated with the support of AI and reviewed by an editor. For more information see our T&C.