Microvast Holdings announces departure of chief financial officer

Introduction & Market Context
Hayward Holdings Inc (NYSE:HAYW), a leading manufacturer of pool equipment, reported solid first-quarter 2025 results on May 1, 2025, with revenue growth of 8% year-over-year despite facing significant tariff headwinds. The company, which recently celebrated its 100th anniversary, continues to leverage its strong position in the pool equipment market while implementing comprehensive strategies to address macroeconomic challenges.
Following a strong Q4 2024 performance where the company exceeded earnings expectations with an EPS of $0.27 against a forecast of $0.23, Hayward has maintained positive momentum into the first quarter of 2025. The company’s stock closed at $13.33 on April 30, 2025, up 0.6% for the day, and has been trading between a 52-week range of $11.10 to $16.87.
Quarterly Performance Highlights
Hayward’s Q1 2025 results exceeded expectations across key financial metrics. Net sales increased 8% year-over-year to $228.8 million, driven by a combination of price increases, volume growth, and acquisition contributions.
As shown in the following financial overview from the presentation:
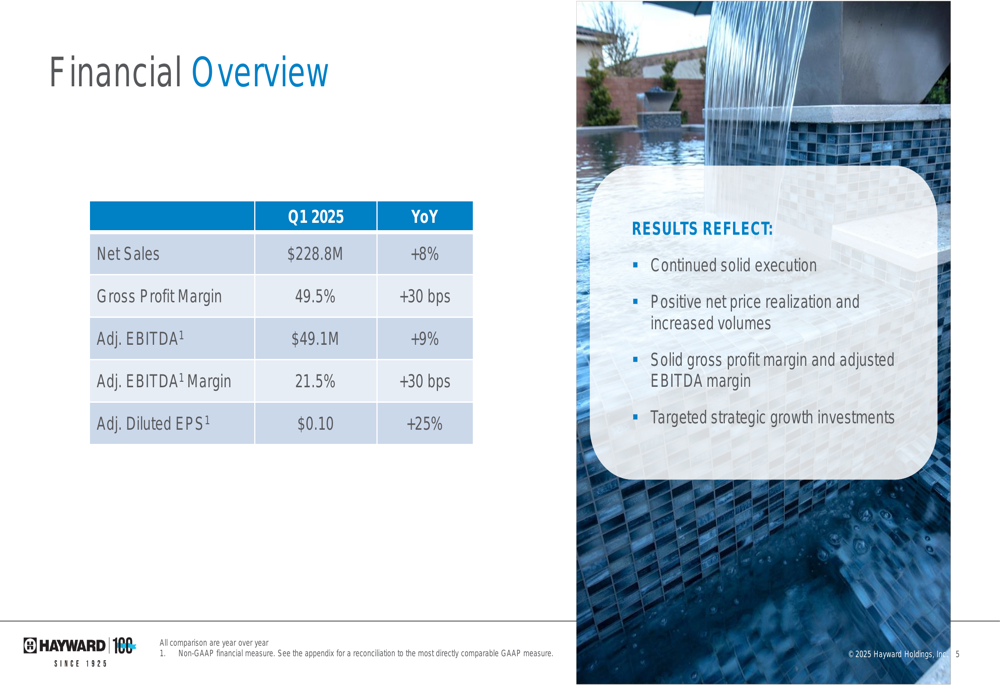
The company achieved a gross profit margin of 49.5%, representing a 30 basis point improvement year-over-year. Adjusted EBITDA grew 9% to $49.1 million, with the adjusted EBITDA margin expanding by 30 basis points to 21.5%. Adjusted diluted EPS increased by 25% to $0.10 per share.
A more detailed breakdown of the financial performance reveals the various drivers behind these results:
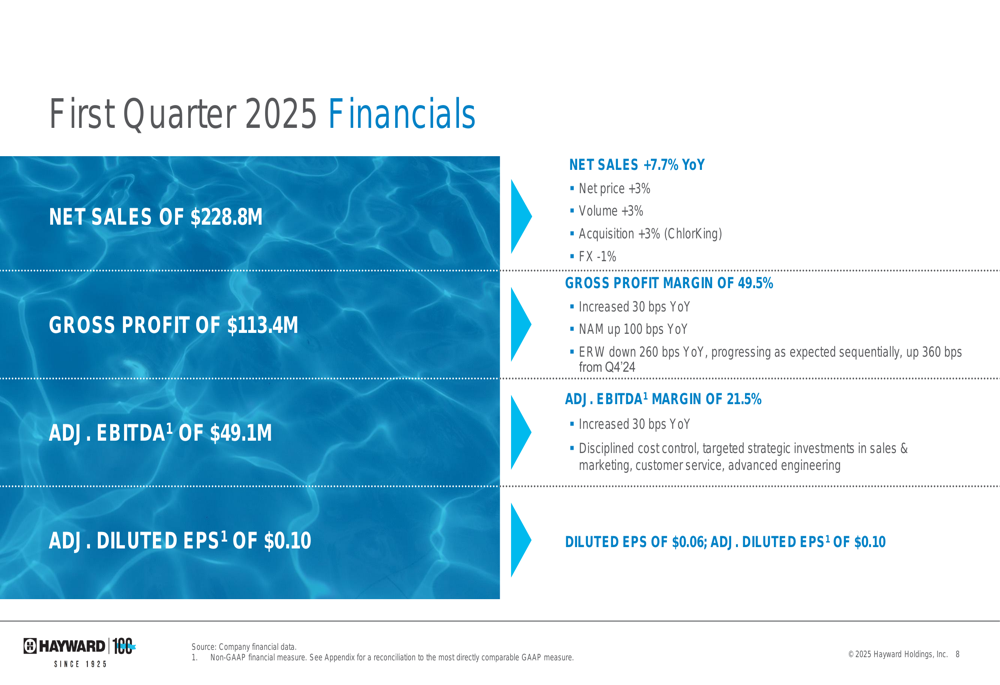
The 7.7% net sales growth was attributed to a 3% contribution from pricing, 3% from volume, and 3% from the ChlorKing acquisition, partially offset by a 1% negative impact from foreign exchange. The gross profit margin improvement was primarily driven by the North American segment, which saw a 100 basis point increase.
Segment Performance
Hayward’s performance varied across its geographic segments, with North America showing particularly strong results:
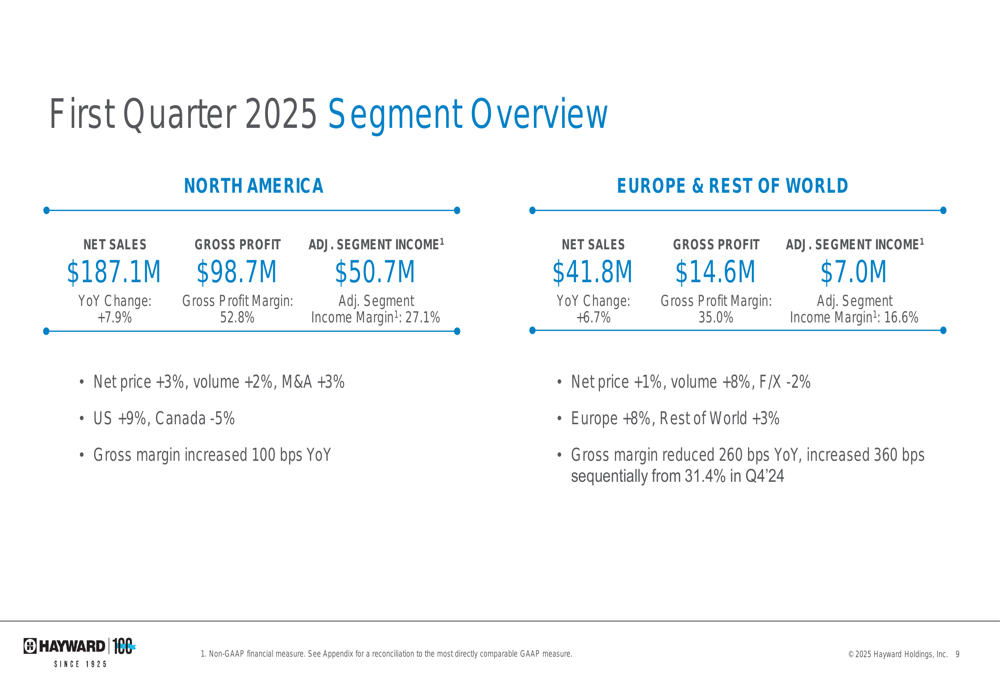
The North American segment, which accounts for approximately 82% of total sales, grew by 7.9% year-over-year to $187.1 million. This growth was driven by a 3% contribution from pricing, 2% from volume, and 3% from acquisitions. The U.S. market performed exceptionally well with 9% growth, while Canada experienced a 5% decline. Gross profit margin in North America expanded by 100 basis points to 52.8%.
The Europe & Rest of World segment grew by 6.7% to $41.8 million, with volume contributing 8% growth, pricing adding 1%, and foreign exchange creating a 2% headwind. While the gross margin in this segment declined by 260 basis points year-over-year to 35.0%, it showed significant sequential improvement, increasing by 360 basis points from 31.4% in Q4 2024.
Tariff Impact and Mitigation Strategy
A significant challenge facing Hayward is the impact of tariffs, particularly on products sourced from China. The company provided a comprehensive overview of the expected impact and its mitigation strategies:
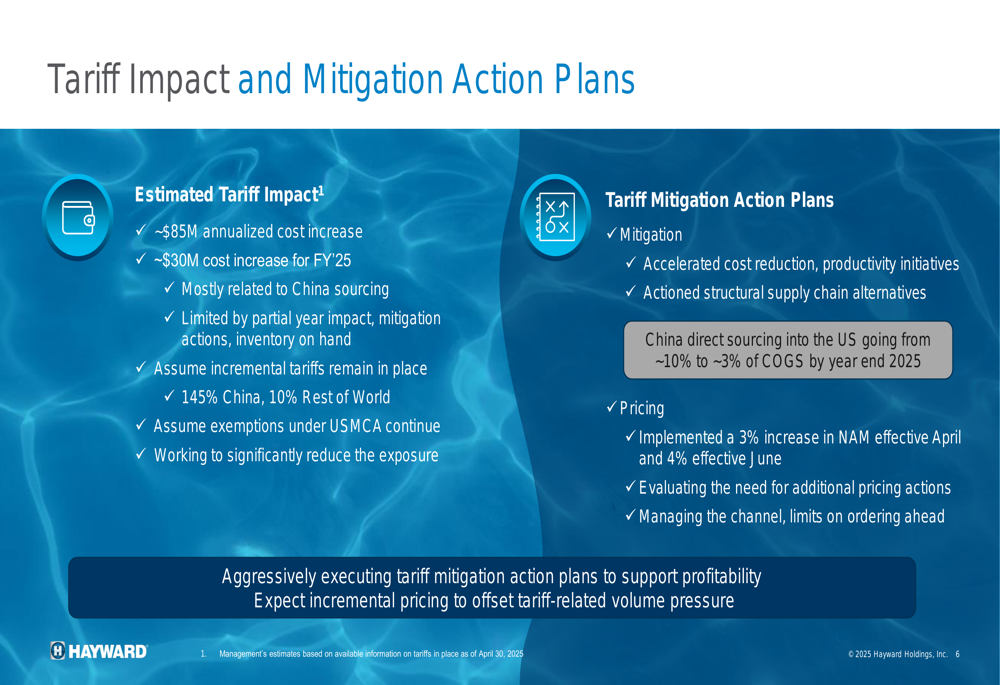
The estimated annualized cost increase from tariffs is approximately $85 million, with about $30 million expected to impact fiscal year 2025. The company is implementing a multi-faceted approach to address these challenges, including accelerated cost reduction initiatives, structural supply chain alternatives, and pricing actions.
Notably, Hayward plans to reduce its China direct sourcing into the U.S. from approximately 10% to 3% of cost of goods sold by the end of 2025. The company has already implemented a 3% price increase in North America effective April 2025, with an additional 4% increase planned for June 2025.
Strategic Initiatives
A key highlight of Hayward’s presentation was the launch of OmniX, an innovative wireless solution designed to automate existing installed pool equipment:
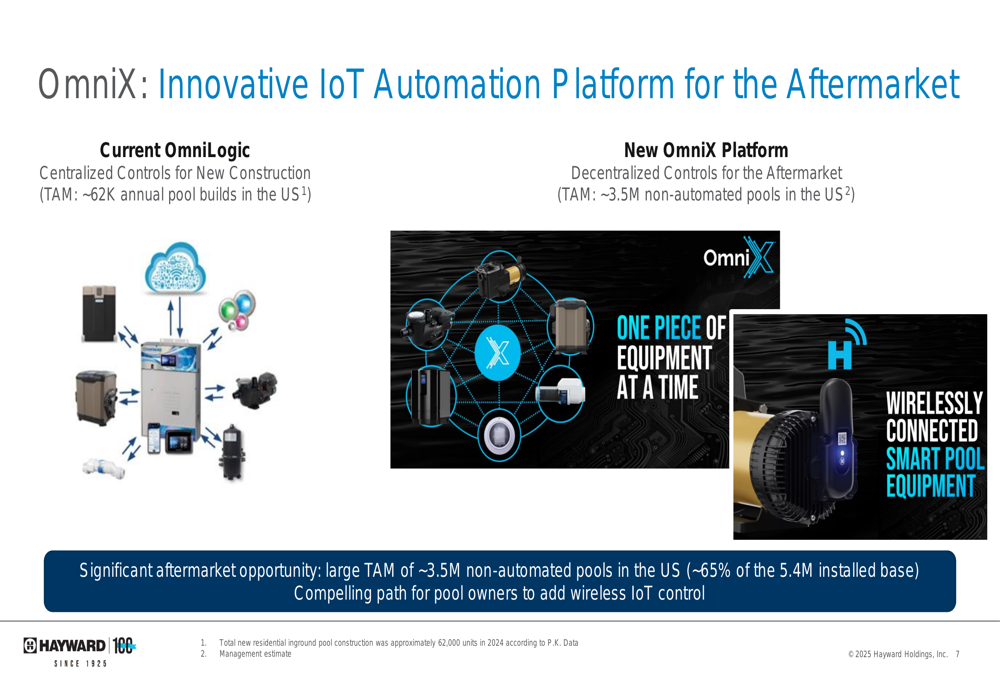
The OmniX platform represents a significant strategic move into the aftermarket segment, targeting approximately 3.5 million non-automated pools in the U.S., which account for about 65% of the 5.4 million installed base. This contrasts with the company’s current OmniLogic system, which primarily serves the new construction market with a total addressable market (TAM) of only about 62,000 annual pool builds in the U.S.
This initiative aligns with Hayward’s position as a technology leader in the pool industry, with the company noting that 94% of its smart pool products have the Omni app attached.
Financial Position and Capital Allocation
Hayward’s balance sheet shows a solid financial position with improving leverage metrics:
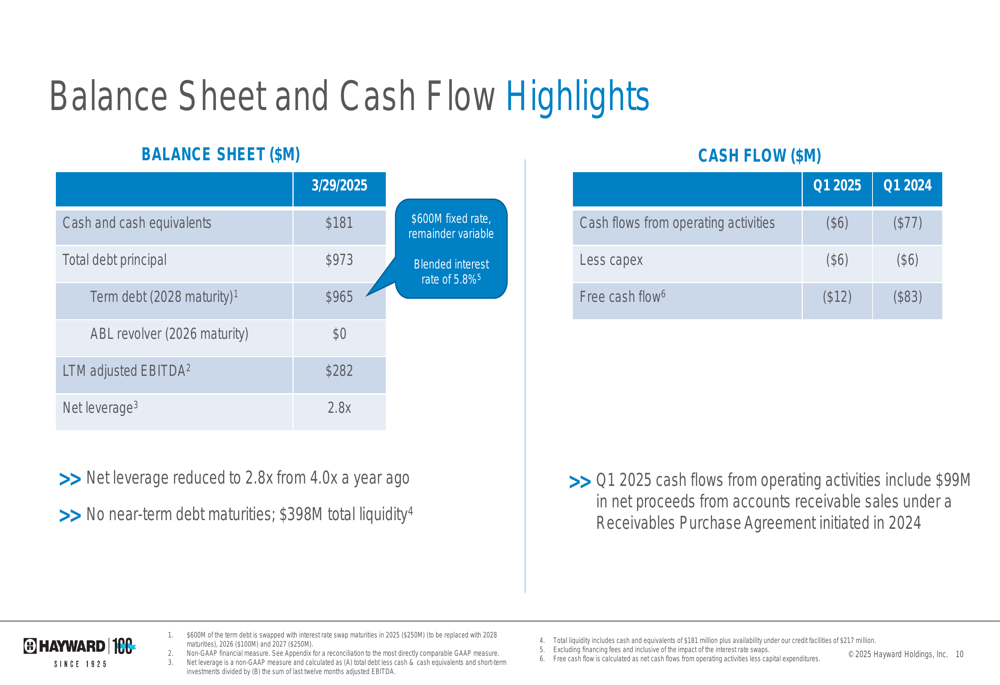
The company reported $181 million in cash and cash equivalents, with total debt principal of $973 million. Net leverage has been reduced to 2.8x from 4.0x a year ago, bringing it within the company’s target range despite being in a seasonally low cash collection period.
Cash flow from operating activities in Q1 2025 was negative $6 million compared to negative $77 million in Q1 2024, with the improvement partially attributed to $99 million in net proceeds from accounts receivable sales under a Receivables Purchase Agreement initiated in 2024.
Hayward’s capital allocation priorities reflect a balanced approach to growth and shareholder returns:
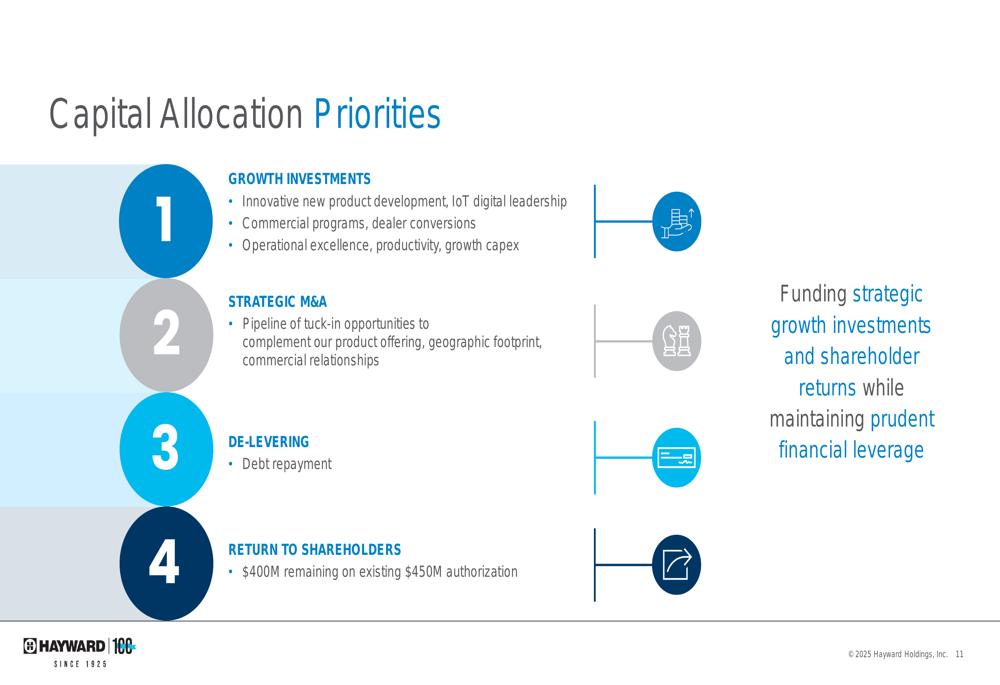
The company is prioritizing growth investments in innovative product development, IoT digital leadership, and operational excellence. Strategic M&A, debt reduction, and shareholder returns through its existing $450 million authorization (with $400 million remaining) round out the capital allocation strategy.
Forward-Looking Statements
Despite the challenges posed by tariffs, Hayward has maintained its full-year 2025 guidance:
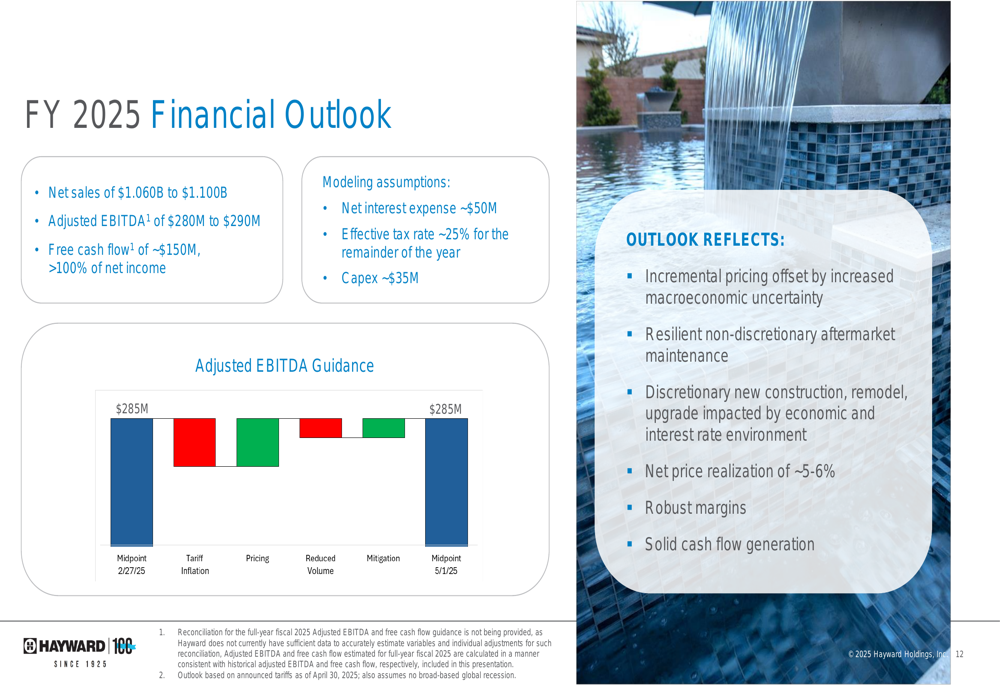
The company expects net sales of $1.060 billion to $1.100 billion and adjusted EBITDA of $280 million to $290 million. Free cash flow is projected at approximately $150 million, representing more than 100% of net income.
The guidance reflects incremental pricing of 5-6% to offset the impact of tariffs, with the company acknowledging increased macroeconomic uncertainty. Hayward expects the non-discretionary aftermarket maintenance segment to remain resilient, while the discretionary new construction segment may be impacted by the economic and interest rate environment.
Key Takeaways
Hayward’s Q1 2025 presentation highlighted several key messages that summarize the company’s current position and outlook:
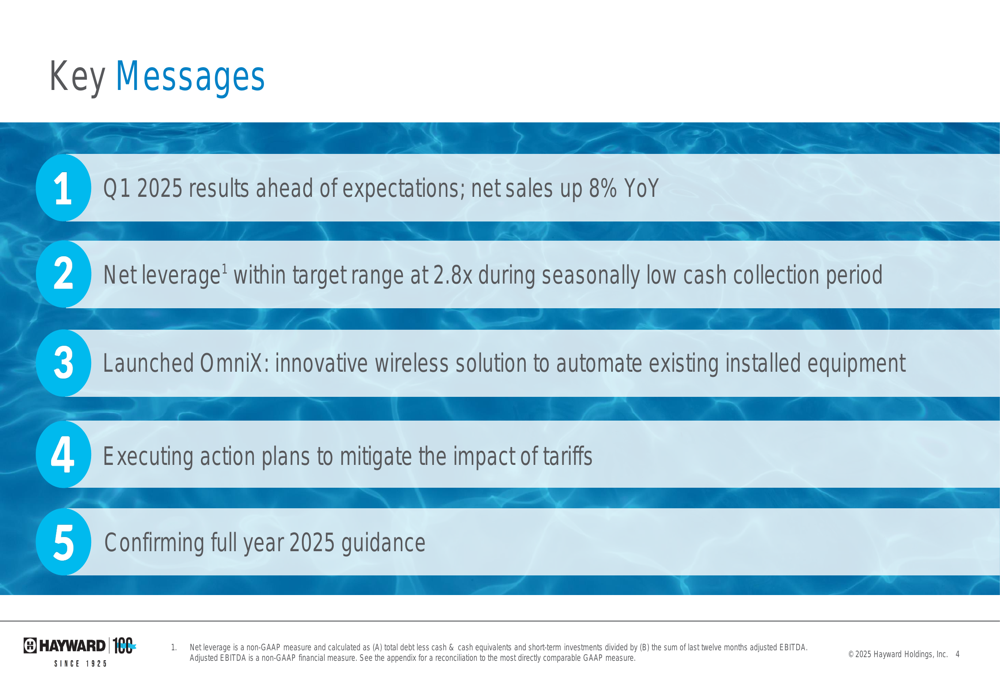
The company has delivered results ahead of expectations with 8% year-over-year net sales growth and has successfully reduced net leverage to 2.8x. The launch of OmniX represents a strategic move to capture a larger share of the aftermarket segment, while the company is actively executing plans to mitigate the impact of tariffs. Despite these challenges, Hayward has confirmed its full-year 2025 guidance, demonstrating confidence in its ability to navigate the current economic environment.
As Hayward celebrates its 100th anniversary, the company continues to position itself as a leader in the pool equipment industry, with a focus on innovation, operational excellence, and strategic growth initiatives to drive long-term value for shareholders.
Full presentation:
This article was generated with the support of AI and reviewed by an editor. For more information see our T&C.