TSX drops after Canadian index edges higher in prior session

Introduction & Market Context
Health In Tech Inc (HIT) presented its Q2 2025 results on July 21, 2025, showcasing strong growth across key financial metrics. The company’s stock responded positively, closing up 16.38% at $1.16 and gaining an additional 6.9% in after-hours trading.
Health In Tech positions itself as an insurance exchange platform revolutionizing the self-funded healthcare market, connecting brokers, employers, and third-party administrators (TPAs) on a single AI-driven platform. The company is targeting a substantial addressable market, estimated at $6.6 trillion, with the U.S. healthcare industry representing $4.9 trillion and the U.S. health insurance market at $1.7 trillion.
The company has particularly focused on small businesses, which employ 59 million people (45.9% of private sector employees) and contribute $12.7 trillion (43.5%) to U.S. GDP. These businesses have traditionally faced challenges in the healthcare market, including limited access, complex processes, and lack of transparency – issues that Health In Tech aims to address through its technology platform.
Quarterly Performance Highlights
Health In Tech reported impressive financial results for Q2 2025, with revenue reaching $9.3 million, representing an 86% year-over-year increase. For the first half of 2025, revenue totaled $17.3 million, already reaching 89% of the company’s full-year 2024 revenue of $19.5 million.
As shown in the following chart of the company’s key performance indicators:
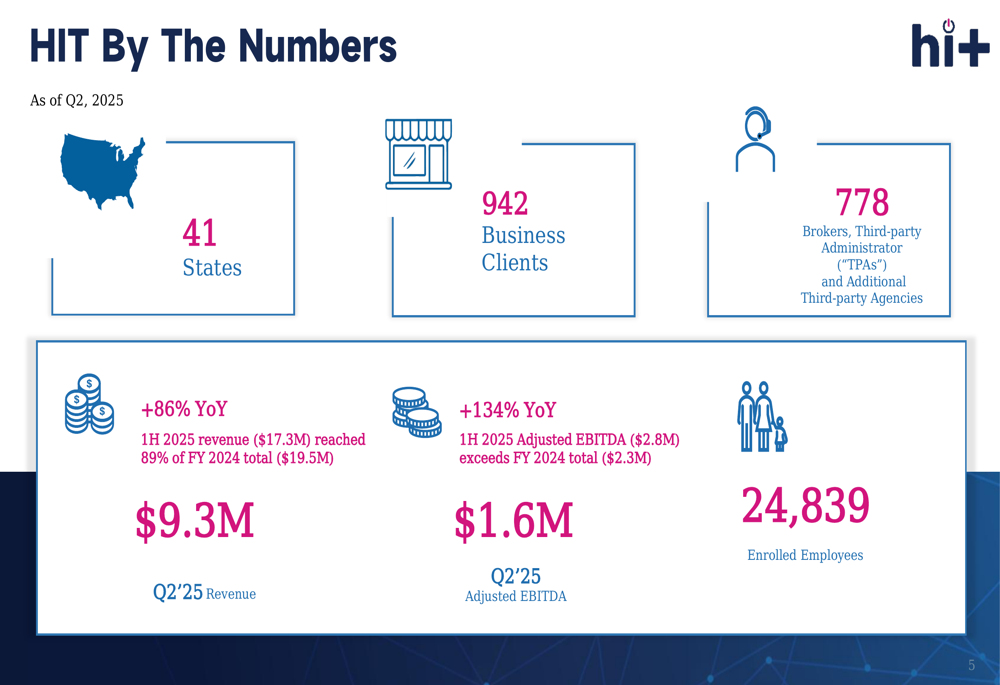
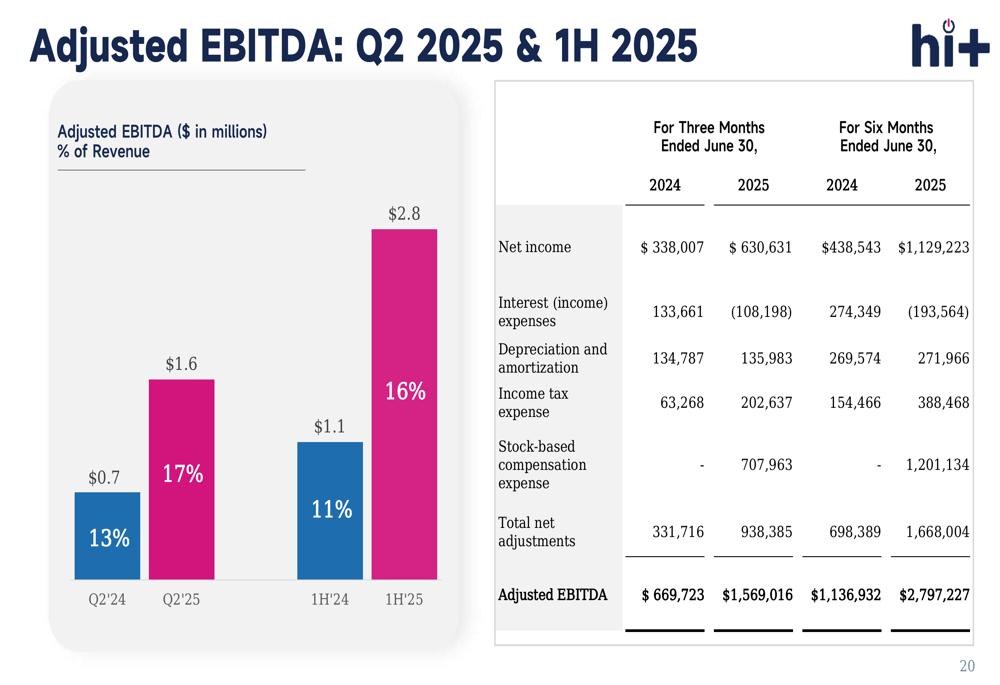
Profitability also showed substantial improvement, with Q2 2025 Adjusted EBITDA of $1.6 million, representing a 134% year-over-year increase. The EBITDA margin improved from 13% in Q2 2024 to 17% in Q2 2025. For the first half of 2025, Adjusted EBITDA reached $2.8 million, already exceeding the full-year 2024 total of $2.3 million.
The financial highlights for Q2 and the first half of 2025 are illustrated in the following chart:
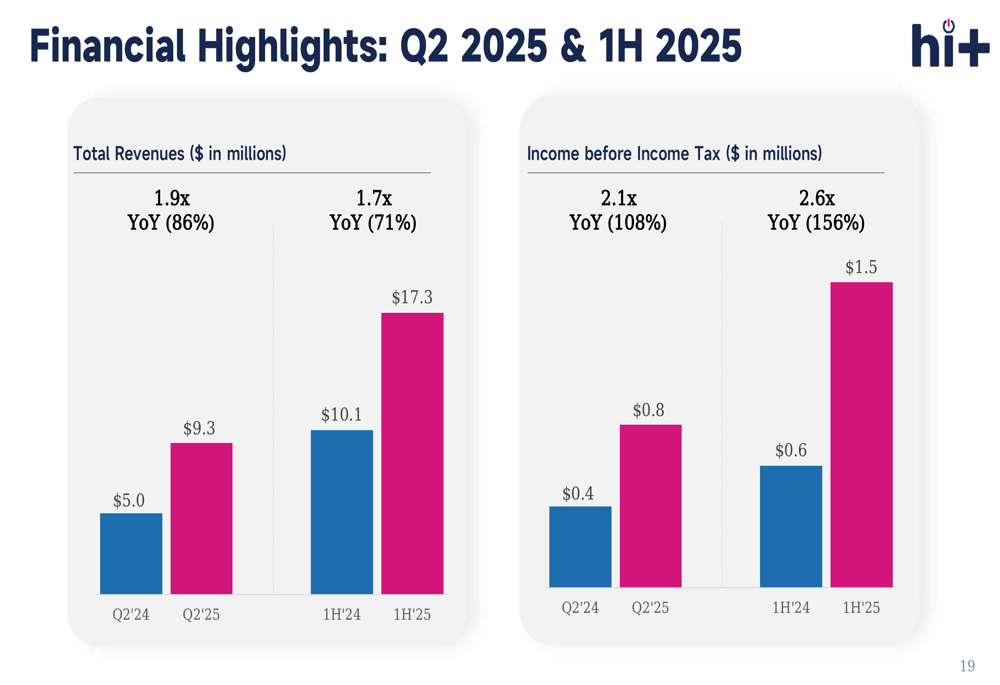
Income before income tax also showed strong growth, increasing 108% year-over-year for Q2 2025 and 156% for the first half of 2025. The company’s adjusted EBITDA performance demonstrates the improving profitability:
The company’s liquidity position has strengthened significantly, with cash increasing from $2.2 million to $8.1 million, while accounts receivable decreased slightly from $1.5 million to $1.3 million, indicating improved collections efficiency.
Strategic Initiatives & Platform Overview
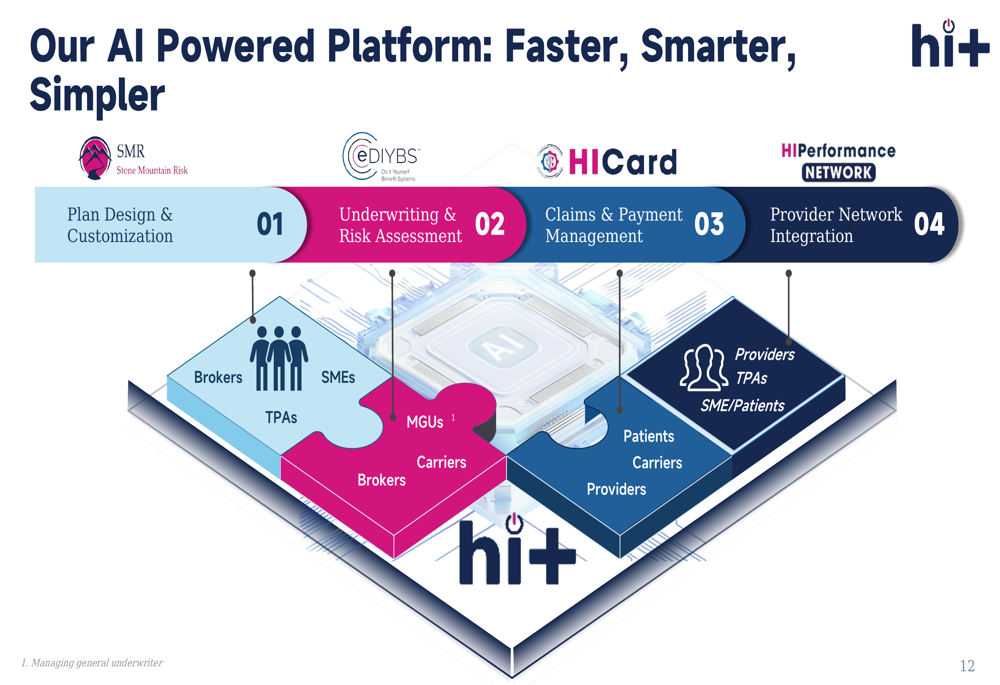
Health In Tech’s growth strategy centers on its AI-powered platform, which integrates plan design and customization, underwriting and risk assessment, claims and payment management, and provider network integration. The platform connects key stakeholders including brokers, employers, and TPAs.
The company’s comprehensive AI-powered platform is illustrated in this diagram:
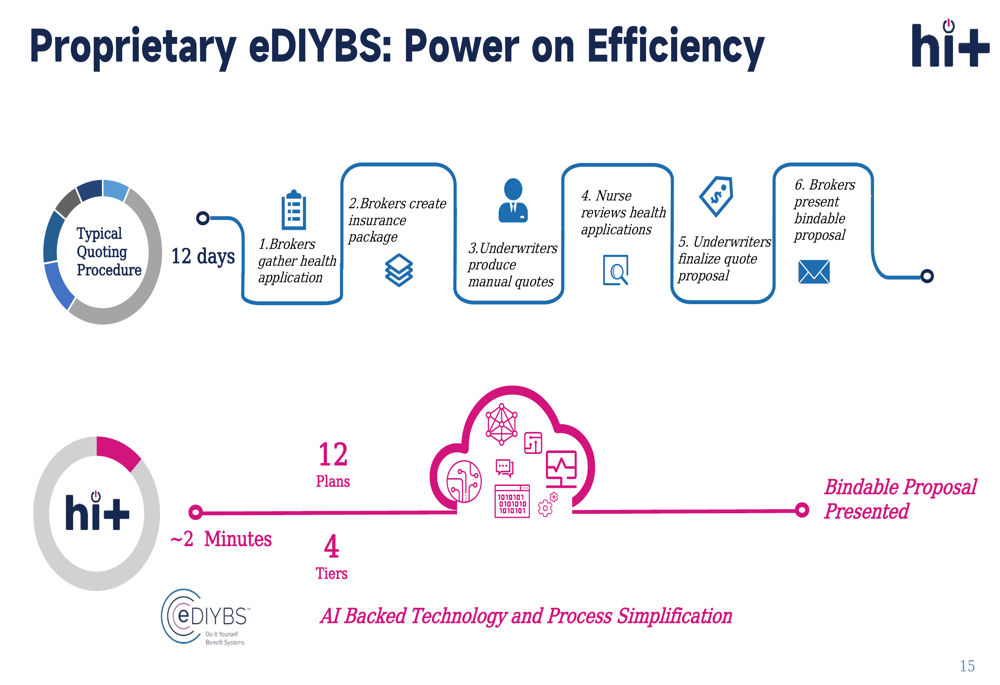
A key competitive advantage is the company’s proprietary eDIYBS system, which dramatically reduces the time required to generate bindable proposals from 12 days to approximately 2 minutes. The system provides 12 plans with 4 tier rates, streamlining what was previously a complex, multi-step process.
The efficiency gains from the eDIYBS system are demonstrated in this comparison:
Health In Tech’s revenue model is based on fees calculated as a percentage of premiums and flat fees per employee per month. The company identified the number of enrolled employees as its key growth driver, with current enrollment at 24,839 employees across 942 business clients.
The company’s HI Performance Network offers Medicare-based reimbursement pricing with direct Medicare contracts across all 50 states, encompassing 8,887 hospitals and over 1.4 million provider locations.
Detailed Financial Analysis
Health In Tech’s financial performance shows accelerating growth and improving profitability metrics. The 86% year-over-year revenue growth in Q2 2025 represents a significant acceleration from previous quarters, driven by increased client acquisition and higher enrollment numbers.
The company’s EBITDA margin expansion from 13% to 17% in Q2 indicates that the business is achieving greater operational efficiency as it scales. This margin improvement suggests the company’s technology platform is delivering the promised cost efficiencies and that the business model has positive operating leverage.
The substantial increase in cash position from $2.2 million to $8.1 million provides the company with greater financial flexibility to fund continued growth initiatives. The slight decrease in accounts receivable despite the significant revenue growth indicates improved working capital management.
Forward-Looking Statements
Health In Tech is well-positioned to capitalize on the growing demand for more efficient, transparent, and affordable healthcare solutions, particularly among small and mid-sized businesses. The company’s AI-driven platform addresses key pain points in the healthcare market, including limited access, complex processes, and lack of transparency.
With its presence in 41 states, relationships with 778 brokers and TPAs, and growing client base of 942 businesses, Health In Tech has established a solid foundation for continued expansion. The company’s focus on leveraging artificial intelligence to transform healthcare delivery aligns with broader industry trends toward greater digitization and personalization of healthcare services.
As Health In Tech continues to execute its growth strategy, key metrics to watch include the number of enrolled employees, geographic expansion, and the company’s ability to maintain or improve its EBITDA margins as it scales. The company’s strong first-half performance in 2025 suggests it is on track to significantly exceed its 2024 results, potentially driving further investor interest in the stock.
Full presentation:
This article was generated with the support of AI and reviewed by an editor. For more information see our T&C.