ReElement Technologies stock soars after securing $1.4B government deal

Introduction & Market Context
Hercules Capital, Inc. (NYSE:HTGC), a leading internally managed business development company (BDC), presented its third quarter 2025 results on October 30, 2025, highlighting record investment income and continued outperformance against industry peers. Despite beating analyst expectations with earnings per share of $0.49 versus the forecasted $0.48, the stock experienced a slight 0.9% decline in aftermarket trading, closing at $17.73.
The company’s presentation emphasized its unique position as an internally managed BDC focused on venture and growth stage lending, primarily in the technology and life sciences sectors. This structure eliminates management fees typically associated with externally managed BDCs, potentially offering more efficient returns to shareholders.
Quarterly Performance Highlights
Hercules Capital reported strong financial results for Q3 2025, with total investment income reaching a record $138.1 million, representing a 10.3% year-over-year increase. Net investment income (NII) totaled $88.6 million, translating to $0.49 per share, slightly above analyst expectations.
The company maintained impressive profitability metrics with a return on average equity (ROAE) of 17.4% and return on average assets (ROAA) of 8.7%, while achieving a net interest margin (NIM) of 10.8%. These figures reflect Hercules’ ability to generate substantial returns from its investment portfolio.
As shown in the following comprehensive overview of Q3 2025 performance:
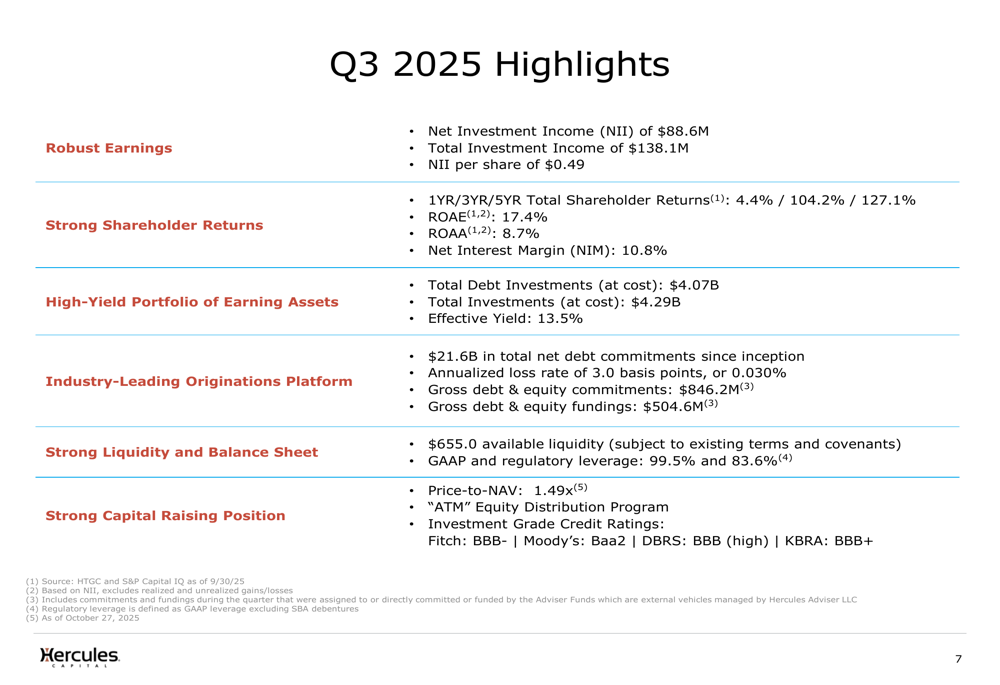
The company’s debt investment portfolio stood at $4.07 billion (at cost) at quarter-end, with total investments at $4.29 billion. Hercules maintained a strong effective yield of 13.5% on its debt portfolio, significantly above industry averages. The net asset value (NAV) per share increased to $12.05, representing a 1.8% increase quarter-over-quarter.
During the quarter, Hercules demonstrated robust origination capabilities, with gross debt and equity commitments of $846.2 million and fundings of $504.6 million. The company maintained strong liquidity of $655.0 million available for investment, subject to existing terms and covenants.
Competitive Industry Position
Hercules Capital continues to outperform its peer group across key performance metrics. The presentation highlighted the company’s superior returns compared to industry peers, with total shareholder returns significantly exceeding the peer group across all time horizons.
The following chart illustrates Hercules’ consistent outperformance in ROAA, ROAE, and total shareholder returns:
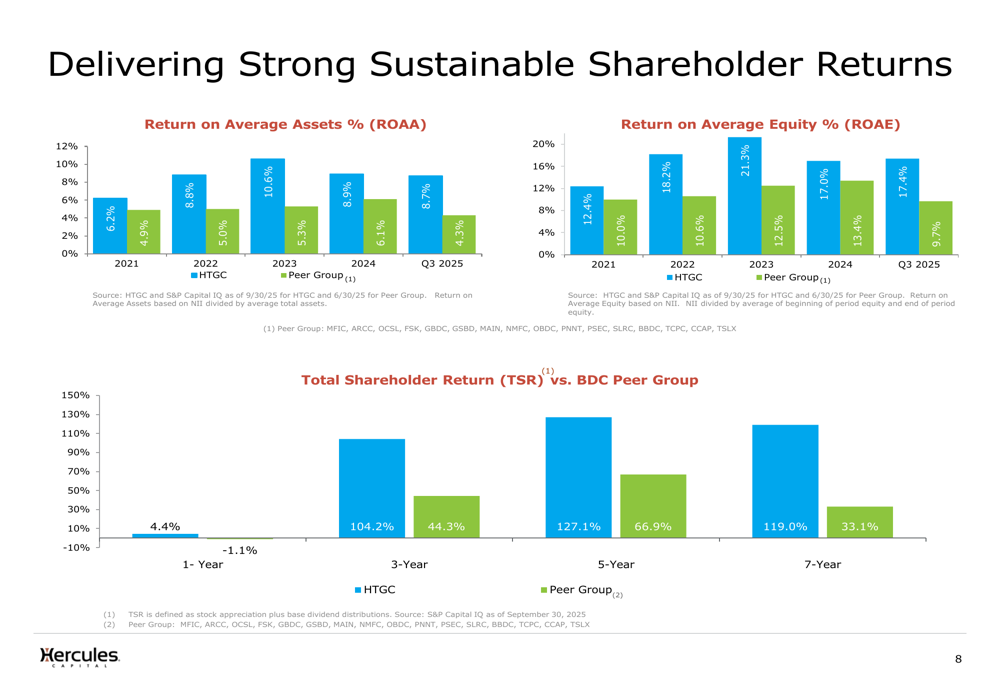
Particularly notable is Hercules’ three-year total shareholder return of 104.2% versus 44.3% for the peer group, and five-year return of 127.1% versus 66.9% for peers. This outperformance underscores the effectiveness of Hercules’ investment strategy and internally managed structure.
The company also maintains a premium valuation relative to its net asset value, with a price-to-NAV ratio of 1.49x as of October 27, 2025. This premium valuation provides Hercules with a competitive advantage for raising equity capital when needed.
As shown in the following chart tracking Hercules’ premium to NAV:
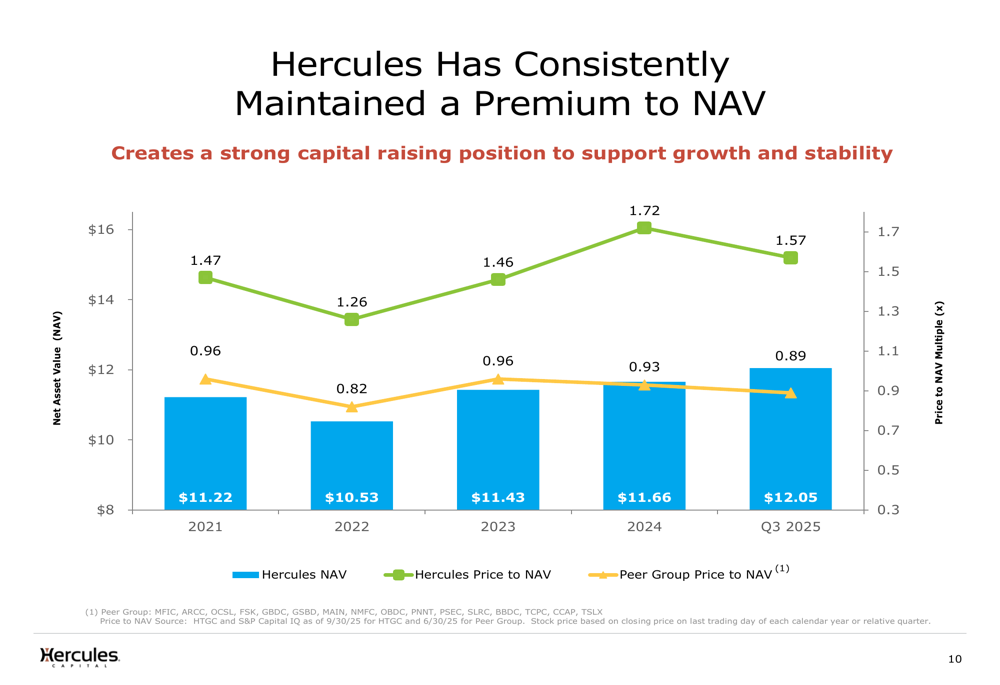
This premium valuation has been consistent over time, with Hercules’ historical price-to-NAV ranging from approximately 0.7x to 1.9x, and consistently exceeding the peer group average. The premium reflects market confidence in Hercules’ business model and management team.
Strategic Initiatives & Portfolio Growth
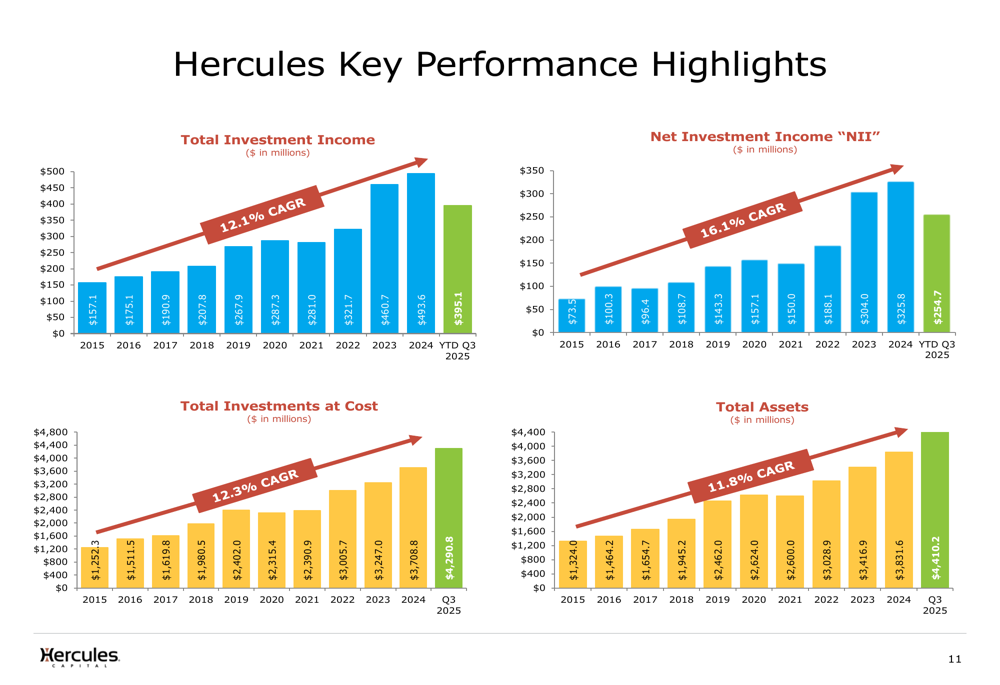
Hercules Capital has demonstrated consistent long-term growth across key financial metrics. The presentation highlighted impressive compound annual growth rates (CAGRs) over the past decade, including 12.1% for total investment income, 16.1% for net investment income, 12.3% for total investments at cost, and 11.8% for total assets.
The following chart illustrates this consistent growth trajectory:
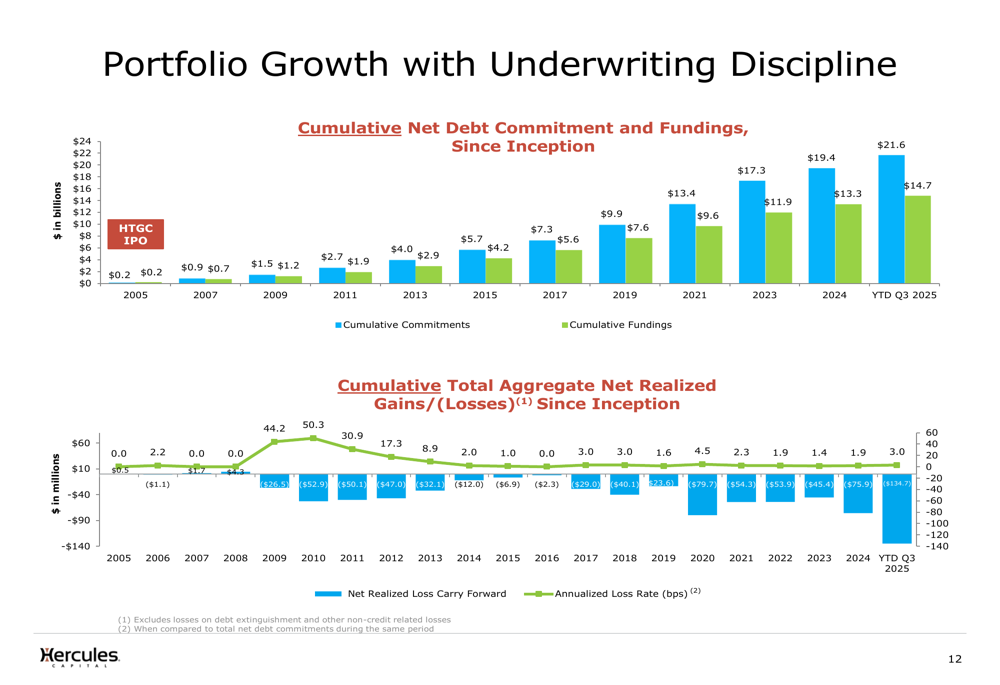
The company’s origination platform has generated $21.6 billion in total net debt commitments since inception, with cumulative fundings of $14.7 billion. Despite this significant lending volume, Hercules has maintained strong credit quality with an annualized loss rate of just 3.0 basis points, or 0.030%, demonstrating disciplined underwriting standards.
The portfolio growth and underwriting discipline are illustrated in the following chart:
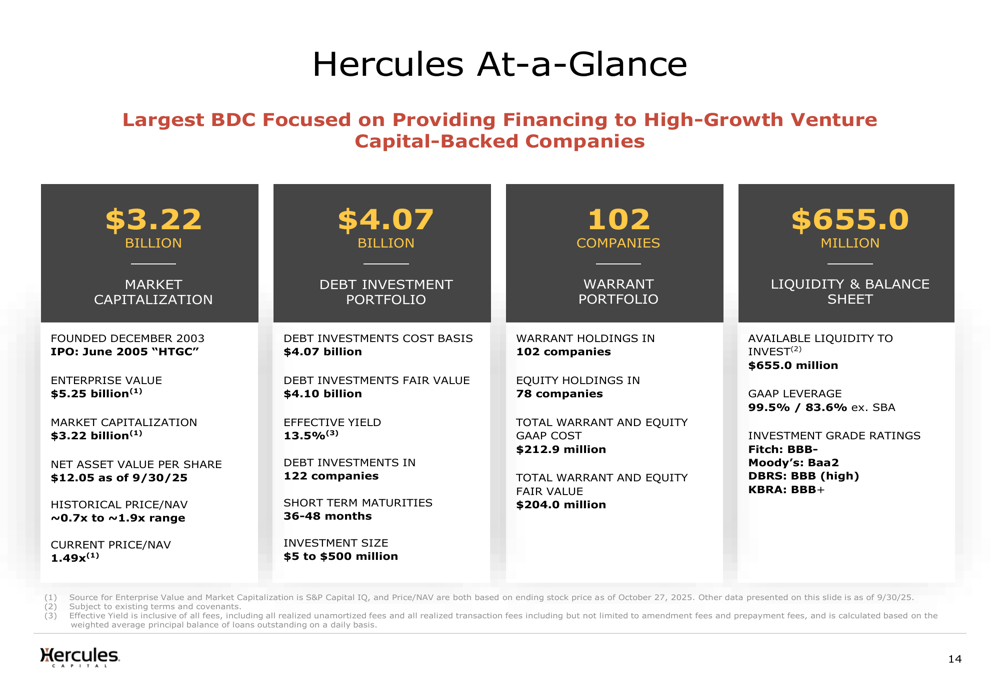
Hercules maintains a diversified portfolio across 122 debt investments, 102 warrant holdings, and 78 equity positions. The company’s investment strategy focuses on short-term maturities (36-48 months) and investment sizes ranging from $5 million to $500 million, providing flexibility and risk management.
Forward-Looking Statements
Looking ahead, Hercules Capital expects Q4 prepayments to range between $150 million and $200 million, as noted in the earnings call. The company anticipates maintaining its core yield guidance between 12% and 12.5% and plans to sustain both base and supplemental dividends.
For Q3 2025, Hercules declared a base distribution of $0.40 per share and a supplemental distribution of $0.07 per share, resulting in an annualized base dividend yield of 8.5% as of September 30, 2025.
The company’s strong investment-grade credit ratings (Fitch:BBB-, Moody’s: Baa2, DBRS: BBB (high), KBRA: BBB+) provide flexibility for accessing debt capital markets on favorable terms. With GAAP leverage of 99.5% and regulatory leverage of 83.6%, Hercules maintains capacity for additional portfolio growth while remaining within regulatory limits.
As shown in the following snapshot of Hercules’ key metrics:
During the earnings call, CEO Scott Bluestein emphasized the company’s leadership position in the venture and growth stage lending market while acknowledging "pockets of frothiness across certain parts of the venture and growth stage lending markets." This cautious approach to underwriting amid market exuberance reflects Hercules’ disciplined investment philosophy.
With a strong pipeline and origination expectations, Hercules appears well-positioned to continue its robust performance, though investors should monitor potential challenges including market saturation in venture lending, macroeconomic pressures, interest rate fluctuations, and competitive intensity in the life sciences and technology sectors.
Full presentation:
This article was generated with the support of AI and reviewed by an editor. For more information see our T&C.