Palantir shares slip by 7% despite posting record revenue in third quarter

Interface Inc. (NASDAQ:TILE), a global leader in commercial flooring solutions, released its Q3 2025 investor presentation on October 31, 2025, revealing stronger-than-expected financial results and continued progress on strategic initiatives. The company reported significant year-over-year growth in both revenue and earnings per share, exceeding analyst expectations and driving a positive market reaction.
Introduction & Market Context
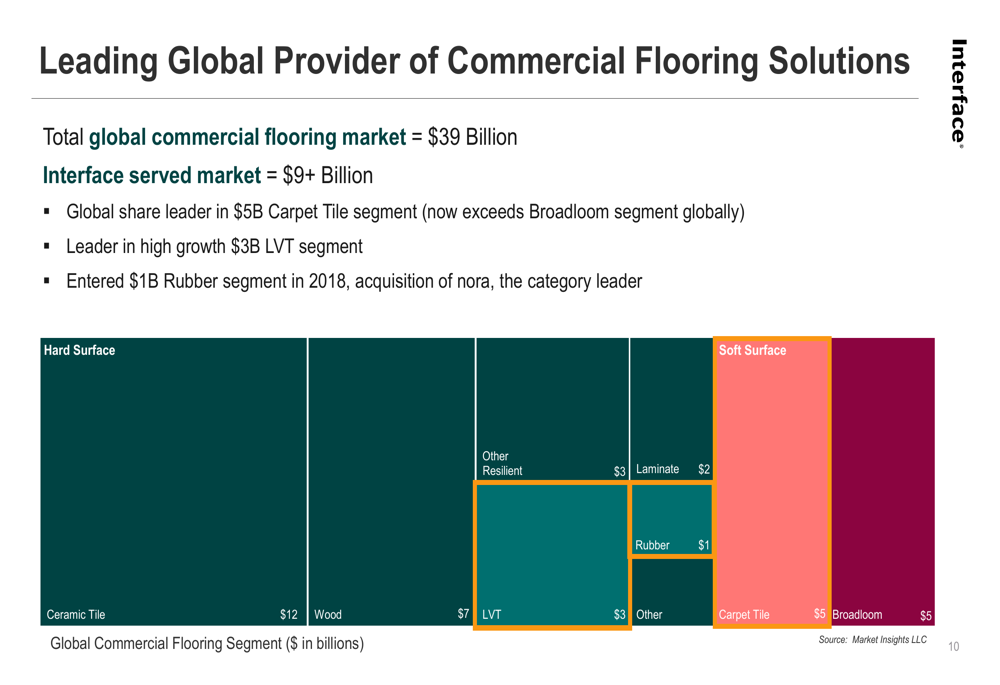
Interface operates in a $39 billion global commercial flooring market, with its served market estimated at over $9 billion. The company maintains leadership positions in key segments, including carpet tile, luxury vinyl tile (LVT), and rubber flooring. Following the earnings release, Interface’s stock rose 4.99% in premarket trading to $28, reflecting investor confidence in the company’s performance and strategic direction.
As shown in the following chart detailing Interface’s position in the global commercial flooring market:
Quarterly Performance Highlights
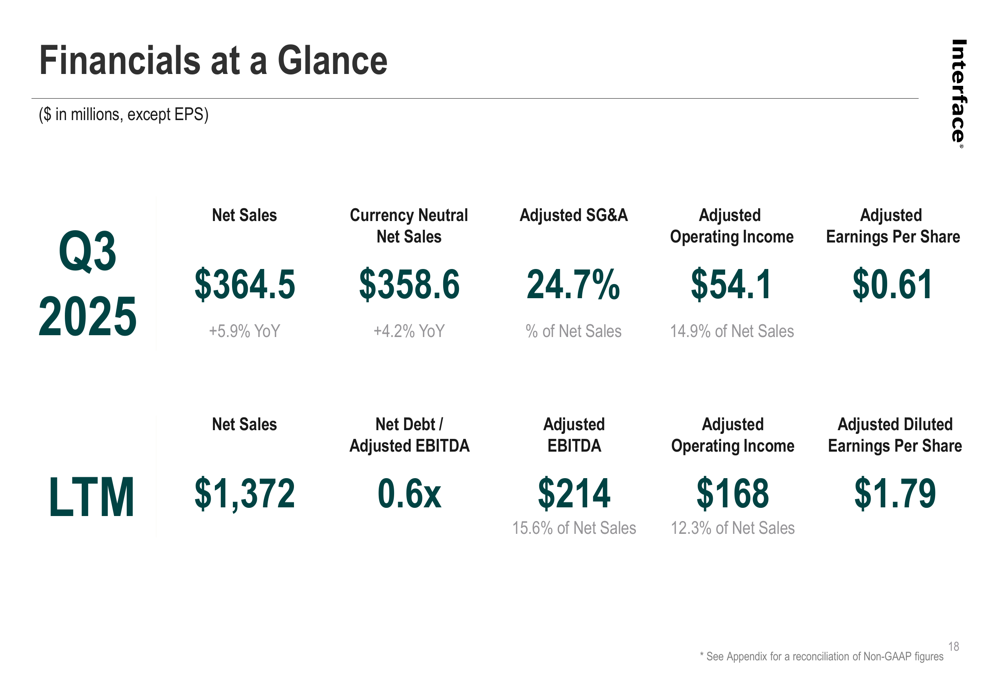
Interface reported Q3 2025 net sales of $364.5 million, representing a 5.9% increase year-over-year and exceeding analyst expectations of $358.19 million. The company’s adjusted earnings per share reached $0.61, significantly outperforming the forecasted $0.48 and marking a 27.08% positive surprise.
The strong performance was driven by margin expansion, with adjusted gross profit margin improving to 39.5%, a 208 basis point increase from the prior year. Adjusted operating income rose to $54.1 million or 14.9% of net sales, compared to $43.5 million or 12.6% in Q3 2024.
The company’s financial highlights for the quarter are illustrated in this comprehensive overview:
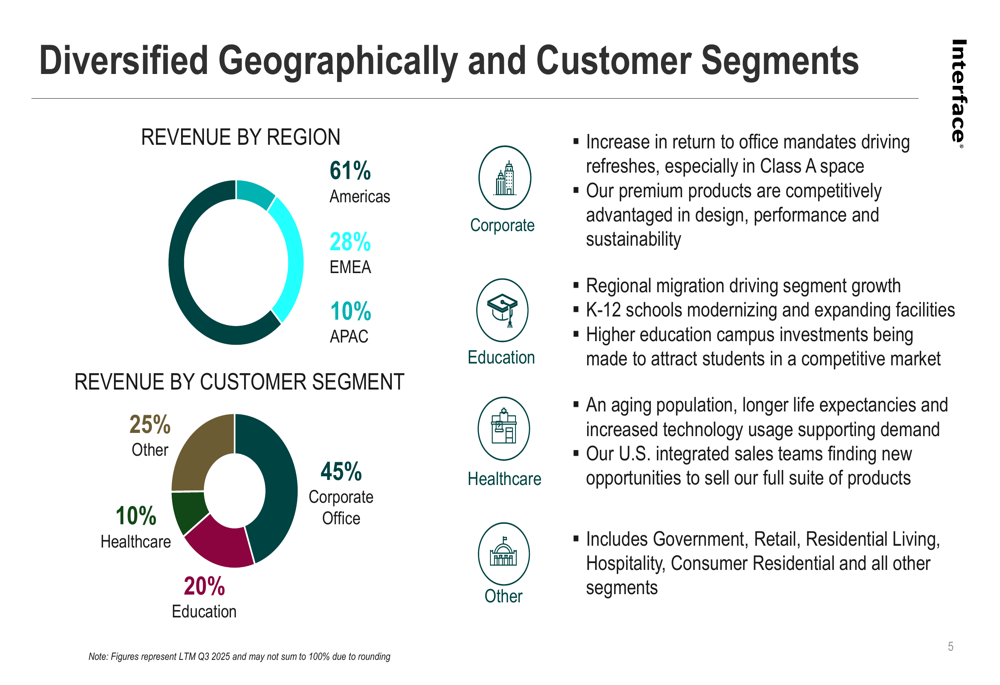
Interface’s revenue remains well-diversified across geographies and customer segments, providing stability and multiple growth avenues. The Americas region accounts for 61% of net sales, followed by Europe, Middle East and Africa (EMEA) at 28% and Asia-Pacific at 10%. From a customer segment perspective, corporate office represents 45% of revenue, education 20%, healthcare 10%, and other segments 25%.
The healthcare segment showed particularly strong growth, increasing 29% year-over-year according to the earnings call, as Interface continues to capitalize on opportunities in this sector.
The following chart illustrates Interface’s geographic and customer segment diversification:
Financial Position and Trends
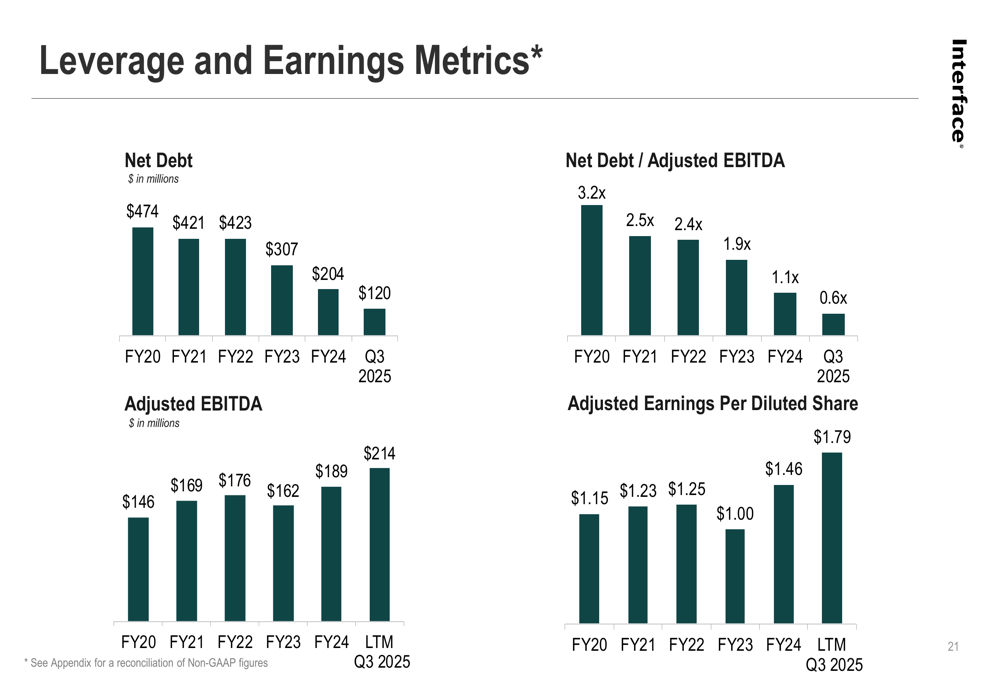
Interface has made remarkable progress in strengthening its financial position over recent years. The company has significantly reduced its net debt from $474 million in FY2020 to just $120 million as of Q3 2025. Consequently, the net debt to adjusted EBITDA ratio has improved dramatically from 3.2x in FY2020 to a very healthy 0.6x in Q3 2025.
This deleveraging has occurred alongside improvements in profitability metrics. Adjusted EBITDA for the last twelve months ending Q3 2025 reached $214 million (15.6% of net sales), while adjusted earnings per share grew to $1.79, continuing a positive trend from $1.46 in FY2024.
The following chart demonstrates Interface’s impressive financial improvements over time:
During the earnings call, CFO Bruce Hausman highlighted the company’s operational efficiencies, noting, "Our manufacturing efficiencies have been working very, very well, driving about half of the margin expansion."
Strategic Initiatives and Market Position
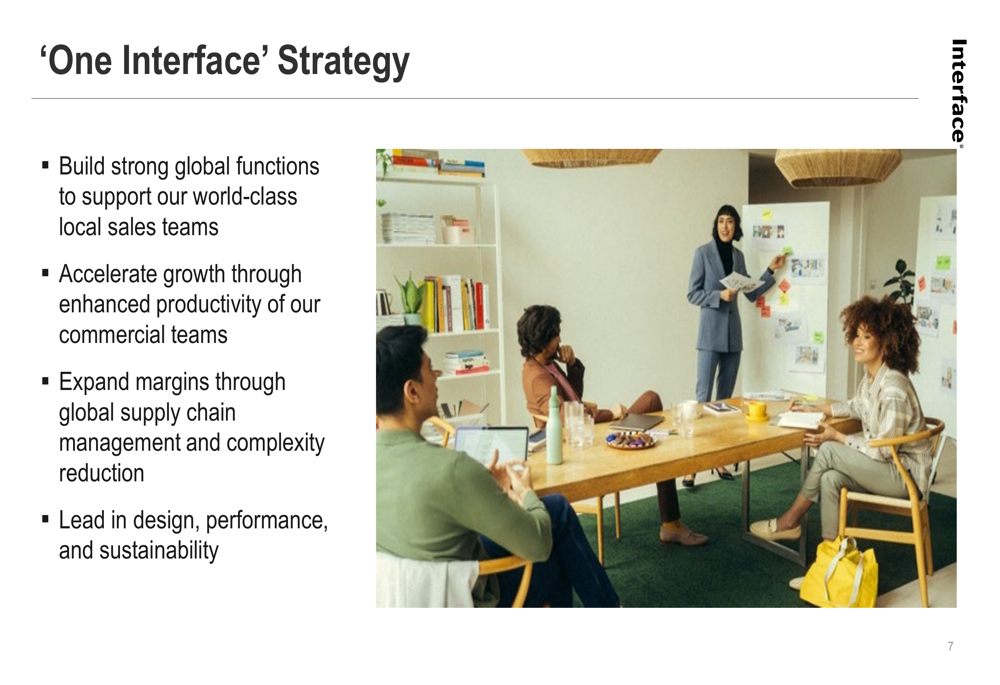
Interface continues to execute its "One Interface" strategy, which focuses on building strong global functions to support local sales teams, enhancing commercial team productivity, expanding margins through supply chain management, and maintaining leadership in design, performance, and sustainability.
The company’s strategic approach is outlined in this slide:
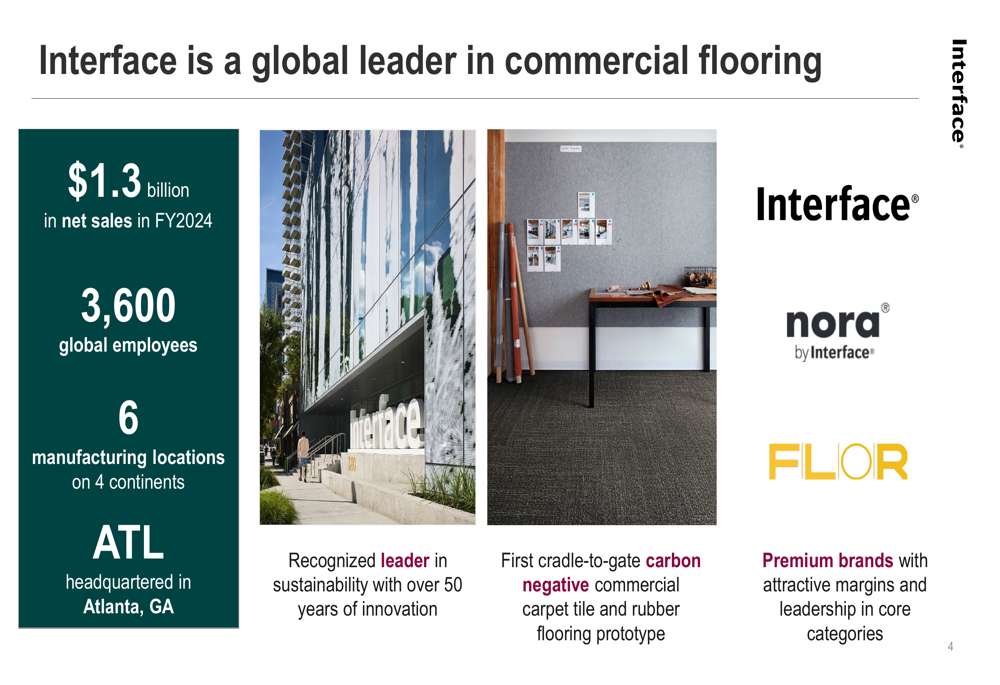
Interface maintains a strong competitive position as a global leader in commercial flooring with $1.3 billion in net sales in FY2024, 3,600 global employees, and manufacturing locations on four continents. The company is particularly well-positioned in the premium segment of the market, where it competes on design, sustainability, and innovation rather than price.
As shown in this overview of Interface’s global leadership position:
CEO Laurel Hurd emphasized the company’s focus on innovation during the earnings call, highlighting an upcoming launch of a new rubber flooring product: "We believe it will accelerate growth in the healthcare segment." This aligns with Interface’s strategy to expand in high-margin, growing segments like healthcare.
Sustainability Leadership
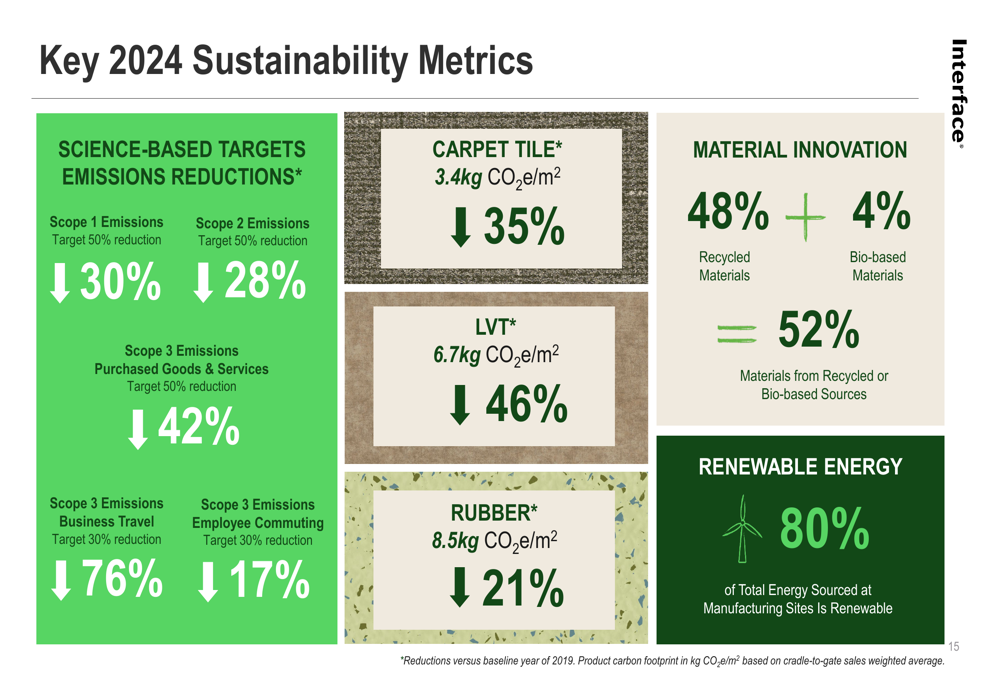
Interface continues to demonstrate leadership in environmental sustainability, a core component of its brand identity and competitive advantage. The company has reduced greenhouse gas emissions by 4% and decreased its carbon footprint across product categories, while maintaining its commitment to becoming carbon negative by 2040.
Recent sustainability achievements include significant reductions in emissions across all scopes, with Scope 1 emissions down 30%, Scope 2 down 28%, and various Scope 3 emissions categories showing substantial improvements. The company has also made progress in material innovation, with 52% of materials now coming from recycled or bio-based sources.
The following slide details Interface’s key 2024 sustainability metrics:
Interface’s sustainability initiatives extend beyond environmental metrics to include social and governance aspects. The company has been certified as a Great Place to Work® in nine countries and has expanded employee learning and development programs while introducing new inclusion networks.
Forward-Looking Statements
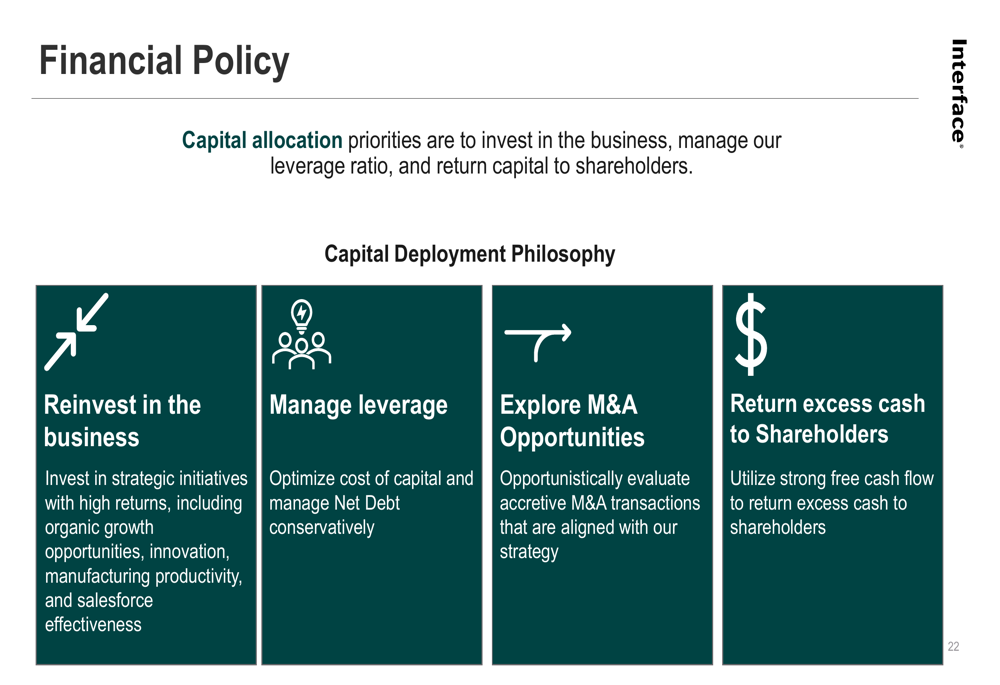
Looking ahead, Interface has set a full-year 2025 net sales guidance of $1.375 to $1.390 billion, with a focus on expanding its gross profit margin to 38.5%. The company’s financial policy prioritizes reinvesting in the business, managing leverage, exploring accretive M&A opportunities, and returning excess cash to shareholders.
The company’s capital allocation priorities are illustrated in this financial policy overview:
Interface is preparing to launch a new rubber flooring innovation in early 2026, aiming to boost growth in the healthcare segment. Capital expenditures are expected to increase by approximately $10 million in 2026 to support these initiatives.
While the outlook is generally positive, potential risks include supply chain disruptions, market saturation in certain segments, macroeconomic pressures such as inflation, currency fluctuations affecting international operations, and increased competition in the flooring industry.
With its strong financial position, market leadership, and strategic focus on high-growth segments and sustainability, Interface appears well-positioned to continue its positive momentum into 2026 and beyond.
Full presentation:
This article was generated with the support of AI and reviewed by an editor. For more information see our T&C.