Two 59%+ winners, four above 25% in Aug – How this AI model keeps picking winners

Jackson Financial Inc. (NYSE:JXN) reported mixed first quarter 2025 results on May 8, showing a GAAP net loss but significant improvement in adjusted operating earnings and free cash flow generation. The company remains on track to meet its 2025 financial targets while maintaining a strong capital position.
Executive Summary
Jackson Financial reported a GAAP net loss of $35 million ($0.48 per share) for Q1 2025, contrasting with adjusted operating earnings of $376 million ($5.10 per share), which increased 13% from $334 million in Q1 2024. The company returned $231 million to shareholders through dividends and share repurchases during the quarter, while maintaining a strong estimated risk-based capital (RBC) ratio of 585%.
As shown in the following chart of key financial highlights for Q1 2025:
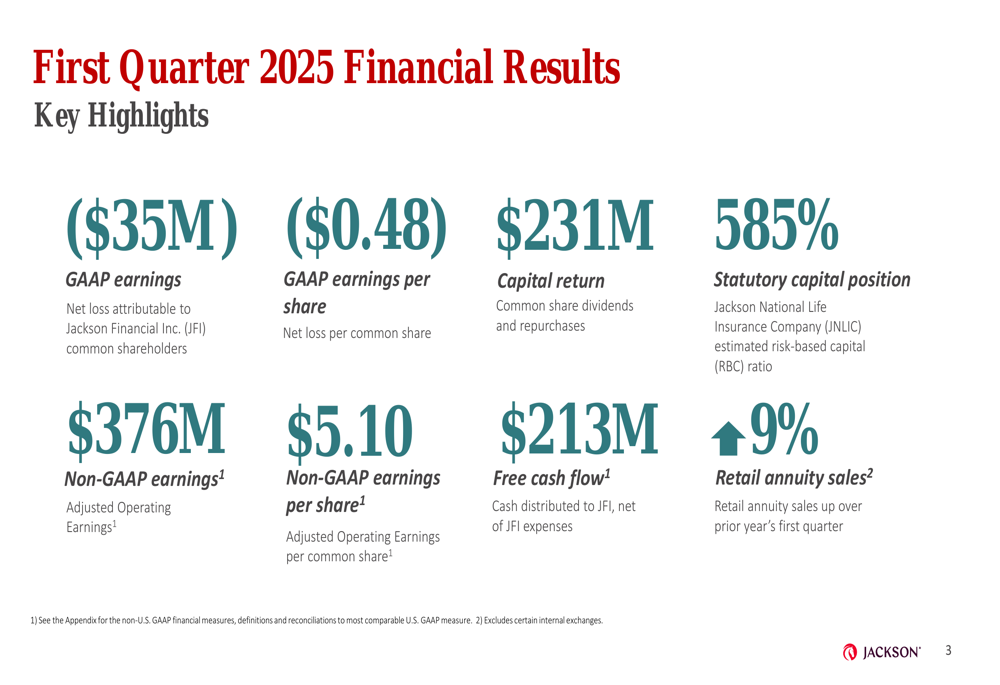
Retail annuity sales grew 9% year-over-year, reflecting the company’s continued success in product diversification. Free cash flow improved significantly to $213 million, up from $20 million in the same period last year, demonstrating enhanced capital generation capabilities.
Quarterly Performance Highlights
Jackson’s adjusted operating earnings of $376 million for Q1 2025 showed solid improvement from $334 million in Q1 2024, primarily driven by higher spread income from growth in average RILA (Registered Index-Linked Annuity) assets under management. However, adjusted book value attributable to common shareholders declined to $11.02 billion from $11.40 billion a year earlier.
The following chart illustrates the consolidated results for the first quarter:
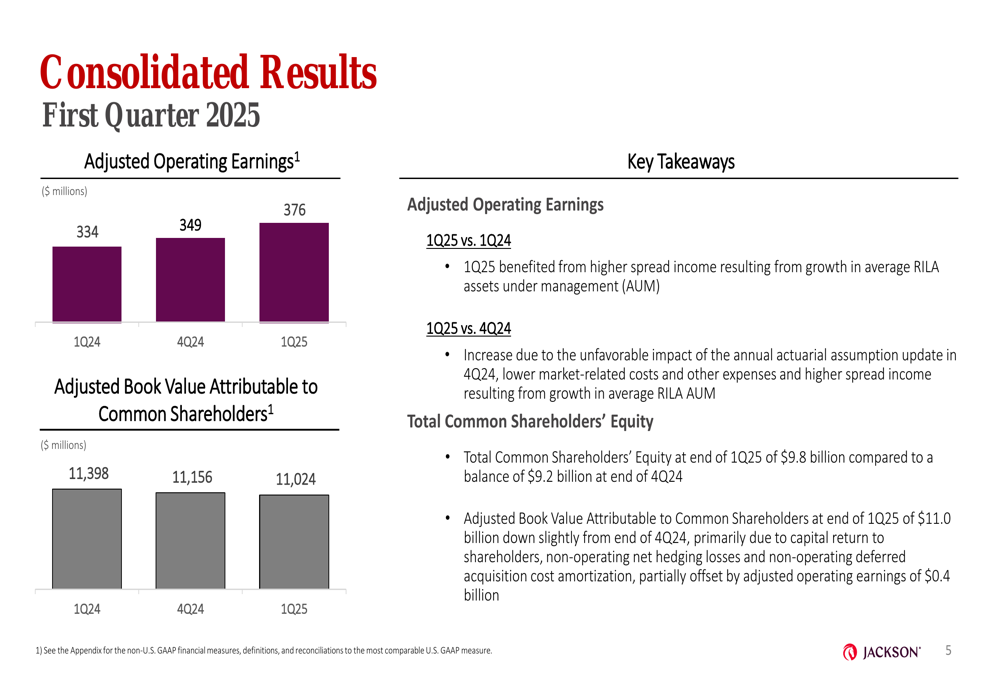
The company’s segment results showed stability in the Retail segment with pre-tax adjusted operating earnings of $420 million in Q1 2025, virtually unchanged from $419 million in Q1 2024. The Institutional segment contributed $18 million, down from $31 million a year ago, while the Closed Block segment improved to $28 million from $19 million in Q1 2024.
Jackson’s retail sales diversification strategy continues to show progress, with total retail sales reaching $4.0 billion in Q1 2025, up from $3.7 billion in Q1 2024:
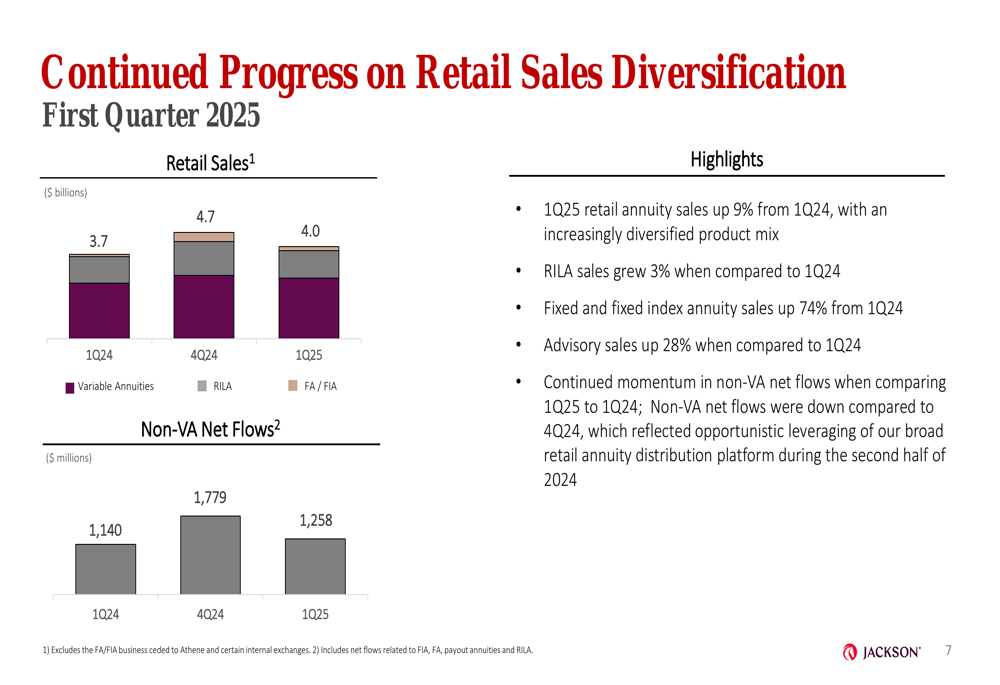
Non-VA (Variable Annuity) net flows also improved to $1.26 billion in Q1 2025 from $1.14 billion in the prior-year period, indicating successful product diversification efforts.
Capital Position and Shareholder Returns
Jackson Financial demonstrated significant improvement in capital generation and free cash flow during the first quarter of 2025. The company generated $441 million in after-tax statutory capital and $407 million in free capital generation.
The following chart shows the company’s improved capital generation and free cash flow:
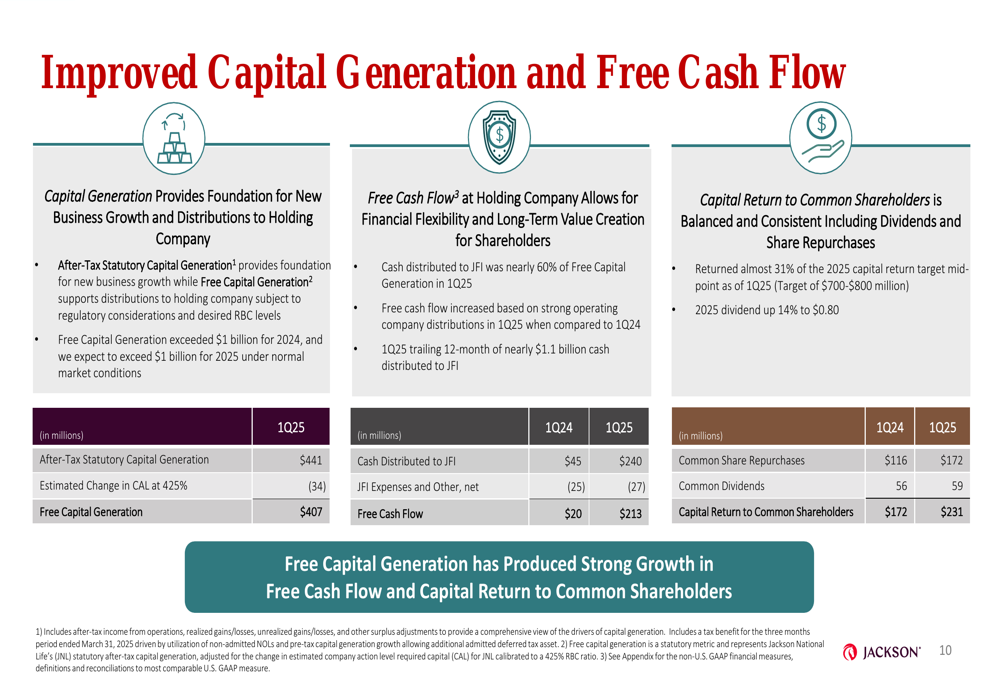
Cash distributed to Jackson Financial Inc. increased substantially to $240 million in Q1 2025 from $45 million in Q1 2024. This enabled the company to return $231 million to common shareholders through $172 million in share repurchases and $59 million in common dividends, compared to $172 million total capital return in Q1 2024.
The company’s strong capital and liquidity position is illustrated in the following chart:
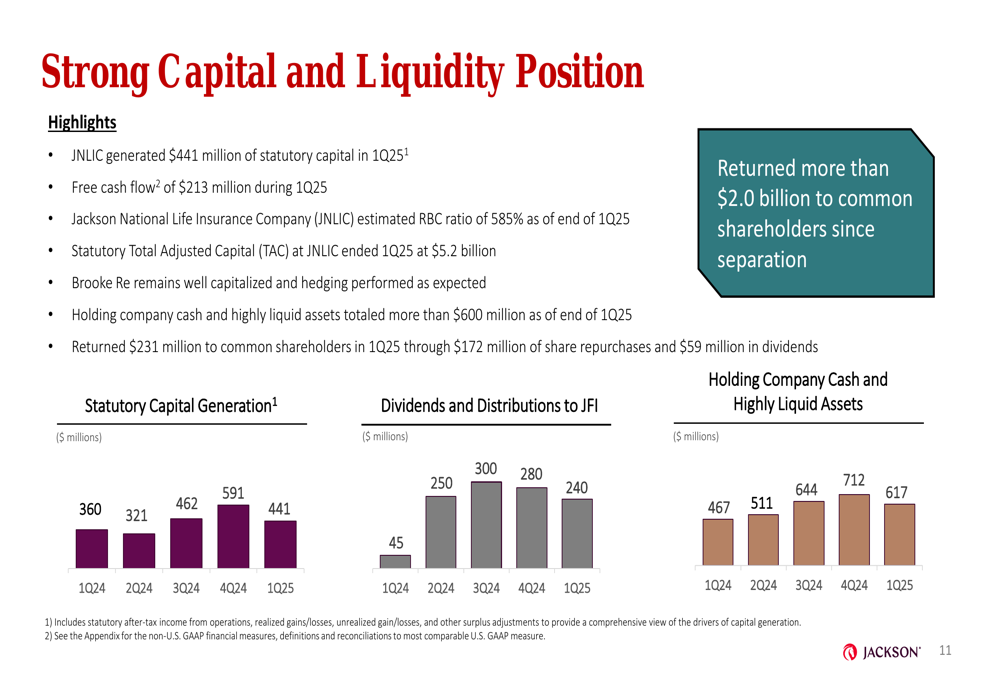
Jackson maintained robust holding company cash and highly liquid assets of $617 million at the end of Q1 2025, well above its minimum liquidity buffer of $250 million, providing approximately two years of holding company fixed expenses coverage.
Investment Portfolio Analysis
Jackson Financial maintains a high-quality, diversified investment portfolio with a conservative approach to risk management. As of March 31, 2025, the U.S. GAAP investment portfolio was primarily allocated to corporate securities (59%), mortgage loans (15%), and other asset-backed securities (7%).
The composition of the U.S. GAAP investment portfolio is shown in the following chart:
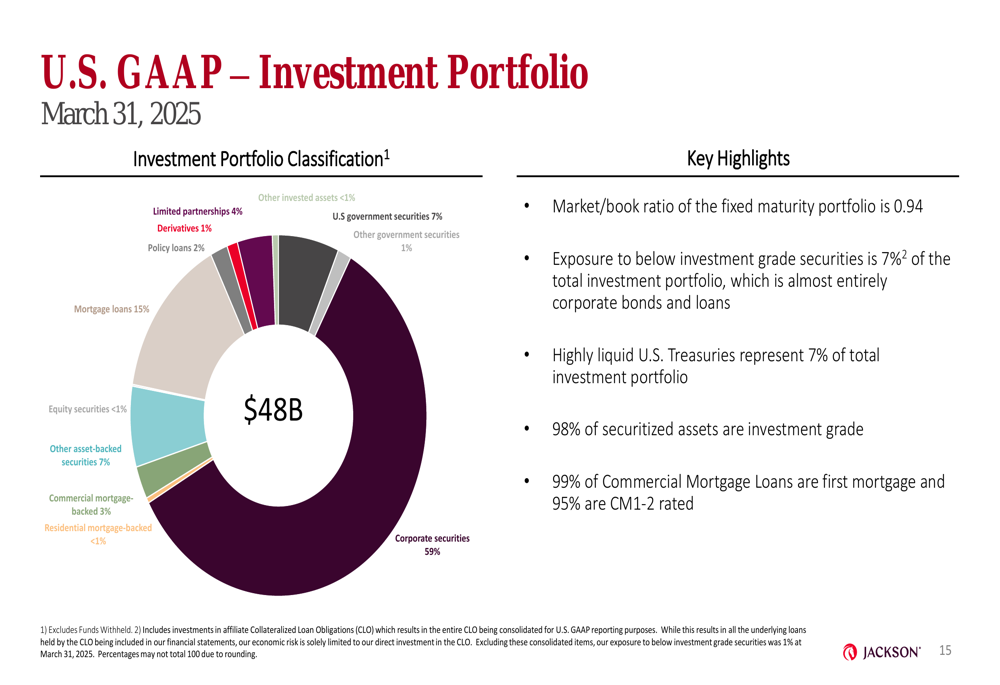
The market-to-book ratio of the fixed maturity portfolio stood at 0.94, with exposure to below investment grade securities limited to 7% of the total investment portfolio. Highly liquid U.S. Treasuries represented 7% of the portfolio, providing strong liquidity support.
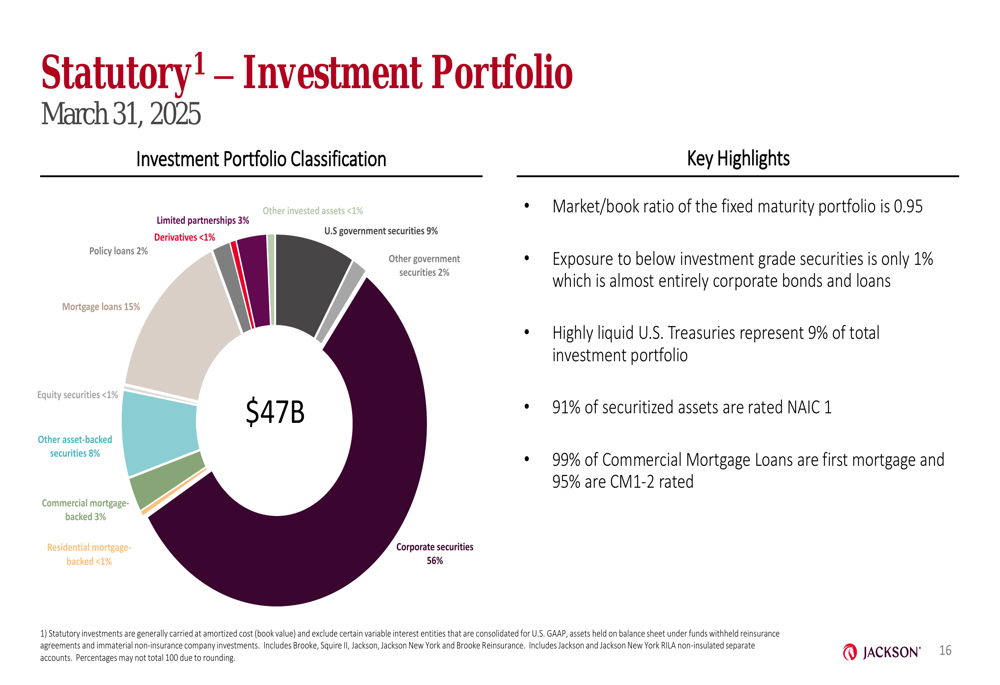
From a statutory perspective, the investment portfolio showed a similar composition with 56% in corporate securities and 98% of the fixed maturity portfolio rated as investment grade:
The corporate portfolio demonstrated high credit quality with 98% investment grade securities, as illustrated in the following chart:
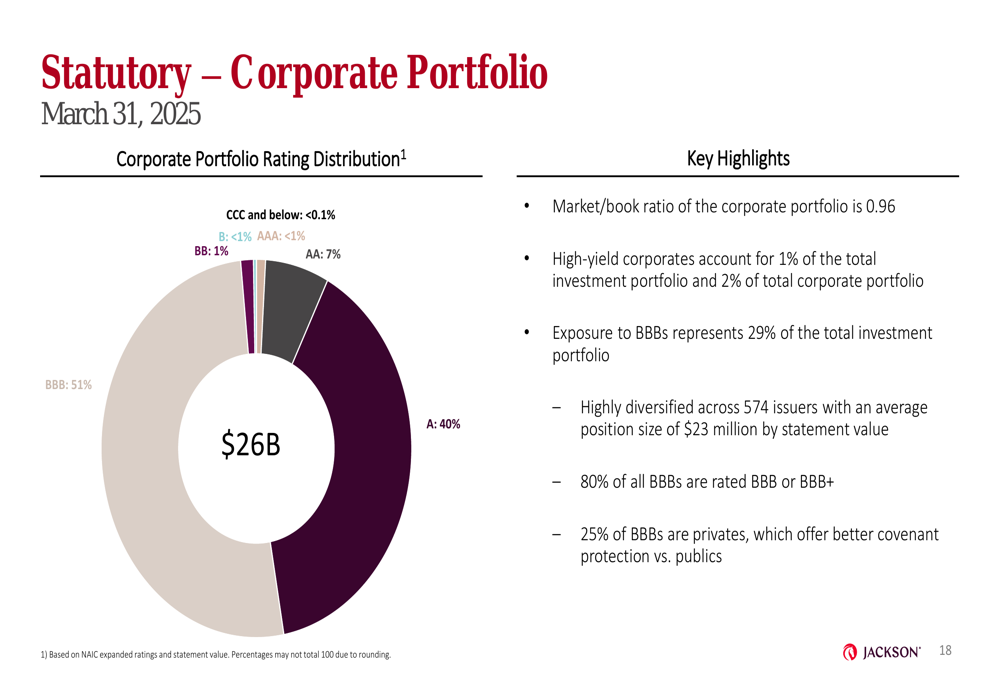
The market-to-book ratio of the corporate portfolio was 0.96, with exposure to BBB-rated securities representing 29% of the total investment portfolio, indicating a conservative approach to credit risk.
Progress on 2025 Financial Targets
Jackson Financial reported substantial progress toward its 2025 financial targets during the first quarter. The company aims to return $700-$800 million to common shareholders in 2025, with $231 million already returned in the first three months of the year.
As shown in the following chart of progress toward 2025 financial targets:
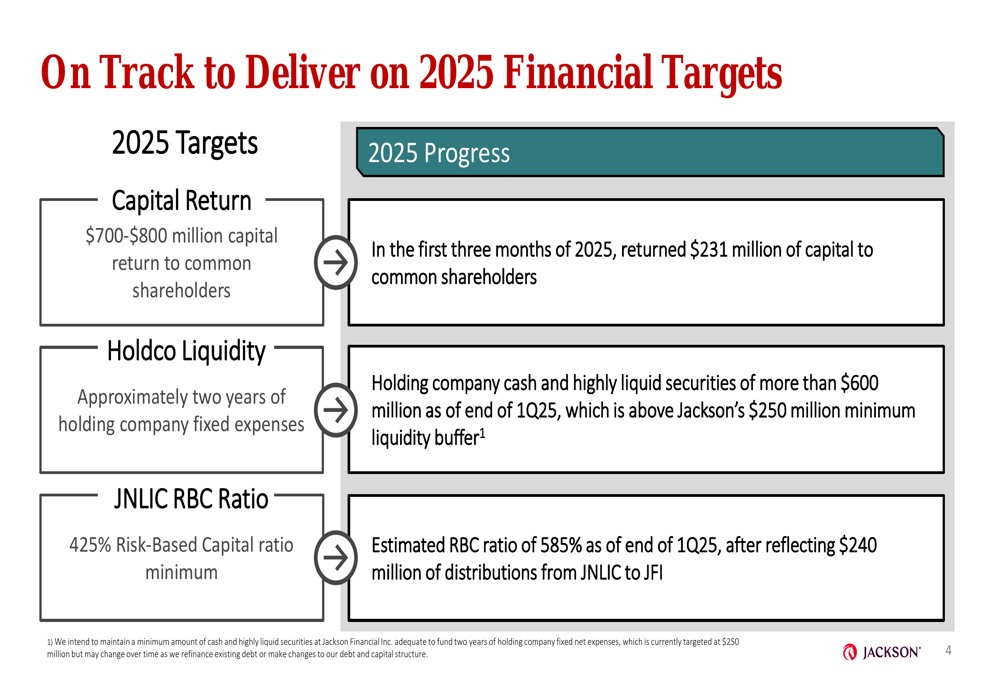
The company’s estimated RBC ratio of 585% significantly exceeds its target minimum of 425%, even after reflecting $240 million of distributions from Jackson National Life Insurance (NSE:LIFI) Company to Jackson Financial Inc. Holding company cash and highly liquid securities exceeded $600 million at the end of Q1 2025, well above Jackson’s $250 million minimum liquidity buffer.
Forward-Looking Statements
Jackson Financial remains well-positioned to deliver on its 2025 financial targets and create long-term value for shareholders. The company’s strong capital position, improved free cash flow generation, and successful retail sales diversification strategy provide a solid foundation for continued growth.
The company’s investment portfolio remains conservatively positioned with high credit quality and diversification across sectors. This approach should help Jackson navigate potential market volatility while maintaining strong capital generation capabilities.
Based on the current trajectory, Jackson appears on track to meet or exceed its capital return target of $700-$800 million for the full year 2025, having already returned $231 million in the first quarter. The robust RBC ratio of 585% provides significant flexibility for future capital management actions while maintaining a strong balance sheet.
Full presentation:
This article was generated with the support of AI and reviewed by an editor. For more information see our T&C.