Palantir to report; Trump on Nvidia chip exports - what’s moving markets

Introduction & Market Context
Kirby Corporation (NYSE:KEX) presented strong second quarter 2025 results during its earnings conference call on July 31, 2025, reporting a 17% year-over-year increase in earnings per share despite mixed market conditions. The company’s performance was primarily driven by robust demand in its marine transportation segment and significant growth in power generation services, particularly from data center customers.
Currently trading near its 52-week low at $81.50, Kirby has maintained solid operational execution while navigating challenges in certain markets. The company’s diversified business model has allowed it to offset softness in conventional oil and gas activities with strength in marine transportation pricing and data center-related power generation services.
Quarterly Performance Highlights
Kirby reported impressive financial results for Q2 2025, with revenues reaching $855.5 million, up 4% year-over-year and 9% sequentially. Operating income rose to $131.8 million, representing a 9% increase from the same period last year and a substantial 25% jump from the first quarter of 2025.
As shown in the following financial summary, earnings per share reached $1.67, up 17% compared to $1.43 in Q2 2024 and 26% higher than the $1.33 reported in Q1 2025:
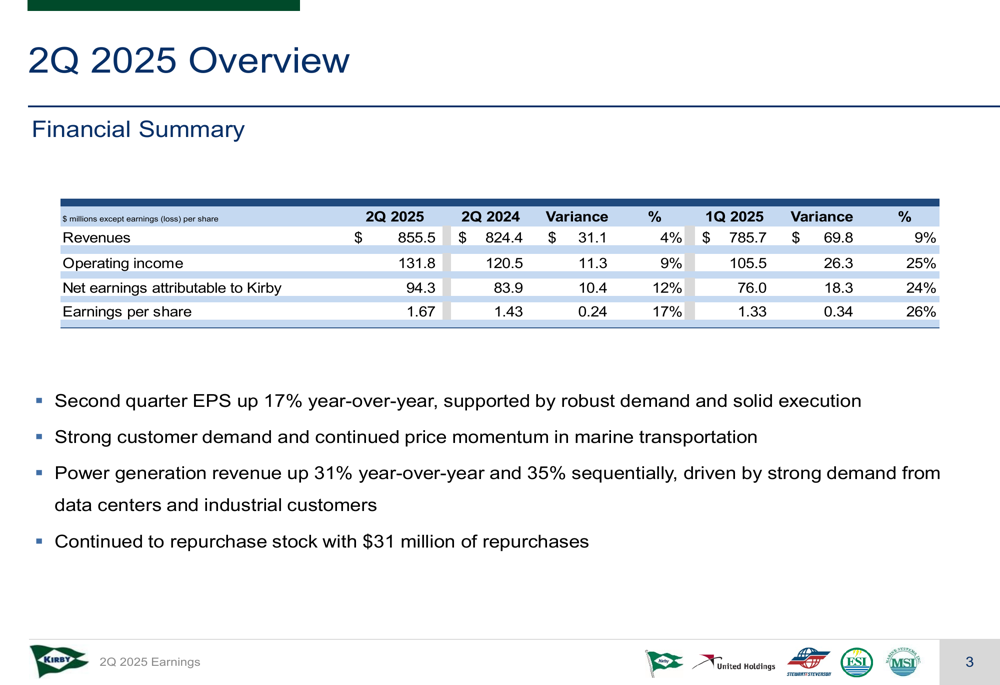
Net earnings attributable to Kirby climbed to $94.3 million, a 12% improvement year-over-year and 24% sequentially. The company continued its share repurchase program, buying back 331,900 shares at an average price of $94.01 for a total of $31.2 million during the quarter.
Detailed Financial Analysis
Marine Transportation Segment
The marine transportation segment, which contributed 58% of total revenue, delivered solid results with revenue of $492.6 million, up 2% year-over-year and 3% sequentially. Operating income for the segment reached $99.1 million, representing a 4% increase from Q2 2024 and a 14% jump from Q1 2025. Operating margins improved to 20.1%, compared to 19.6% in the same period last year.
The detailed breakdown of the marine transportation segment performance shows healthy pricing power in both inland and coastal operations:
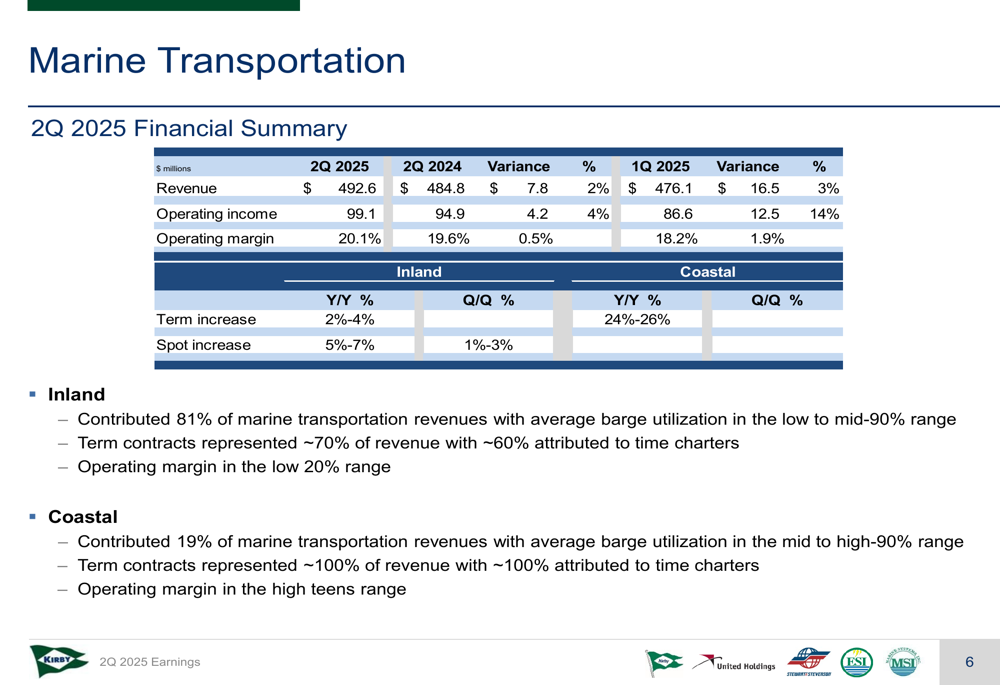
The inland marine business, which represented 81% of marine transportation revenues, benefited from healthy customer demand and disciplined execution. Spot prices increased in the low single digits sequentially and mid-single digits year-over-year, while term contracts were renewed higher in the low to mid-single digits.
The coastal business saw particularly strong market fundamentals due to solid customer demand combined with limited availability of large capacity vessels. Barge utilization remained high in the mid to high-90% range, and term contracts were renewed significantly higher in the mid-20% range year-over-year.
Distribution & Services Segment
The distribution and services segment showed impressive growth, with revenues of $362.9 million, up 7% year-over-year. Operating income surged 20% to $35.4 million, with operating margins expanding to 9.8% from 8.7% in Q2 2024.
The segment’s performance breakdown reveals the diverse revenue streams and highlights the strength in power generation:
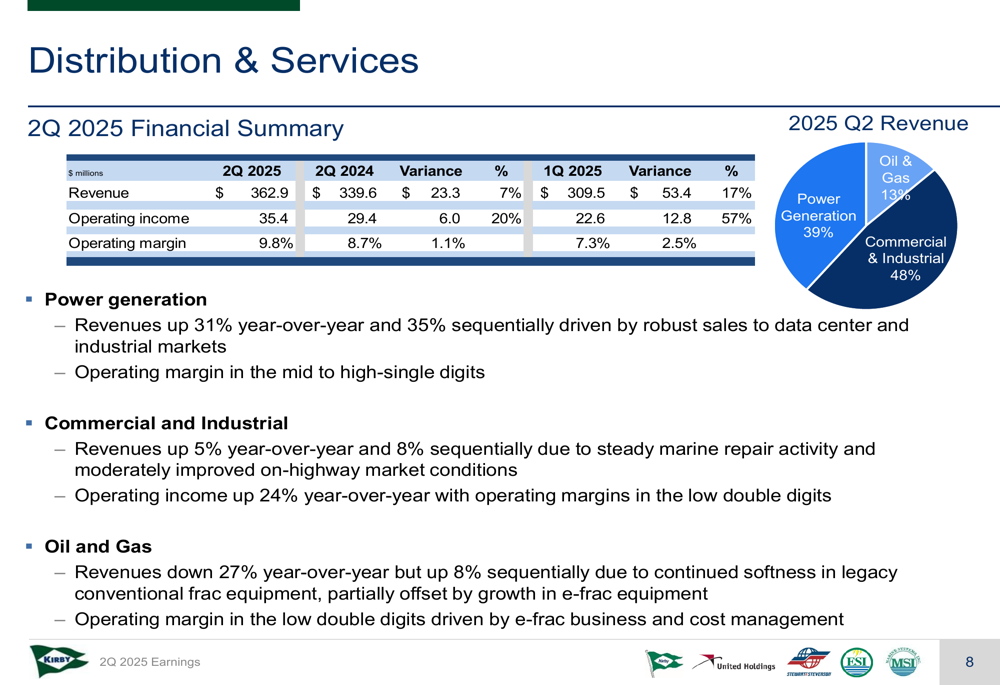
Power generation was the standout performer, with revenues up 31% year-over-year, driven by robust sales from data center and industrial customers. The company continued to win additional projects for backup and critical power applications, building its backlog.
The commercial and industrial subsegment saw a 5% revenue increase year-over-year due to growth in marine repair activity and a moderately recovered on-highway market. Operating income jumped 24% year-over-year due to favorable product mix and ongoing cost control.
The oil and gas subsegment faced ongoing softness in conventional activity, resulting in a 27% lower revenue year-over-year. However, operating income increased by 182% driven by e-frac equipment sales and effective cost management.
Strategic Initiatives
Kirby maintained a strong balance sheet while continuing to invest in growth and return capital to shareholders. As of June 30, 2025, the company reported total debt of $1.1 billion and cash and cash equivalents of $68 million, resulting in available liquidity of $332 million.
The company’s capital allocation strategy and financial position are summarized below:
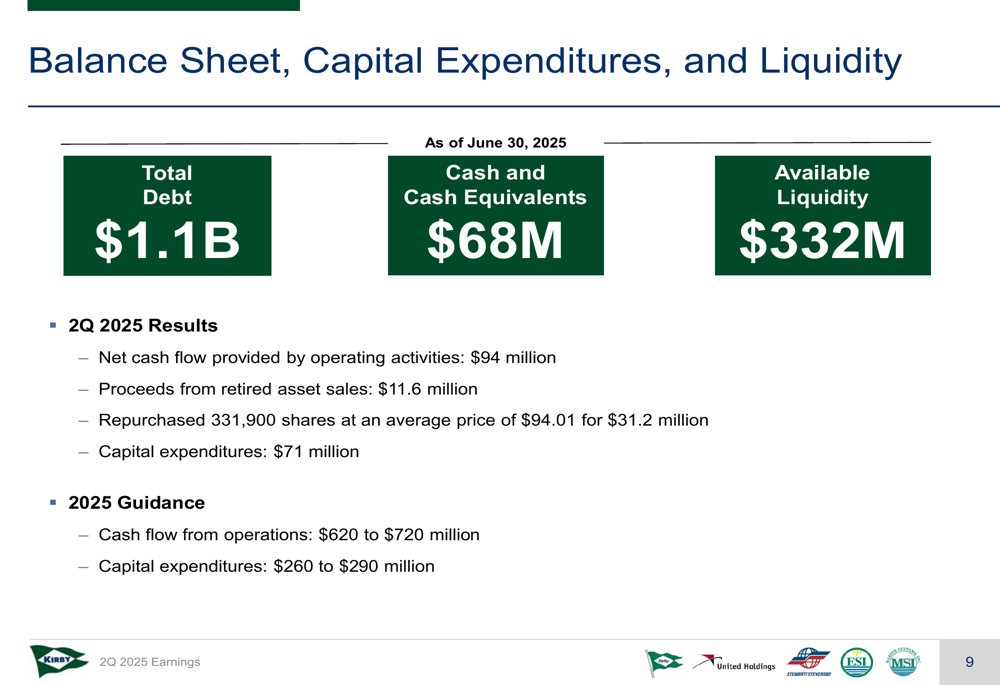
Net cash flow provided by operating activities was $94 million in Q2 2025, while capital expenditures totaled $71 million. The company expects cash flow from operations to reach $620 to $720 million for the full year 2025, with capital expenditures projected between $260 and $290 million.
Kirby’s fleet management strategy remains disciplined, with careful additions and retirements of barges. The inland fleet consisted of 1,109 barges with 24.5 million barrels capacity at the end of Q2, while the coastal fleet remained stable at 28 barges with 2.9 million barrels capacity.
Forward-Looking Statements
Kirby provided a positive outlook for the remainder of 2025, with expectations for continued growth in both main segments despite some challenges in certain markets.
For the marine transportation segment, the company expects constructive market dynamics to continue, supported by limited new barge construction:
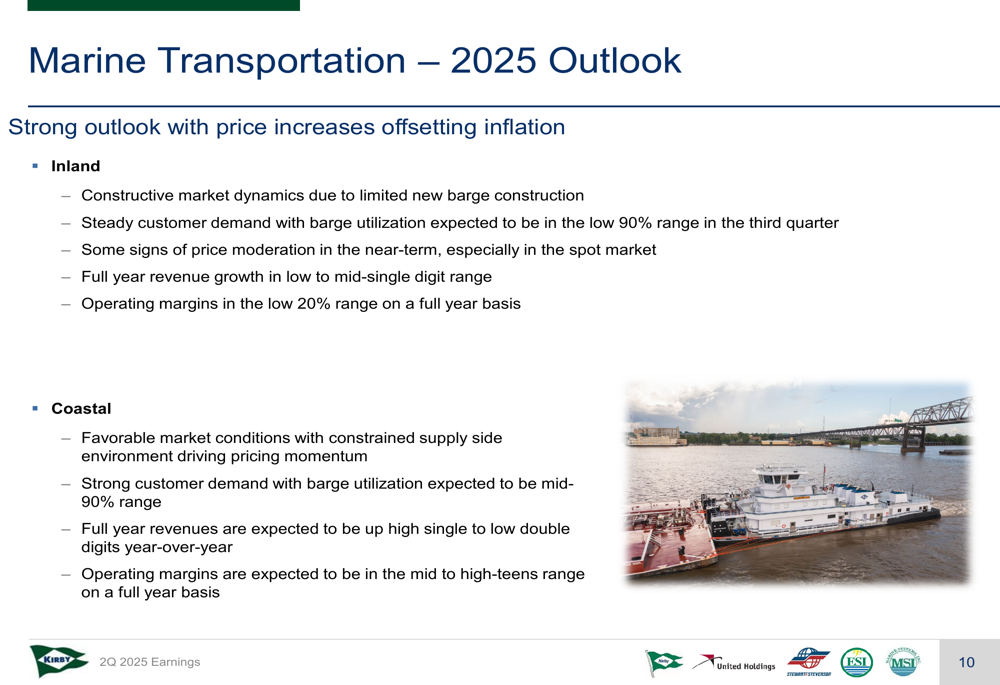
The inland marine business is expected to maintain steady customer demand with barge utilization in the low 90% range in the third quarter. While there are some signs of price moderation in the near term, especially in the spot market, the company still anticipates full-year revenue growth in the low to mid-single digit range with operating margins in the low 20% range.
The coastal business outlook remains favorable, with strong customer demand and constrained supply driving pricing momentum. Full-year revenues are expected to increase in the high single to low double digits, with operating margins in the mid to high-teens range.
For the distribution and services segment, the company expects strength in power generation to offset softness in the conventional oil and gas market:
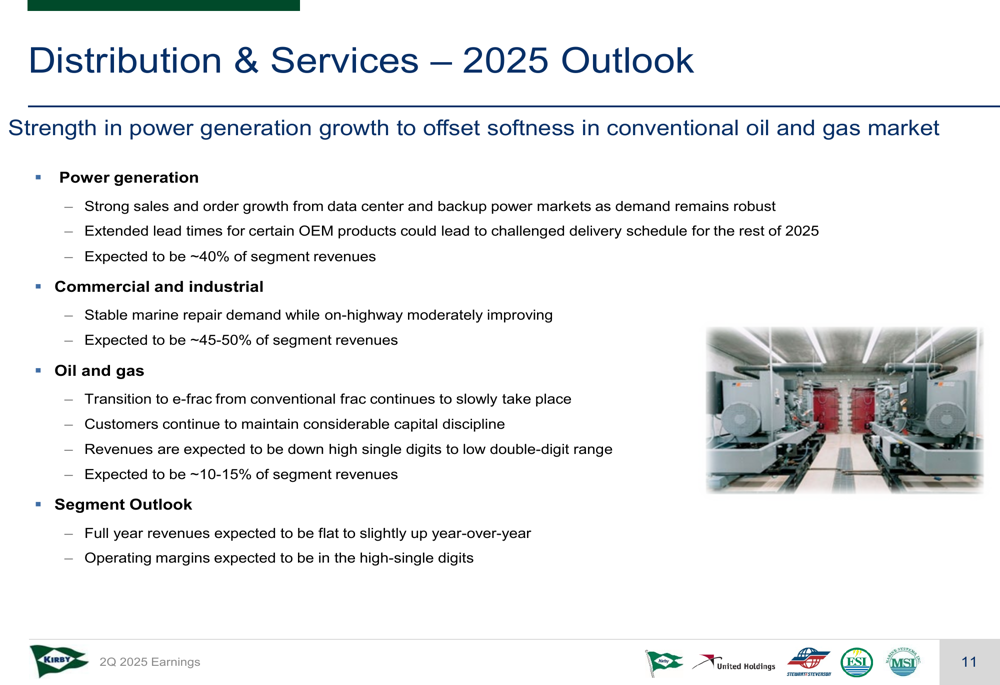
Power generation is projected to remain strong, with continued sales and order growth from data center and backup power markets. This subsegment is expected to contribute approximately 40% of segment revenues. The commercial and industrial subsegment should see stable marine repair demand and moderately improving on-highway business, contributing 45-50% of segment revenues.
The oil and gas subsegment faces ongoing challenges as the transition from conventional frac to e-frac continues at a slow pace, with revenues expected to decline in the high single to low double-digit range. Overall, the segment’s full-year revenues are expected to be flat to slightly up year-over-year, with operating margins in the high-single digits.
Despite some market uncertainties, Kirby Corporation appears well-positioned to maintain its growth trajectory through 2025, leveraging its strong market position in marine transportation and capitalizing on the growing demand for power generation solutions, particularly in the data center market.
Full presentation:
This article was generated with the support of AI and reviewed by an editor. For more information see our T&C.