Gold prices hit 4-month high on Fed easing hopes, tariff uncertainty

Introduction & Market Context
Latham Group Inc. (NASDAQ:SWIM), a leading provider of residential swimming pools and accessories, reported its second quarter 2025 results on August 5, showing revenue and profitability growth despite a challenging market environment. The company continues to position itself as a long-term growth story in the residential pool industry, leveraging its strong brand and diverse product portfolio.
The pool industry remains in what Latham describes as a "market trough," with new U.S. pool starts expected to remain flat in 2025 compared to 2024. Despite this challenging backdrop, Latham has managed to outperform the broader market through strategic initiatives and product diversification.
Quarterly Performance Highlights
Latham Group reported net sales of $172.6 million for Q2 2025, representing a 7.8% increase from $160.1 million in the same period last year. This growth comes despite the flat overall market conditions, highlighting the company’s ability to gain market share.
Adjusted EBITDA showed even stronger improvement, reaching $39.9 million in Q2 2025, up 15.7% from $34.5 million in Q2 2024. The adjusted EBITDA margin expanded to 23.1%, a significant improvement from 21.5% in the prior-year period, demonstrating enhanced operational efficiency.
As shown in the following quarterly financial reconciliation:
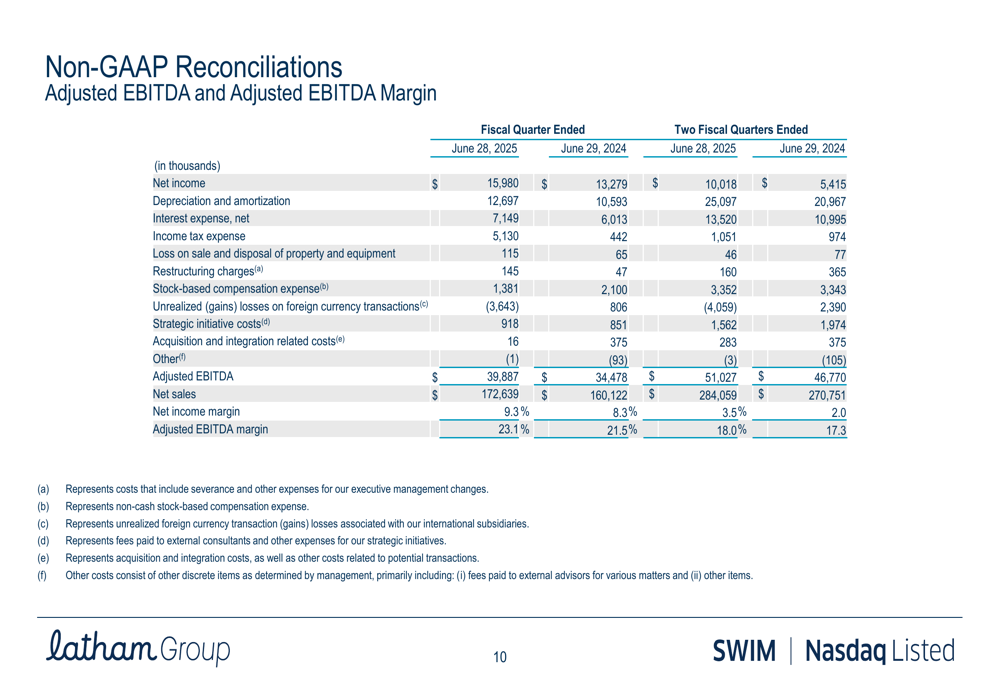
This performance represents a continuation of the company’s recovery trajectory. In the previous quarter (Q1 2025), Latham had reported a narrowed net loss of $0.05 per share on revenue of $111.4 million, with a gross margin of 30%.
Strategic Initiatives
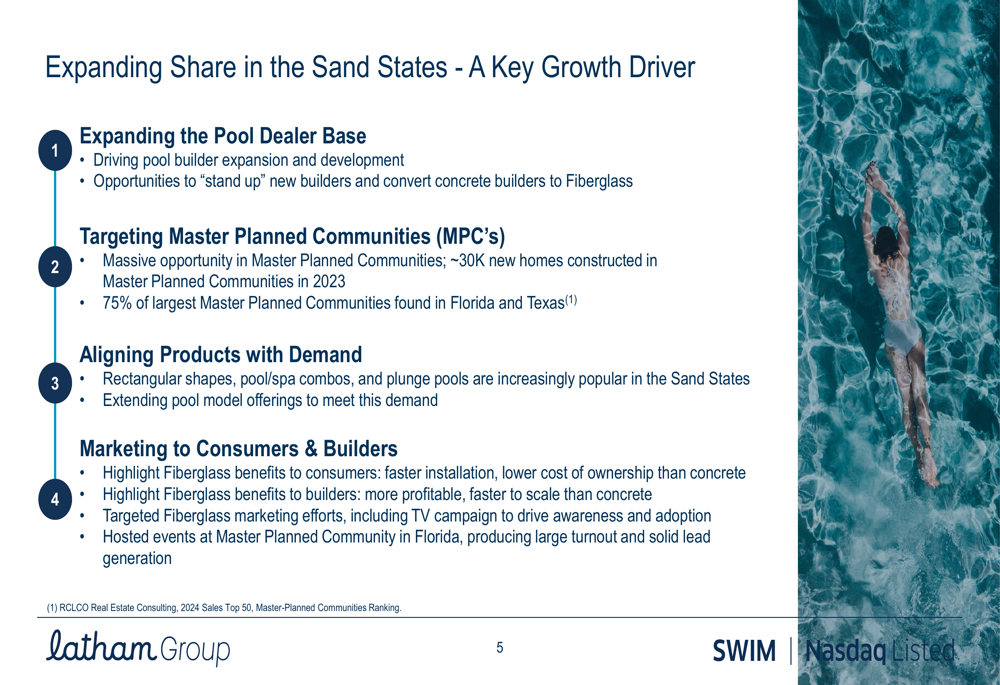
Latham’s growth strategy centers around several key initiatives, with a particular focus on expanding its presence in the "Sand States" markets, primarily Florida and Texas, where 75% of the largest Master Planned Communities are located.
The company is implementing a multi-faceted approach to capture market share in these regions, including expanding its pool dealer base, targeting Master Planned Communities, aligning products with regional demand preferences, and implementing targeted marketing efforts to both consumers and builders.
As illustrated in the company’s Sand States expansion strategy:
Another key growth driver is Latham’s balanced product portfolio, which provides diversification and multiple revenue streams. The company generates 51% of its net sales from in-ground swimming pools, 26% from covers, and 23% from liners. Geographically, 80% of sales come from the U.S. market.
The company’s product mix and market positioning are detailed in the following slide:
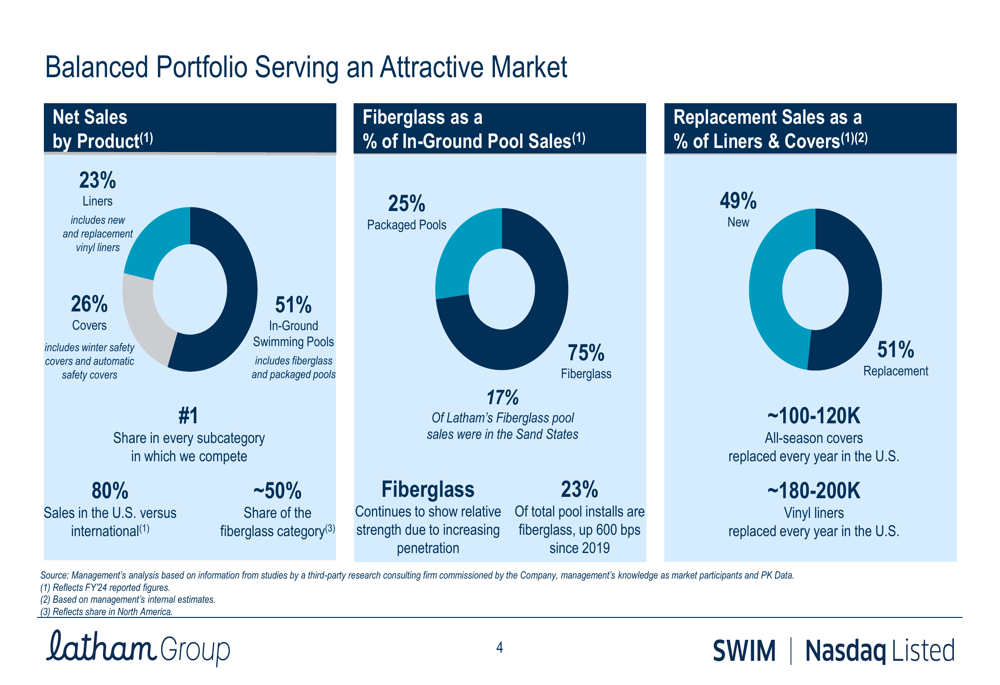
Latham continues to benefit from the increasing adoption of fiberglass pools, which have grown from 17% to 23% of pool installations since 2019. The company holds approximately 50% share of the fiberglass category, positioning it well to capitalize on this trend.
Forward-Looking Statements
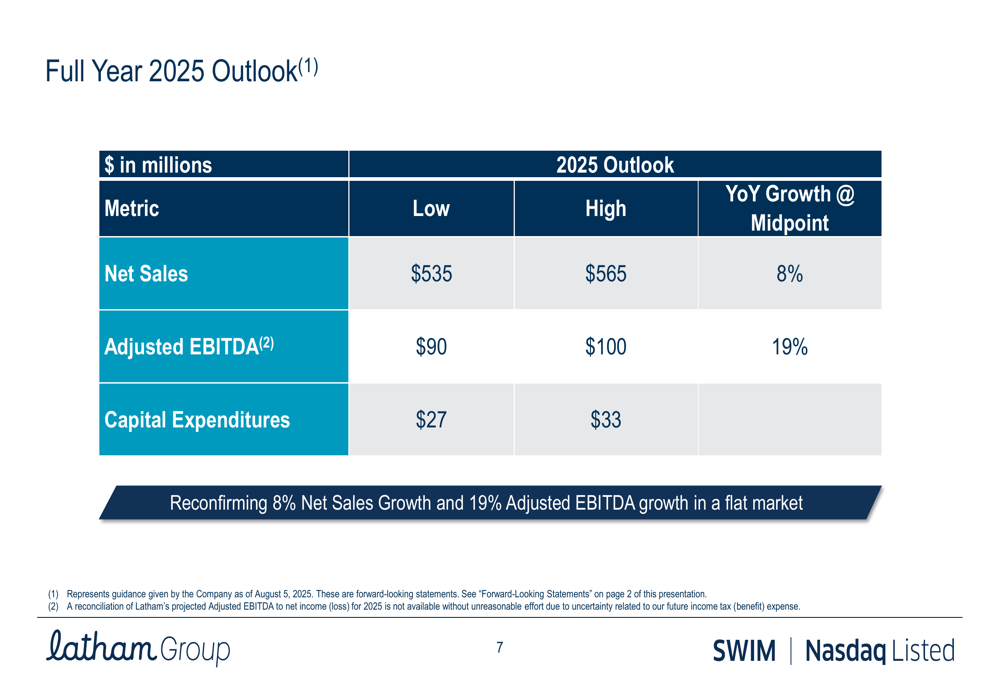
Latham Group reaffirmed its full-year 2025 outlook, projecting net sales between $535 million and $565 million, representing 8% year-over-year growth at the midpoint. Adjusted EBITDA is expected to be between $90 million and $100 million, a 19% increase at the midpoint compared to 2024.
Capital expenditures for 2025 are projected to be between $27 million and $33 million, supporting the company’s growth initiatives and operational improvements.
The company’s full-year guidance is summarized in the following outlook slide:
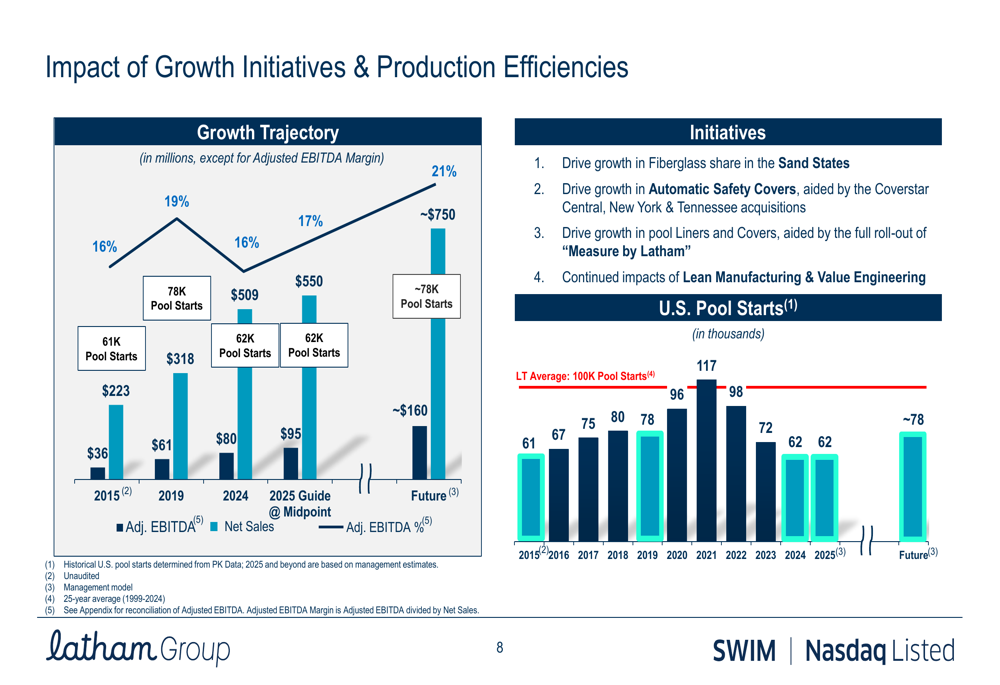
Looking beyond 2025, Latham has outlined a long-term growth trajectory, with ambitions to reach approximately $750 million in revenue and $160 million in adjusted EBITDA. This growth is expected to be driven by increasing fiberglass share in Sand States, growth in automatic safety covers, expansion in pool liners and covers, and continued manufacturing efficiencies.
The company’s long-term growth initiatives and trajectory are illustrated here:
Financial Position and Debt
While Latham’s operational performance shows improvement, the company’s debt levels remain a consideration for investors. As of June 28, 2025, Latham reported total debt of $281.5 million and net debt of $254.5 million, resulting in a net debt leverage ratio of 3.01x.
On a pro forma basis, adjusting for recent acquisitions, the net debt leverage ratio stands at 2.95x, as shown in the following reconciliation:
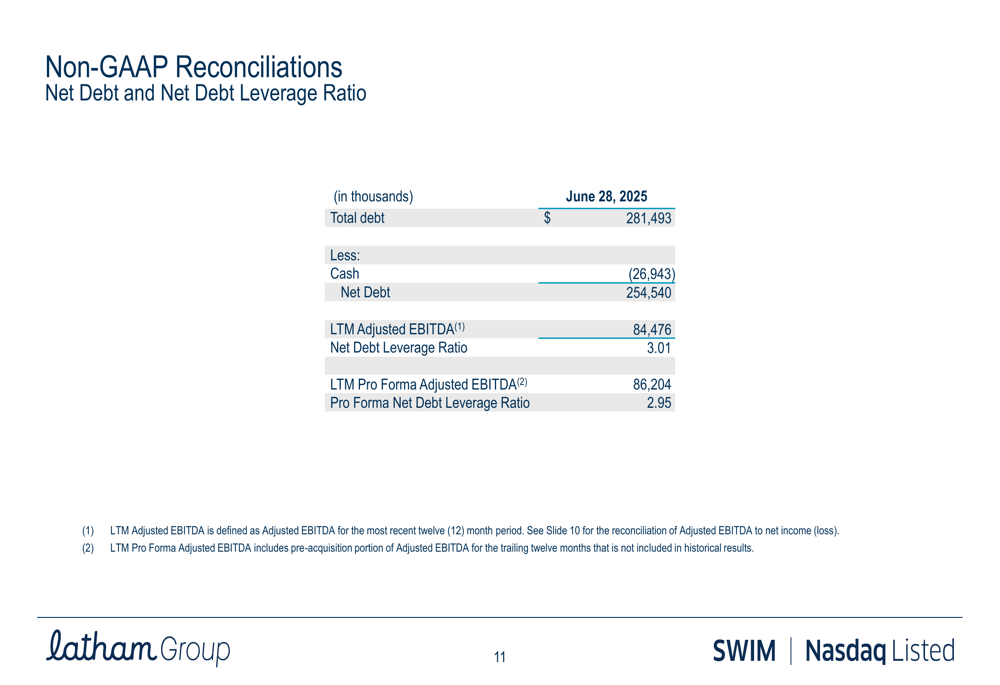
This leverage ratio, while manageable, could limit financial flexibility if market conditions deteriorate. However, the company’s improving EBITDA should help gradually reduce this ratio if current performance trends continue.
Competitive Industry Position
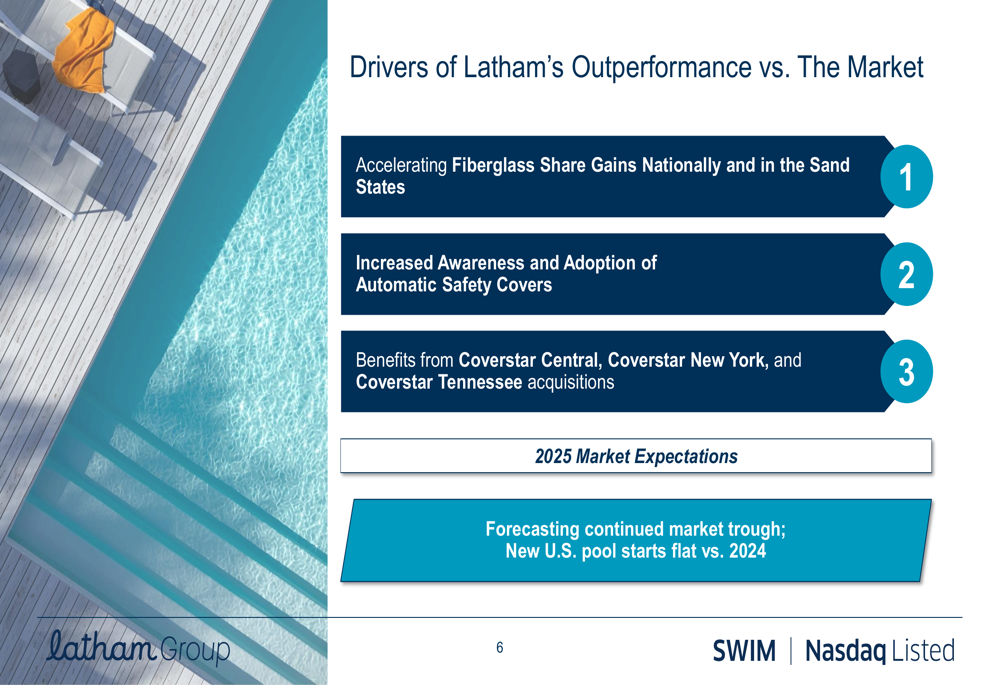
Latham identifies several factors driving its outperformance relative to the broader market. These include accelerating fiberglass share gains both nationally and in the Sand States, increased awareness and adoption of automatic safety covers, and benefits from strategic acquisitions including Coverstar Central, Coverstar New York, and Coverstar Tennessee.
The company’s key competitive advantages and market drivers are summarized in this slide:
Latham continues to position itself as a compelling long-term growth story in the residential pool market, highlighting its leading consumer brand status, unique direct-to-homeowner model, broad portfolio of branded products, and multiple levers for efficiency improvement as volumes increase.
As the company navigates the current market trough, its diversified product mix and strategic focus on high-growth segments appear to be yielding positive results, as evidenced by the Q2 2025 performance metrics. However, investors should continue to monitor the company’s progress in reducing leverage and expanding in key markets as indicators of long-term success.
Full presentation:
This article was generated with the support of AI and reviewed by an editor. For more information see our T&C.