Fed’s Powell opens door to potential rate cuts at Jackson Hole

Introduction & Market Context
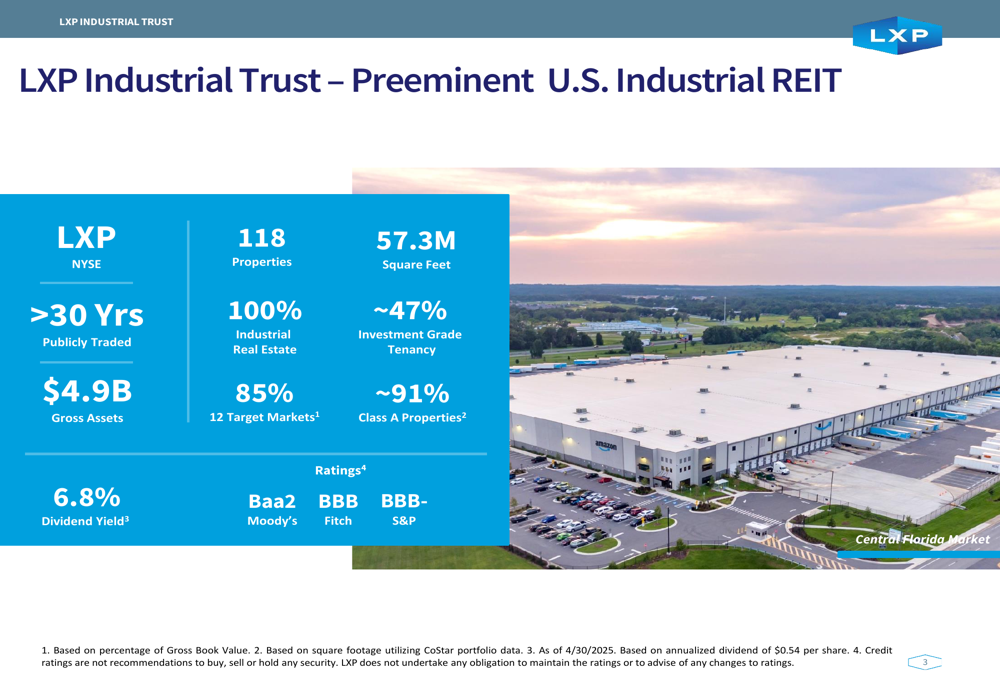
LXP Industrial Trust (NYSE:LXP) released its first quarter 2025 investor presentation on May 1, highlighting solid operational performance and strategic positioning to capitalize on the reshoring of manufacturing to the United States. The industrial REIT reported same-store NOI growth of 5.2% and an Adjusted Company FFO of $0.16 per share, while continuing to execute on its strategy of focusing on high-growth markets in the Sunbelt and lower Midwest.
The company’s presentation emphasized its pure-play industrial portfolio comprising 118 properties totaling 57.3 million square feet, with 93.3% occupancy and a weighted average lease term of 5.3 years. With 91% of its properties classified as Class A and an average building age of just 9.5 years, LXP has positioned itself as a modern industrial landlord catering to high-quality tenants.
As shown in the following overview of LXP’s portfolio and key metrics:
Quarterly Performance Highlights
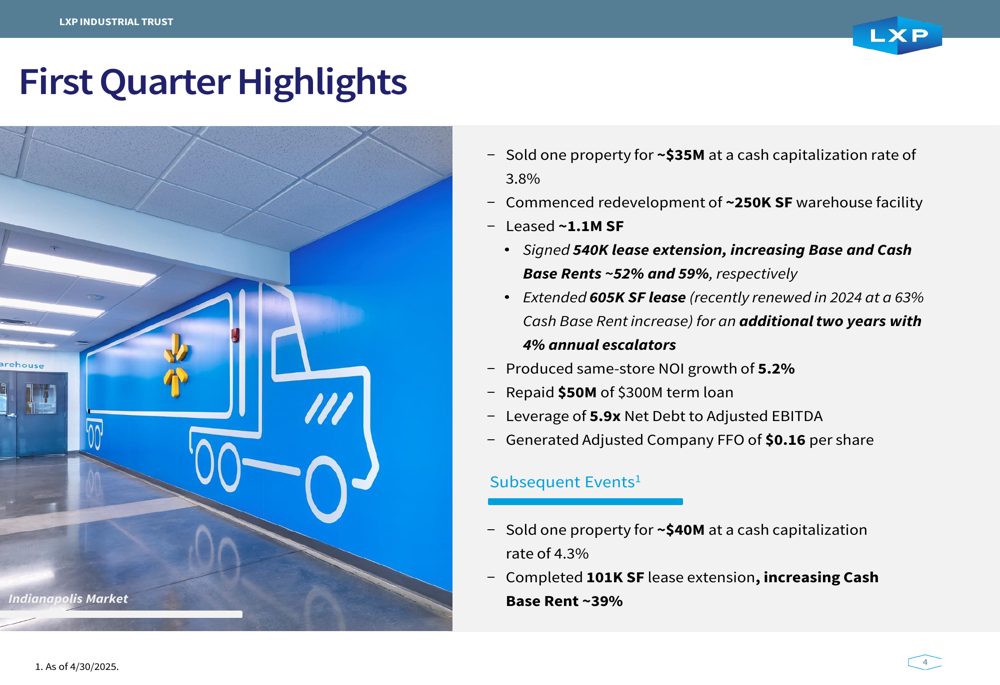
LXP reported several notable achievements during the first quarter of 2025. The company completed approximately 1.1 million square feet of leasing, including a 540,000 square foot lease extension that increased base and cash base rents by approximately 52% and 59%, respectively. Additionally, LXP extended a 605,000 square foot lease for two additional years with 4% annual escalators, building on a recent renewal that had already secured a 63% cash base rent increase.
On the capital recycling front, LXP sold one property for approximately $35 million at a 3.8% capitalization rate during the quarter, and subsequently completed another sale for approximately $40 million at a 4.3% capitalization rate. The company also strengthened its balance sheet by repaying $50 million of a $300 million term loan, maintaining a Net Debt to Adjusted EBITDA ratio of 5.9x.
The following slide details these first quarter highlights:
Strategic Market Positioning
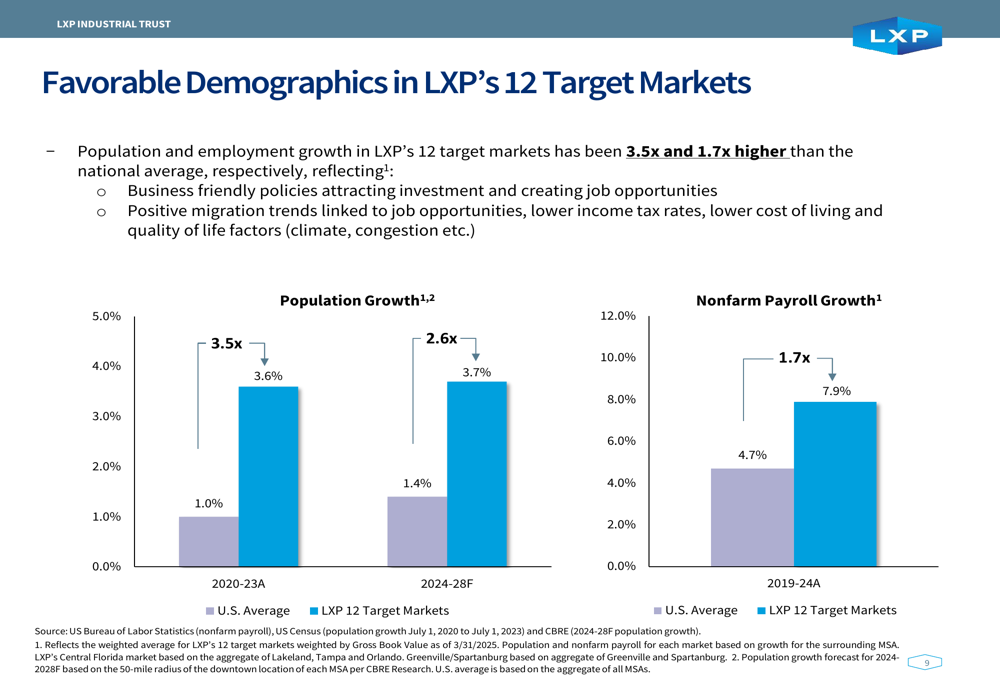
A key element of LXP’s strategy is its focus on 12 target markets in the Sunbelt and lower Midwest regions, which account for 85% of the company’s gross book value. These markets are characterized by business-friendly environments and strong demographic trends, with population growth 3.5 times higher and job growth 1.7 times higher than the national average.
The company’s geographic focus is illustrated in this regional breakdown:
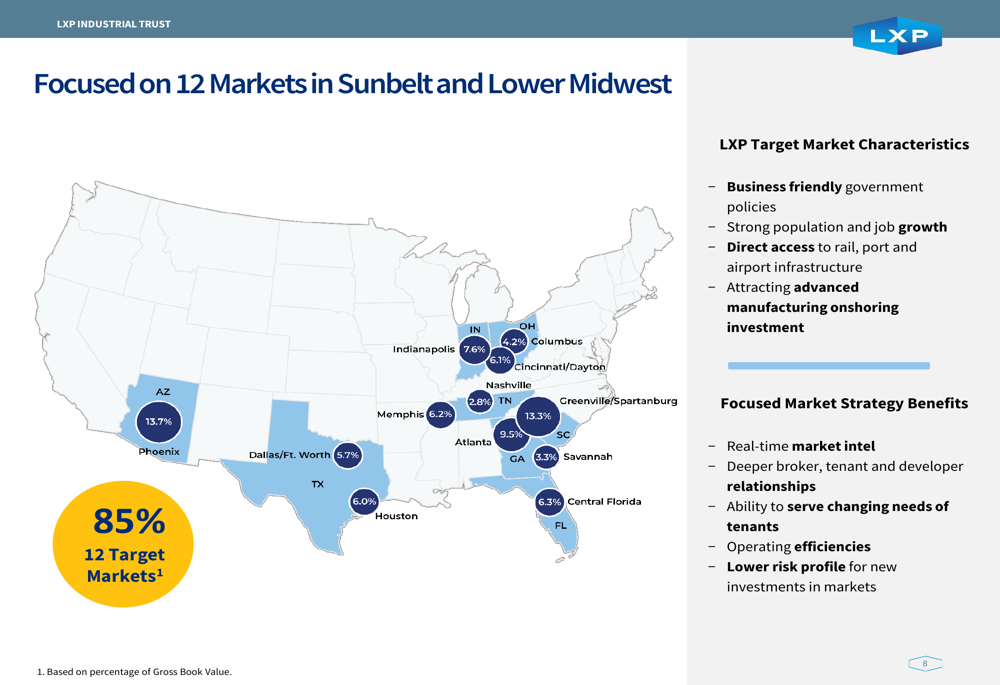
LXP is strategically positioned to benefit from the ongoing reshoring of manufacturing to the United States, with over $150 billion of advanced manufacturing investment announced in its 12 target markets. The presentation highlighted that manufacturing sector construction spending has increased by more than 200% compared to 2017-2019 levels, driven by federal policy shifts toward critical industries and supply chain resilience.
The demographic advantages of LXP’s target markets are clearly demonstrated in the following comparison:
Growth Drivers & Outlook
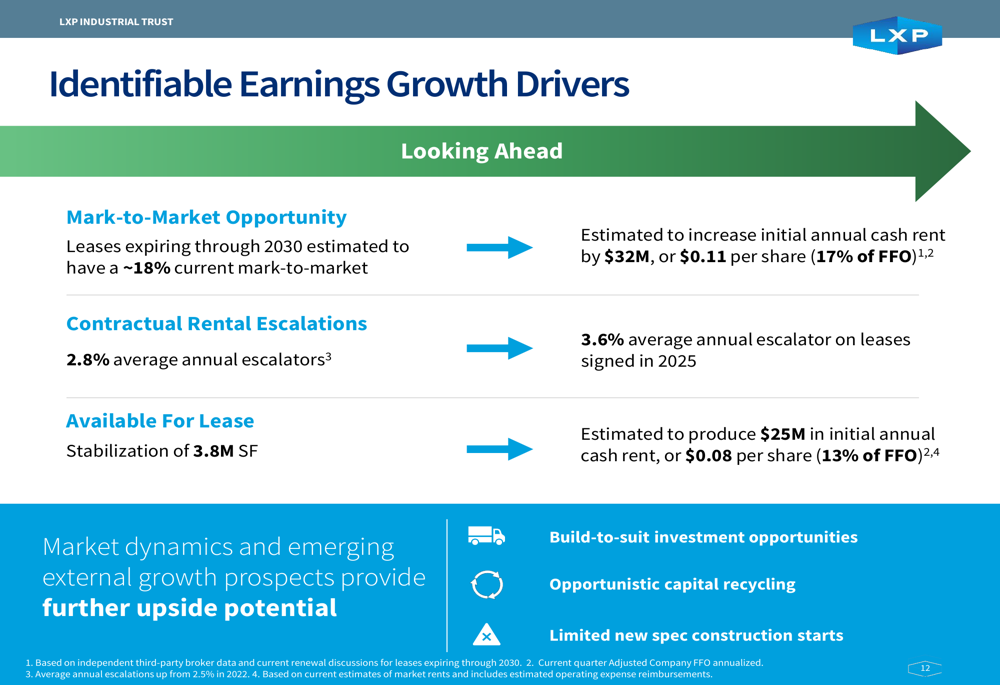
LXP identified several clear pathways to earnings growth that require limited incremental capital investment. With approximately 64% of its portfolio expiring through 2030 and current mark-to-market on rents estimated at approximately 18%, the company has significant embedded rent growth potential. Additionally, LXP has 3.8 million square feet of space available for lease, which represents a substantial opportunity for NOI growth as these spaces are occupied.
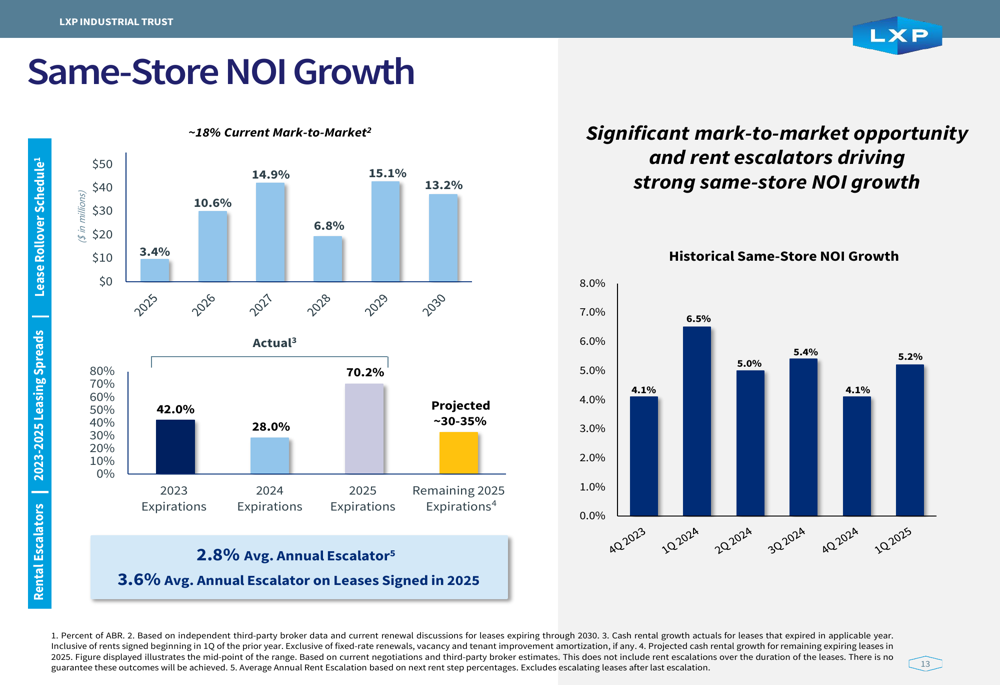
The company’s leasing spreads have been robust, reaching 42% in 2023 and projected at approximately 30-35% for the remainder of 2025. Average annual rent escalators currently stand at 2.8% and are trending upward, with new leases signed in 2025 featuring 3.6% average annual escalators.
These growth drivers are summarized in the following slide:
The company’s historical same-store NOI growth has been strong and consistent, as illustrated in this performance chart:
Financial Position
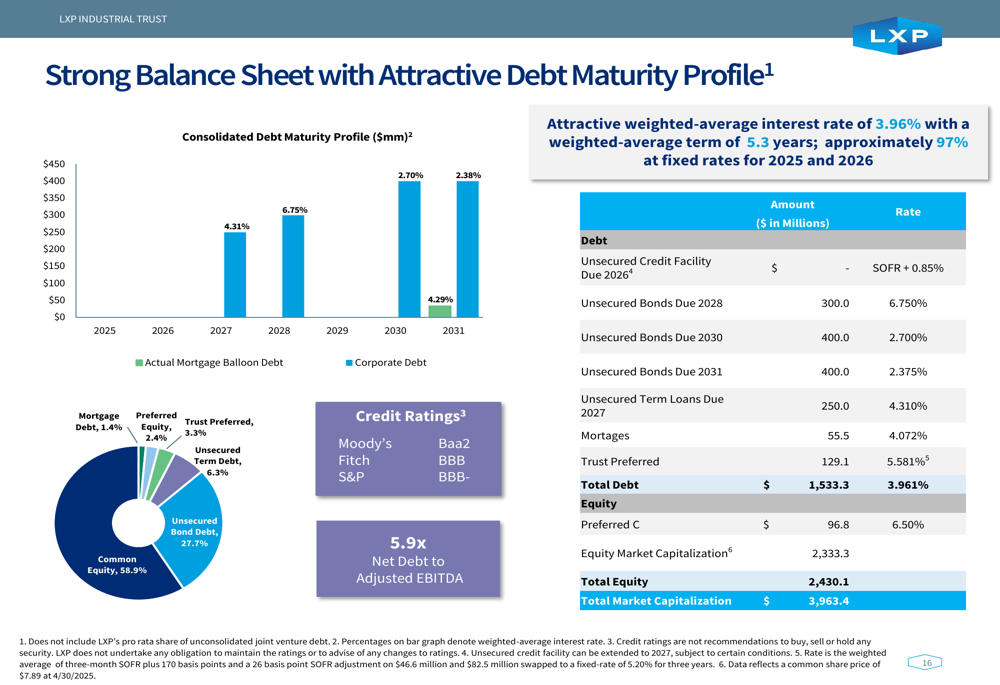
LXP maintains a strong balance sheet with an attractive debt maturity profile. The company’s weighted-average interest rate is 3.96% with a weighted-average term of 5.3 years, and approximately 97% of its debt is at fixed rates for 2025 and 2026. This provides significant protection against potential interest rate volatility.
The company’s debt metrics include a Net Debt to Adjusted EBITDA ratio of 5.9x, with management indicating a clear path to reaching the low to mid-5x range. This financial flexibility positions LXP to pursue investment opportunities, including build-to-suit development on its owned land bank sites.
The following slide details LXP’s debt maturity profile and key financial metrics:
Tenant Diversification and Credit Quality
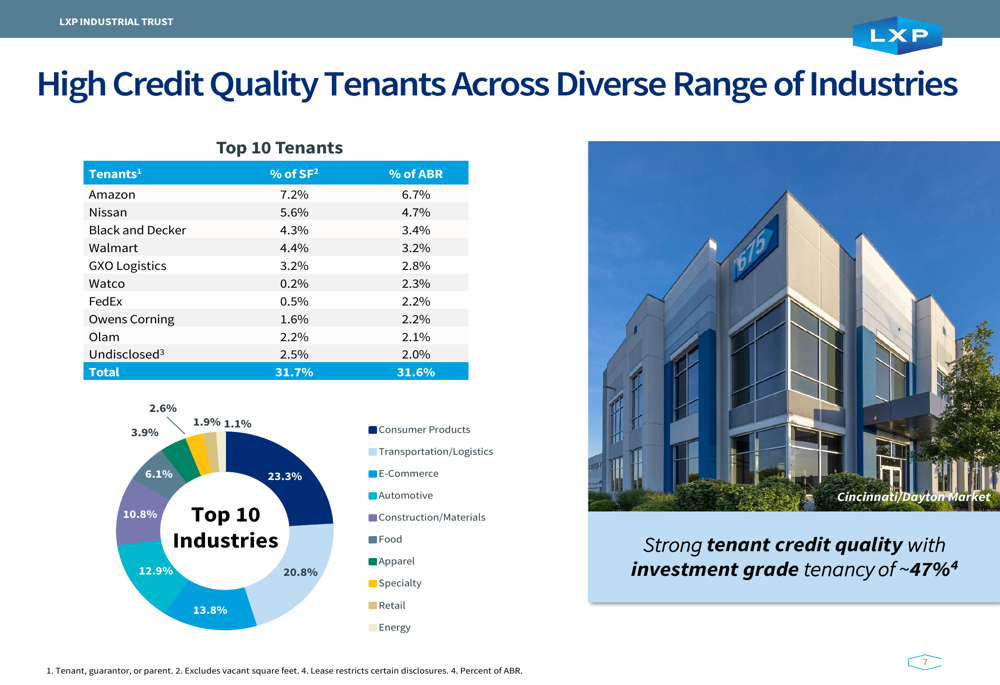
LXP’s portfolio features high credit quality tenants across diverse industries, with approximately 47% of tenancy rated investment grade. The top 10 tenants, which include major companies such as Amazon (NASDAQ:AMZN), Nissan (OTC:NSANY), Black and Decker, and Walmart (NYSE:WMT), represent 31.6% of annual base rent. This diversification across industries helps mitigate sector-specific risks.
The company’s tenant composition is detailed in this breakdown:
Forward-Looking Statements
Looking ahead, LXP is well-positioned to capitalize on favorable industrial real estate trends, particularly the reshoring of manufacturing to the United States. The company’s focus on modern, Class A properties in high-growth markets should continue to drive strong leasing activity and rent growth.
With clear internal growth drivers from mark-to-market opportunities on lease expirations, contractual rent escalations, and lease-up of available space, LXP has outlined a path to continued FFO growth. The company’s strong balance sheet and strategic market positioning provide a solid foundation for sustainable performance in the industrial real estate sector.
Based on the Q4 2024 earnings report, LXP had previously guided for 2025 FFO between $0.61 and $0.65 per diluted share, with same-store NOI growth of 3-4%. The Q1 2025 results, with same-store NOI growth of 5.2% and quarterly FFO of $0.16 per share (annualizing to $0.64), suggest the company is performing in line with or slightly above these expectations.
Full presentation:
This article was generated with the support of AI and reviewed by an editor. For more information see our T&C.