Can anything shut down the Gold rally?

Introduction & Market Context
Moody’s Corporation (NYSE:MCO) delivered record first-quarter results for 2025 but tempered expectations for the full year during its earnings presentation on April 22. The company’s stock was trading up 1.03% at the time of the presentation, reflecting investors’ positive reception of the strong quarterly performance despite the reduced full-year outlook.
The financial services giant reported impressive growth across both its Moody’s Investors Service (MIS) and Moody’s Analytics (MA) segments, with private credit emerging as a significant growth driver. However, the company revised several key metrics downward for its full-year 2025 guidance compared to projections made in February.
Quarterly Performance Highlights
Moody’s delivered a record first quarter with revenue up 8% across both business segments. The company achieved an Adjusted Operating Margin of 51.7%, up 100 basis points year-over-year, while Adjusted Diluted EPS increased 14% to $3.83.
As shown in the following key takeaways slide, both business segments contributed to the strong performance, with MIS achieving its highest quarterly revenue on record at $1.1 billion and MA showing consistent growth in Annual Recurring Revenue (ARR):
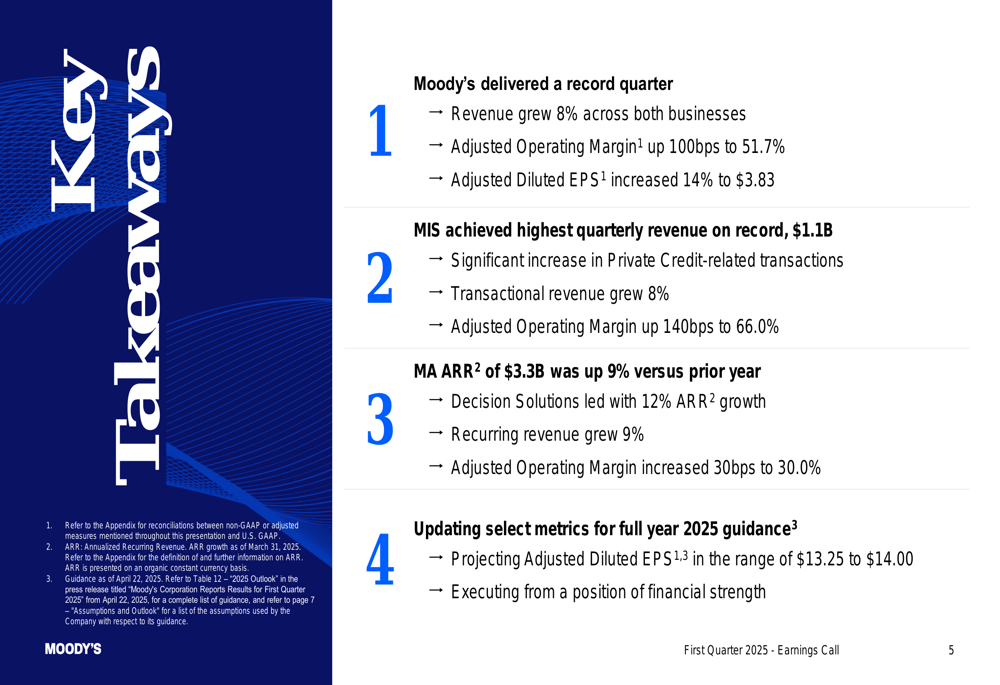
The ratings business benefited significantly from an increase in Private Credit-related transactions, while MA’s Decision Solutions led growth with a 12% increase in ARR. These results build on Moody’s strong performance in Q4 2024, when the company reported a 20% revenue increase to over $7 billion for the full year.
Segment Analysis: MIS
Moody’s Investors Service delivered record results in Q1 2025, with total revenue reaching $1,065 million, an 8% increase year-over-year. The growth was consistent across all rating categories, with Corporate Finance Group (CFG) revenue at $564 million, Structured Finance Group (SFG) at $138 million, Financial Institutions Group (FIG) at $191 million, and Public, Project and Infrastructure Finance (PPIF) at $163 million.
The following slide details MIS’s performance, showing the breakdown by segment and highlighting the 140 basis point improvement in Adjusted Operating Margin to 66.0%:
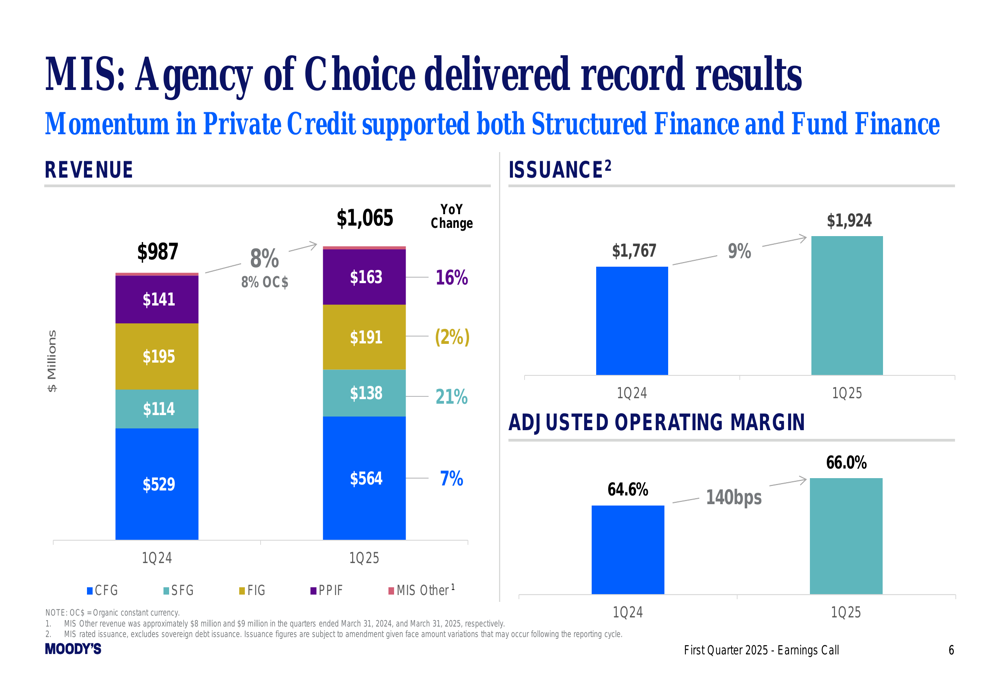
Issuance volume increased by 9% compared to the same period last year, driven by a significant increase in Private Credit-related transactions. This aligns with comments from Moody’s Q4 2024 earnings call, where management highlighted private credit as a key growth area, noting they had rated nearly 400 private credit-related transactions in 2024.
Segment Analysis: MA
Moody’s Analytics continued to demonstrate strong and durable growth in Q1 2025. MA’s ARR reached $3.3 billion, representing a 9% increase compared to the prior year. The segment maintained impressive metrics with recurring revenue comprising 96% of total revenue and a retention rate of 93%.
The following slide illustrates MA’s performance across different product categories, with KYC solutions showing the strongest growth at 17%:
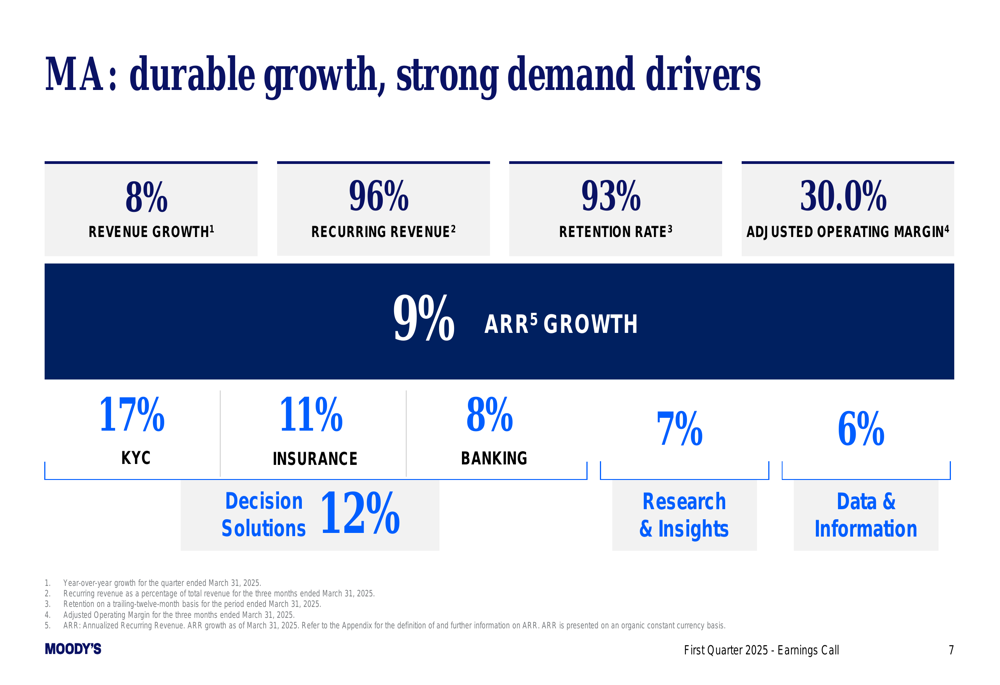
Decision Solutions led the way with 12% ARR growth, followed by Insurance at 11% and Banking at 8%. Research & Insights grew at 7%, while Data & Information increased by 6%. MA’s Adjusted Operating Margin improved by 30 basis points to 30.0%.
The detailed breakdown of MA’s quarterly performance further illustrates the segment’s growth trajectory:
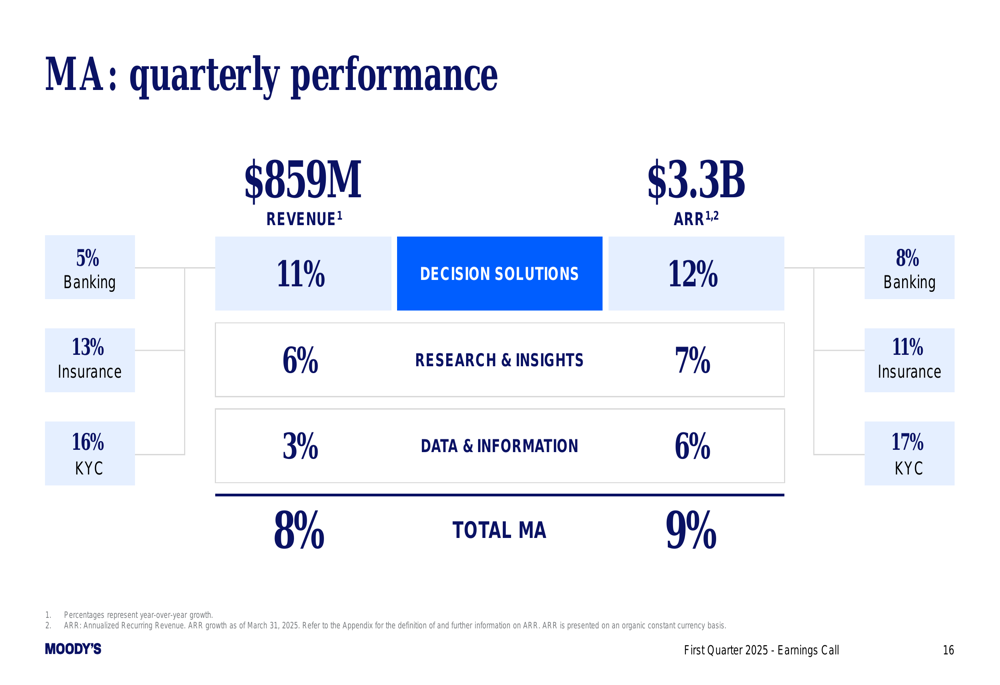
This performance is consistent with the company’s Q4 2024 results, where MA reported 10% recurring revenue growth and 9% ARR growth, with Decision Solutions reaching $1.4 billion in ARR.
Forward-Looking Statements
Despite the strong quarterly performance, Moody’s revised its full-year 2025 outlook downward compared to guidance provided in February. The company now projects revenue growth in the mid-single digit percentage range, down from the previous high-single digit range forecast.
The following slide outlines the updated guidance for MCO overall:
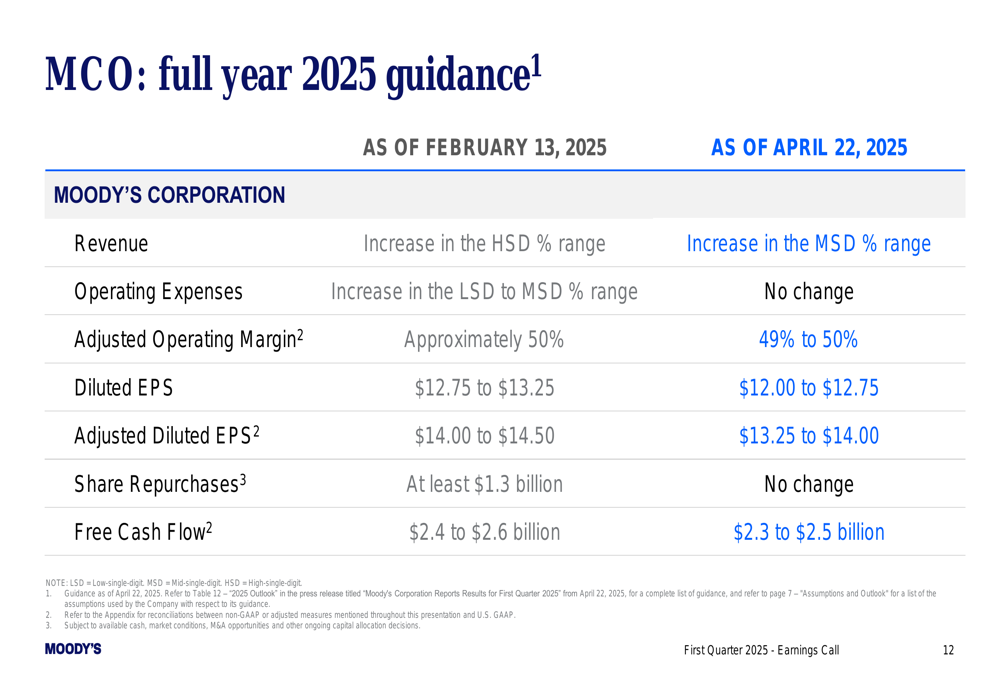
Notably, Adjusted Diluted EPS guidance was lowered to a range of $13.25 to $14.00, compared to the previous $14.00 to $14.50. Adjusted Operating Margin is now expected to be between 49% and 50%, slightly below the approximately 50% previously projected. Free Cash Flow guidance was also reduced from $2.4-$2.6 billion to $2.3-$2.5 billion.
The segment-specific guidance shows that MIS expectations have been tempered more significantly than MA:
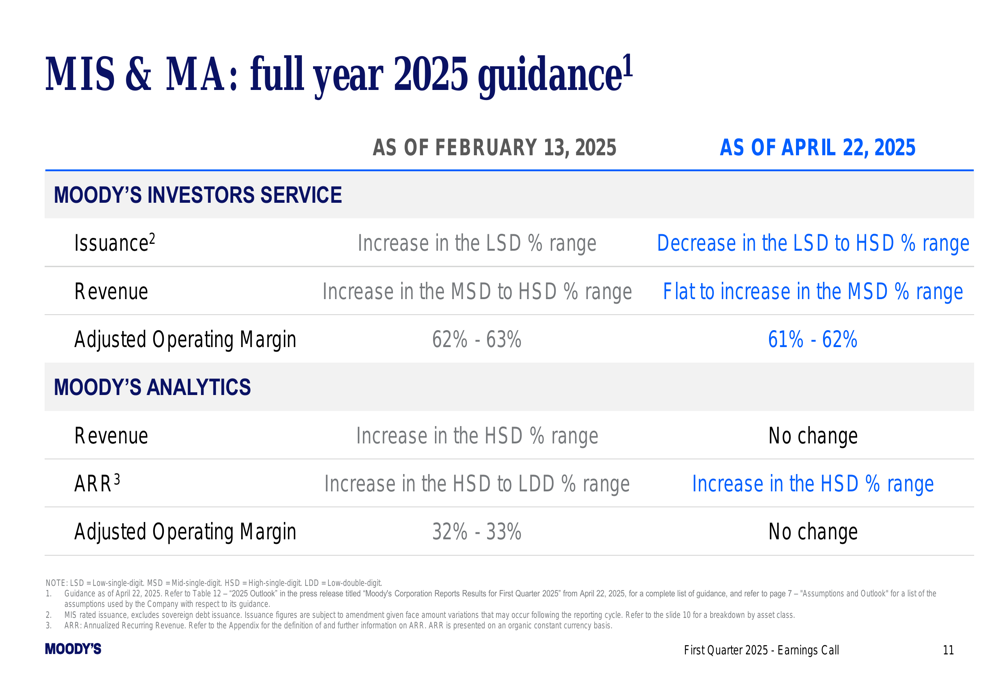
For MIS, issuance outlook changed from an increase in the low-single digit percentage range to a decrease in the low to high-single digit percentage range. Consequently, MIS revenue guidance was lowered from an increase in the mid to high-single digit range to flat to increase in the mid-single digit range.
Strategic Initiatives
Moody’s outlined several strategic initiatives aimed at driving long-term growth. The company is focusing on strengthening its position as the Agency of Choice, building scale across high-growth areas, accelerating platforming and product innovation, and optimizing its operating model.
The following slide illustrates Moody’s strategic approach to data, analytics, and software solutions, with customer centricity at the core:
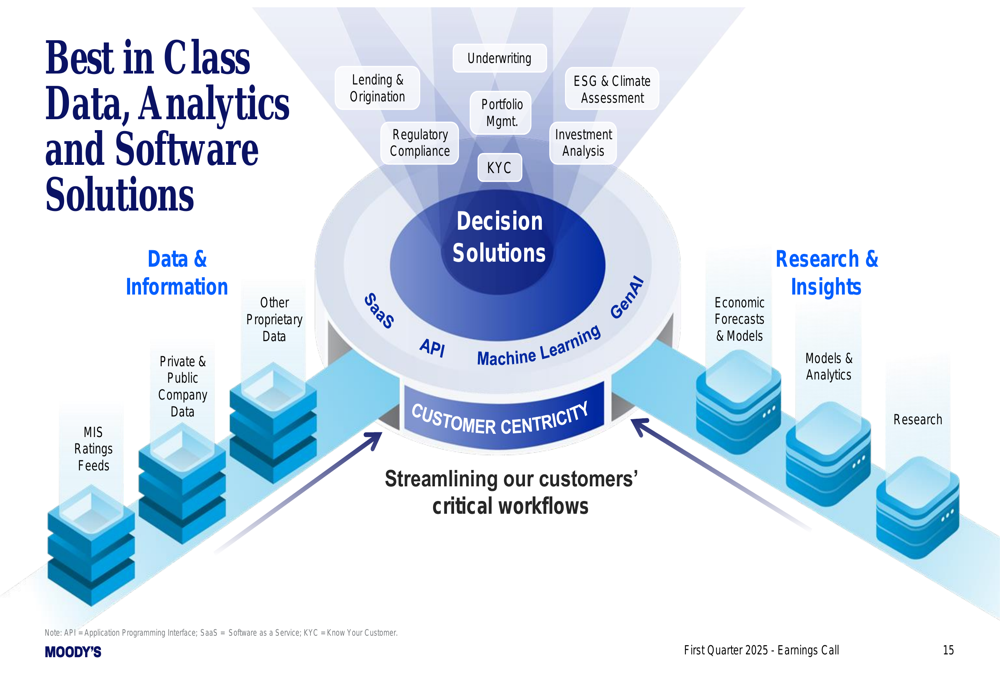
The company is leveraging machine learning and generative AI to enhance its offerings across various applications, including lending and origination, underwriting, ESG and climate assessment, portfolio management, investment analysis, and KYC (Know Your Customer).
Market Context
A key driver for Moody’s future growth is the substantial refinancing needs in the coming years. The presentation highlighted strong debt maturities scheduled for 2025-2028, which should support future issuance activity.
As shown in the following chart, significant debt maturities are expected in both the U.S. and EMEA markets:
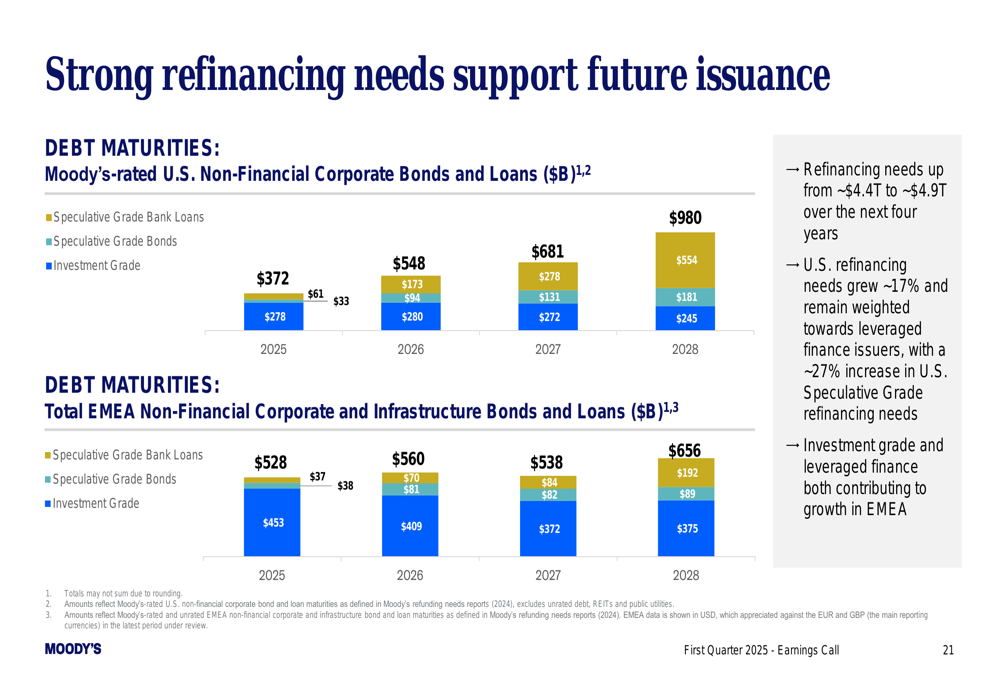
For U.S. Non-Financial Corporate Bonds and Loans, refinancing needs total $372 billion in 2025, with further increases expected in 2026-2028. Similarly, EMEA Non-Financial Corporate and Infrastructure Bonds and Loans show $528 billion in refinancing needs for 2025, also projected to increase in subsequent years.
The company is also implementing strategic expense management initiatives to enhance profitability:
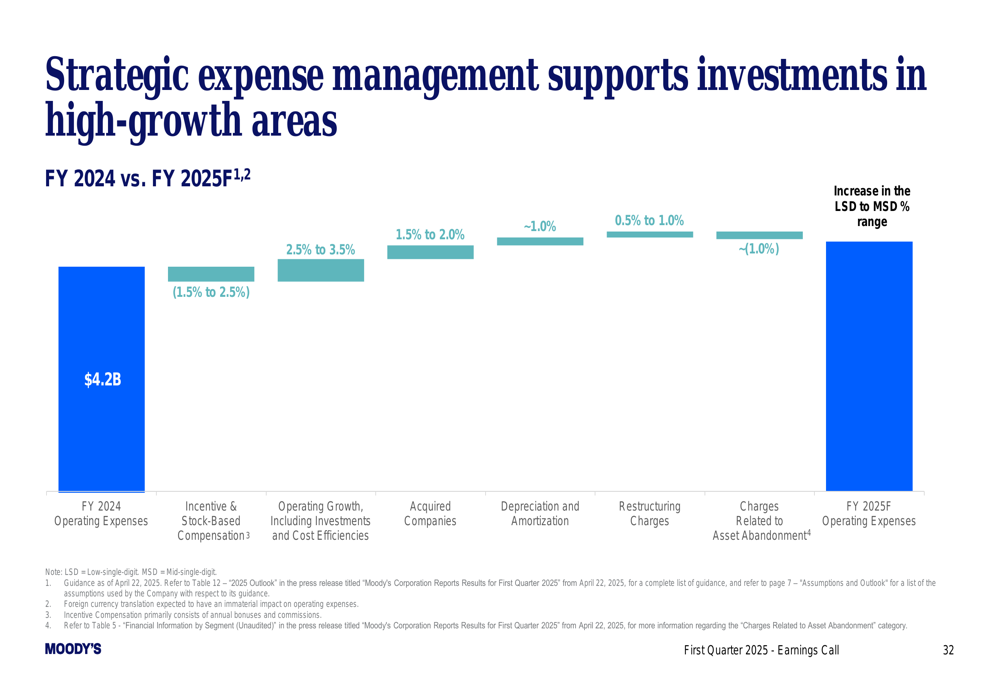
These measures are expected to drive operating expense growth between low-single digit and mid-single digit percentages in 2025, contributing to the company’s goal of creating an efficient, cost-conscious business that is highly scalable and sustainable.
Competitive Industry Position
Moody’s emphasized its revenue growth algorithm for MIS, highlighting three key components: Economic Expansion (2%-3%), Value Proposition (3%-4%), and Developing Capital Markets (1%-2%). This framework underpins the company’s competitive positioning in the ratings market.
The company also detailed its capital allocation strategy, balancing investments for growth with shareholder returns:
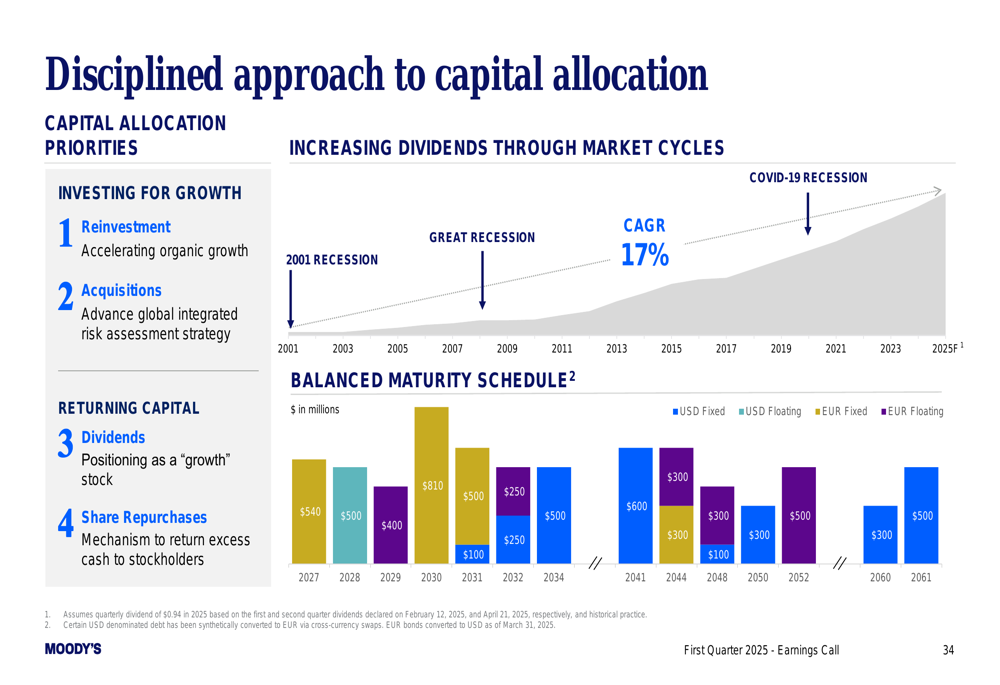
Moody’s continues to prioritize organic investments in high-growth areas while maintaining its commitment to increasing dividends. The company’s balance sheet remains strong, with a well-structured debt maturity schedule.
Despite the reduced guidance for 2025, Moody’s Q1 results demonstrate the company’s ability to deliver strong performance in its core businesses. The focus on private credit, digital transformation, and operational efficiency positions the company to navigate market uncertainties while pursuing long-term growth opportunities.
Full presentation:
This article was generated with the support of AI and reviewed by an editor. For more information see our T&C.