Fed’s Powell opens door to potential rate cuts at Jackson Hole

Introduction & Market Context
Northern Trust Corporation (NASDAQ:NTRS) released its first quarter 2025 earnings presentation on April 22, showing strong year-over-year growth but sequential pressure on key metrics. The company’s stock has been under pressure, trading at $86.78 as of April 21, down 1.72% from its previous close and significantly below its 52-week high of $114.67.
The financial services giant, with 135 years of history, reported diluted earnings per share of $1.90 for Q1 2025, nearly doubling (+99%) compared to the same period last year but declining 16% from the previous quarter. This sequential decline follows a strong Q4 2024 performance when the company reported EPS of $2.26.
Quarterly Performance Highlights
Northern Trust reported revenue of $1,945.6 million on a fully taxable equivalent (FTE) basis for Q1 2025, representing an 18% increase year-over-year but a 1% decrease compared to Q4 2024. Net income reached $392.0 million, up 83% from Q1 2024 but down 14% sequentially.
As shown in the following comprehensive financial summary:
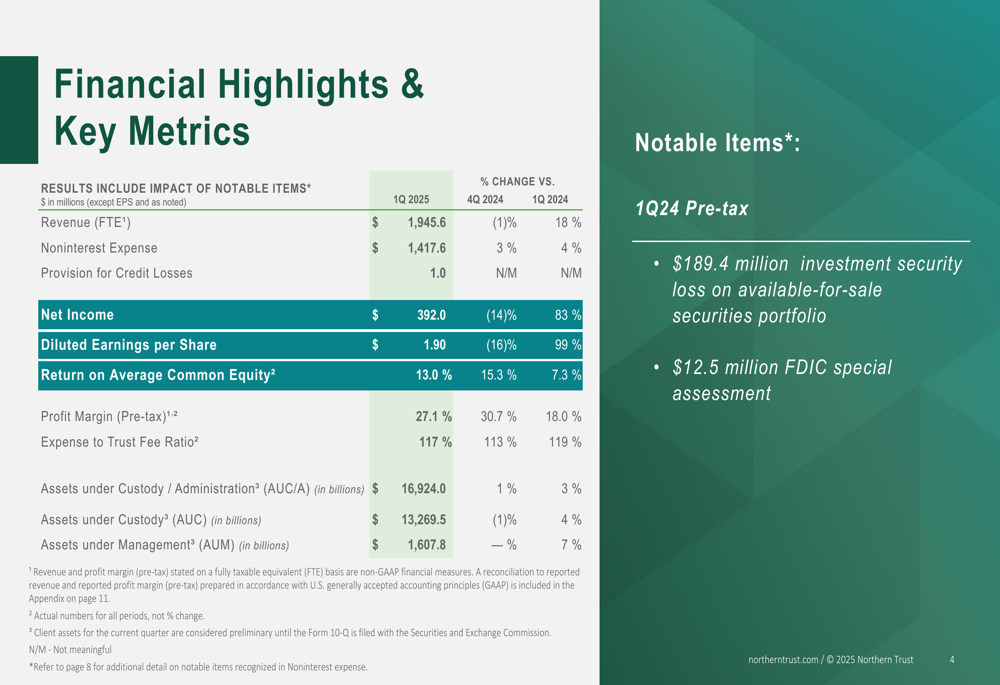
The company’s return on average common equity stood at 13.0%, while its pre-tax profit margin was 27.1%. This represents a decline from the 30% pre-tax margin achieved in the latter half of 2024, indicating some pressure on profitability. The expense-to-trust fee ratio was 117%, still above the company’s medium-term target range of 105-110%.
Detailed Financial Analysis
Asset Servicing, a core business segment for Northern Trust, showed resilience with total trust, investment, and other servicing fees of $821.5 million for Q1 2025. Custody and Fund Administration fees contributed $453.3 million, while Investment Management added $167.5 million.
The following chart illustrates the breakdown of Asset Servicing fees and key indicators:
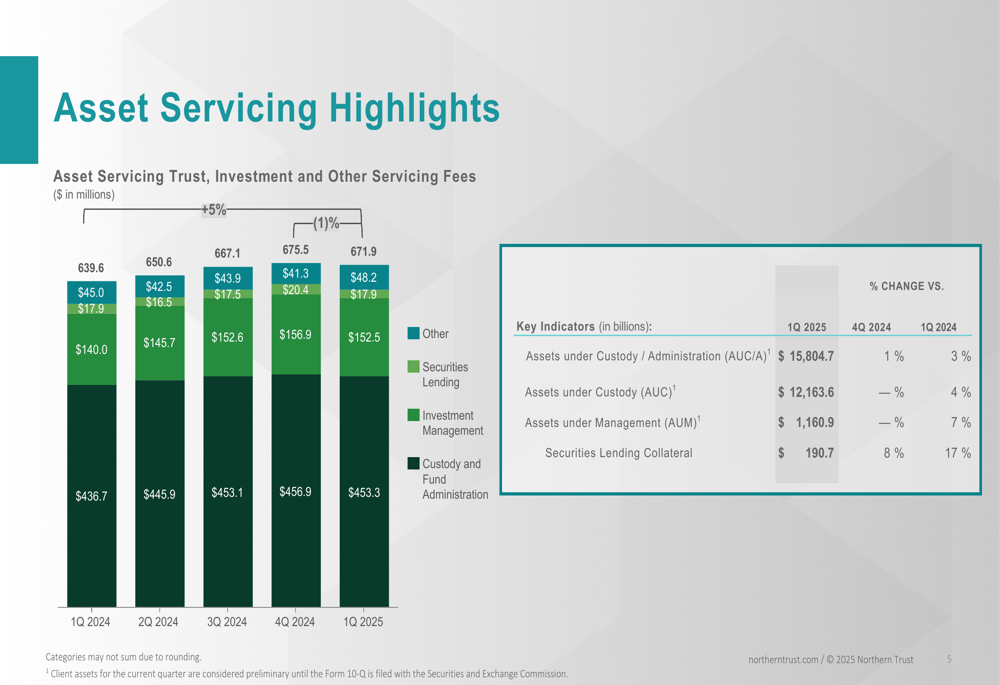
Assets under Custody/Administration (AUC/A) for the Asset Servicing segment reached $15,804.7 billion, up 3% year-over-year and 1% sequentially. Securities lending collateral showed strong growth of 17% compared to Q1 2024.
In the Wealth Management segment, Northern Trust reported total fees of $541.1 million for Q1 2025, with the Central region contributing the largest portion at $189.1 million.
The following chart details the Wealth Management performance:
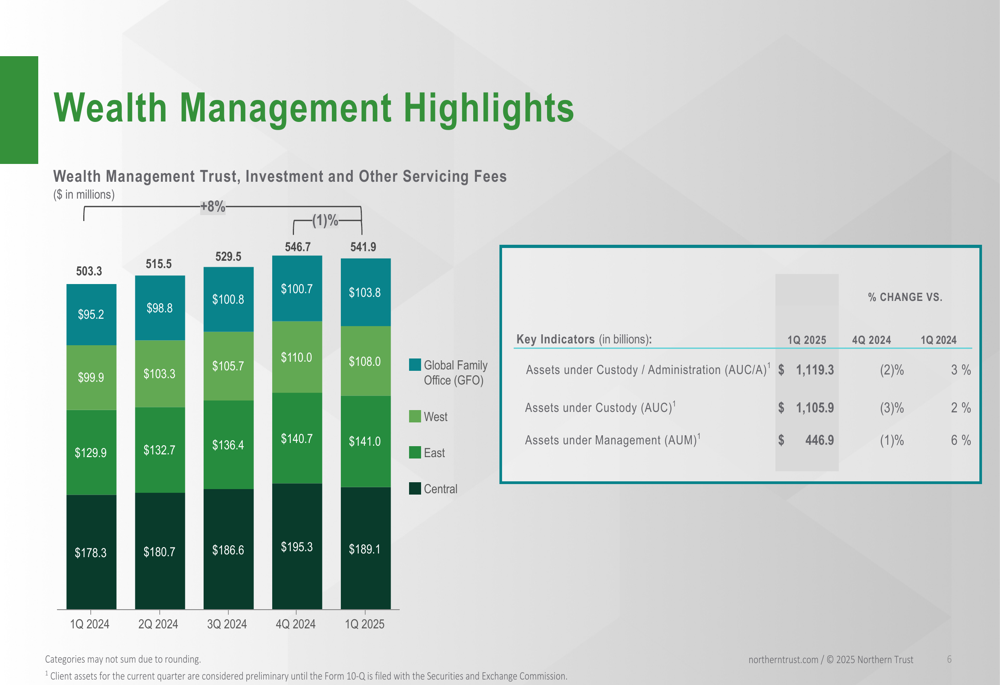
Wealth Management’s Assets under Custody/Administration stood at $1,119.3 billion, up 3% year-over-year but down 2% from the previous quarter. Assets under Management for this segment reached $446.9 billion, growing 6% year-over-year despite a 1% sequential decline.
Balance Sheet and Net Interest Income
Northern Trust’s net interest income remained relatively stable at $573.7 million in Q1 2025, compared to $574.3 million in Q4 2024. The net interest margin was 1.69%, slightly down from 1.71% in the previous quarter.
The following chart shows the composition of average earning assets and net interest income trends:
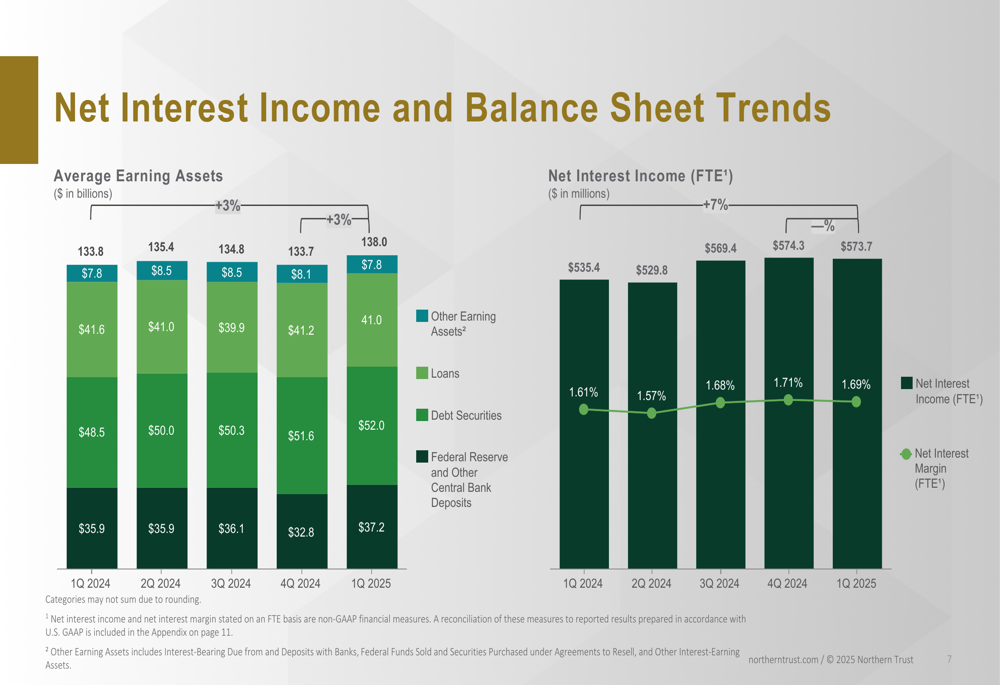
Average earning assets totaled approximately $138 billion in Q1 2025, with Federal Reserve and Other Central Bank Deposits at $37.2 billion, Debt Securities at $52.0 billion, Loans at $41.0 billion, and Other Earning Assets at $7.8 billion.
Expense Management
Noninterest expense totaled $1,417.6 million in Q1 2025, representing a 3% increase from Q4 2024 and a 4% increase year-over-year. This expense growth rate is below the 18% year-over-year revenue growth, indicating some operating leverage.
The following chart breaks down noninterest expenses by category:
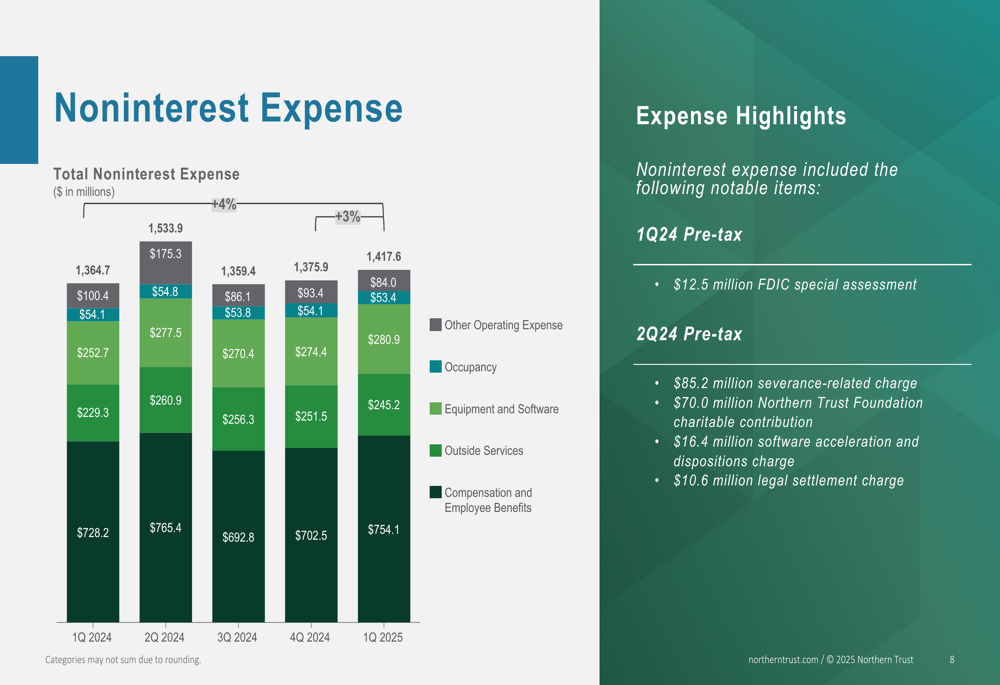
It’s worth noting that Q1 2024 included a $12.5 million FDIC special assessment, while Q2 2024 had several notable expense items including an $85.2 million severance-related charge and a $70.0 million Northern Trust Foundation charitable contribution.
Capital Position and Shareholder Returns
Northern Trust maintained a strong capital position in Q1 2025, with a Common Equity Tier 1 ratio of 12.9% under the standardized approach. The company’s Tier 1 leverage ratio stood at 8.0%.
The following chart illustrates the company’s capital ratios and highlights:
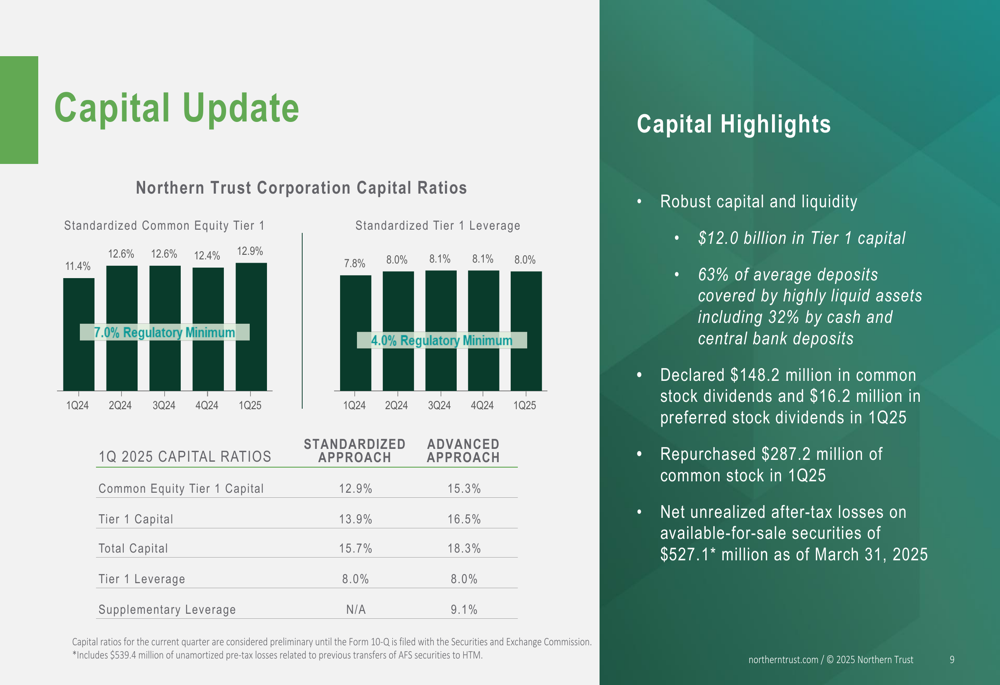
The company returned significant capital to shareholders during the quarter, declaring $148.2 million in common stock dividends and $16.2 million in preferred stock dividends. Additionally, Northern Trust repurchased $287.2 million of common stock in Q1 2025.
Non-GAAP Financial Measures
To provide a clearer picture of its financial performance, Northern Trust included a reconciliation of GAAP to non-GAAP financial measures in its presentation. This reconciliation is particularly important for understanding the company’s revenue and profitability metrics.
The following table details these reconciliations:
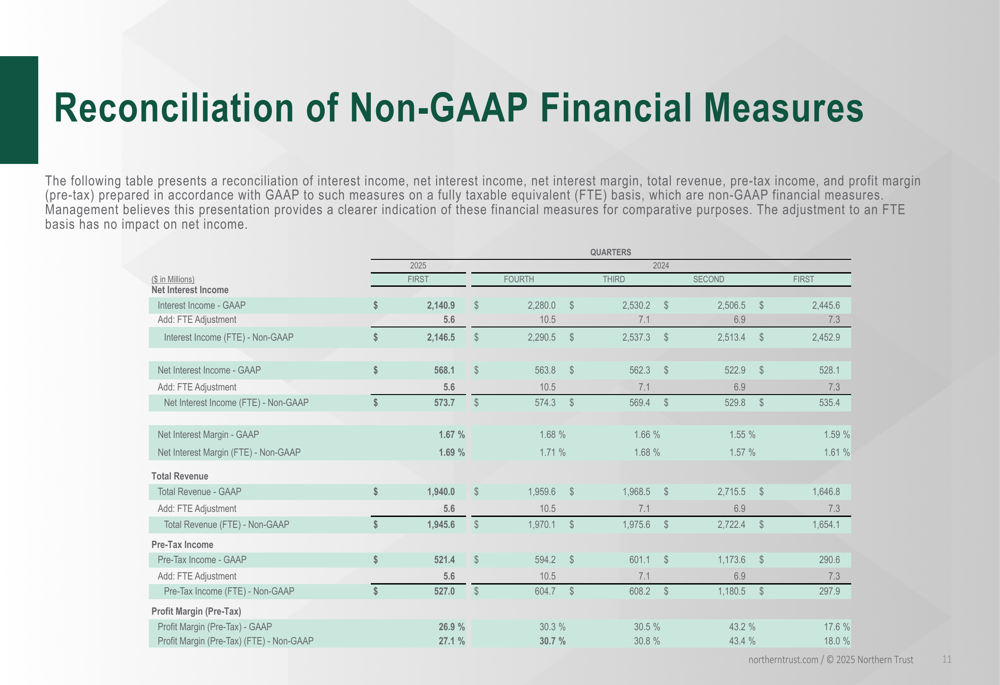
The reconciliation shows that net interest income on a non-GAAP (FTE) basis was $573.7 million for Q1 2025, compared to $568.1 million on a GAAP basis, with similar adjustments for other financial metrics.
Forward-Looking Statements
While the presentation didn’t include specific forward-looking guidance, Northern Trust’s previous earnings call indicated medium-term targets for an expense-to-trust fee ratio of 105-110% and pre-tax margins above 30%. The current Q1 2025 results show that the company still has work to do to reach these targets, with an expense-to-trust fee ratio of 117% and a pre-tax margin of 27.1%.
The company’s management had previously emphasized building a "sustainable financial model that can last through all cycles," focusing on organic growth and expense management as controllable factors to drive performance regardless of market conditions.
Market Perspective
Northern Trust’s Q1 2025 results reflect a company navigating a challenging environment with mixed success. While the year-over-year growth in revenue and earnings is impressive, the sequential decline in key metrics and the current stock price, which is down significantly from its 52-week high, suggest investors remain cautious about the company’s near-term prospects.
The financial services firm continues to benefit from its strong capital position and long-standing reputation for stability, but faces ongoing challenges in meeting its medium-term financial targets, particularly regarding expense management and profit margins.
Full presentation:
This article was generated with the support of AI and reviewed by an editor. For more information see our T&C.