Bitcoin price today: surges to $122k, near record high on US regulatory cheer

Introduction & Market Context
Nu Skin Enterprises (NYSE:NUS) released its Q2 2025 presentation on August 7, 2025, revealing continued revenue challenges across most regions while highlighting operational efficiency improvements. The global beauty and wellness company reported a 12.1% year-over-year revenue decline, though premarket trading showed a 2.56% increase, suggesting investors found some positive elements in the results.
The company’s stock has experienced significant volatility over the past year, trading between $5.32 and $10.88, with the latest closing price at $8.20. This quarterly presentation comes as Nu Skin continues to navigate challenging global market conditions while working to optimize its business operations.
Quarterly Performance Highlights
Nu Skin reported Q2 2025 revenue of $386.1 million, representing a 12.1% decline from the same period last year, with foreign exchange having a minimal impact of 0.3% or $1.4 million. Earnings per share reached $0.43, a significant improvement compared to the $(2.38) loss reported in Q2 2024, which included impairment and other charges. Excluding these one-time items, the year-over-year EPS comparison would be $0.43 versus $0.21.
As shown in the following overview chart, the company’s revenue is distributed across multiple regions, with the Americas representing the largest segment at 19%, followed by Rhyz at 17% and Mainland China at 14%:
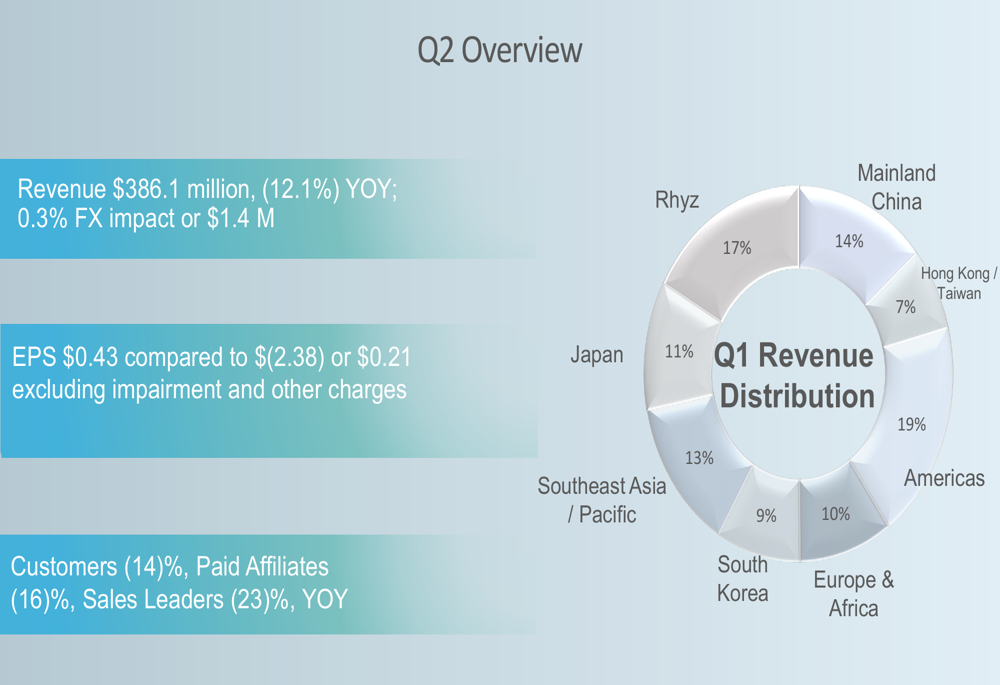
Customer metrics showed broad declines, with the total customer count down 14% year-over-year to 771,407. Paid affiliates decreased by 16% to 130,799, while sales leaders saw the steepest decline at 23%, dropping to 29,593. These metrics suggest ongoing challenges in Nu Skin’s direct selling model, though the Americas region provided a bright spot with 6% customer growth.
Regional Performance Analysis
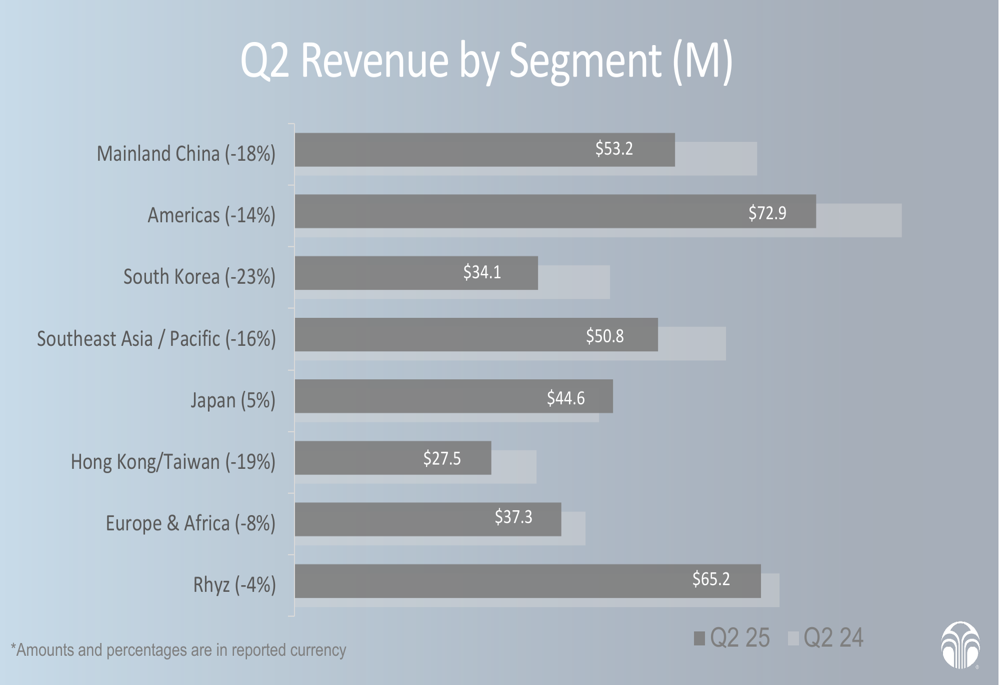
The company’s Q2 revenue breakdown by segment reveals that only Japan achieved positive growth, with a 5% year-over-year increase to $44.6 million. All other regions experienced declines, with South Korea (-23%), Hong Kong/Taiwan (-19%), and Mainland China (-18%) showing the most significant drops.
The following chart illustrates the revenue performance by segment:
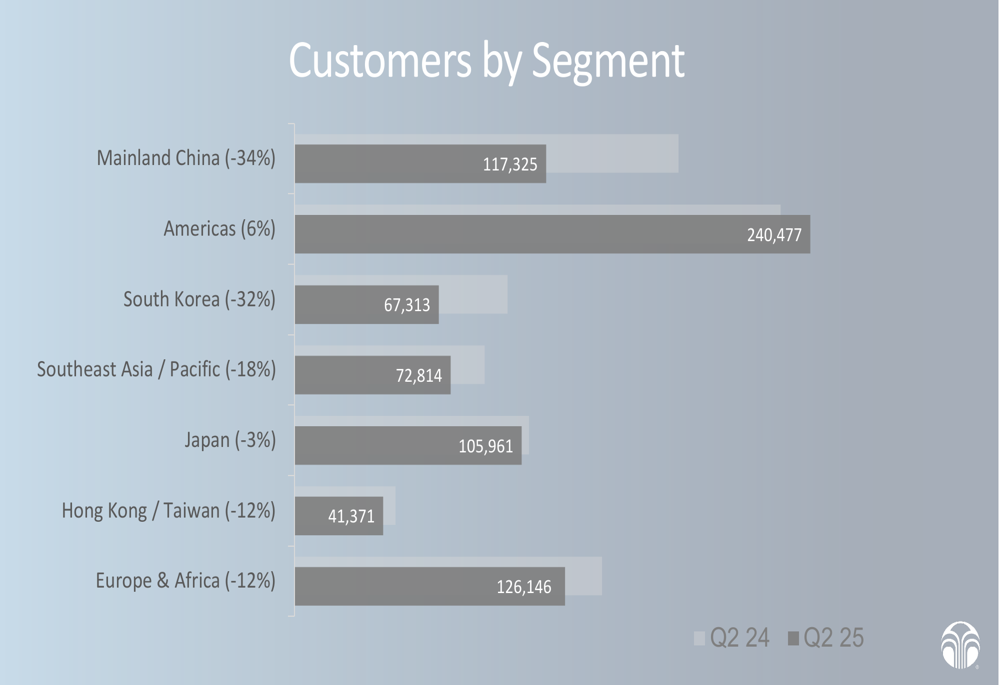
Customer trends varied significantly by region. While most markets experienced customer declines, the Americas region showed promising 6% growth in its customer base despite a 14% revenue decline. Mainland China faced the most severe customer erosion at -34%, aligning with its substantial revenue decrease.
The regional customer breakdown is illustrated in this chart:
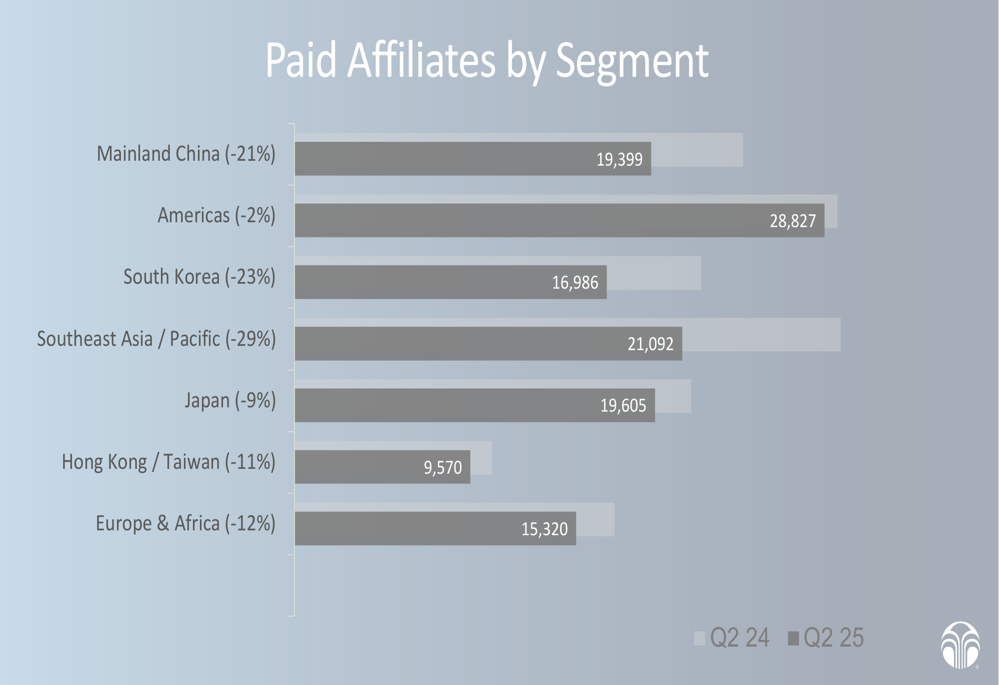
The paid affiliates segment, which represents individuals actively selling Nu Skin products, showed declines across all regions. The Americas region demonstrated the most resilience with just a 2% decline, while Southeast Asia/Pacific experienced the steepest drop at 29%:
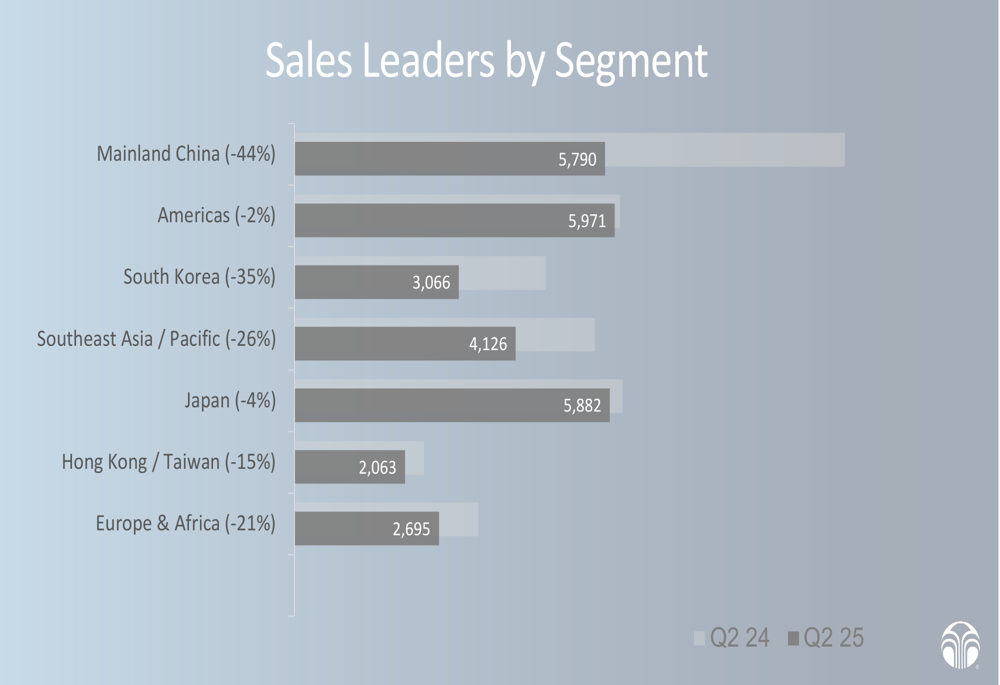
Sales leaders, who represent the company’s most productive representatives, saw even more pronounced declines. Mainland China experienced a dramatic 44% reduction in sales leaders, while South Korea saw a 35% decline. The Americas and Japan regions showed the most stability with modest 2% and 4% decreases respectively:
Operational Efficiency Improvements
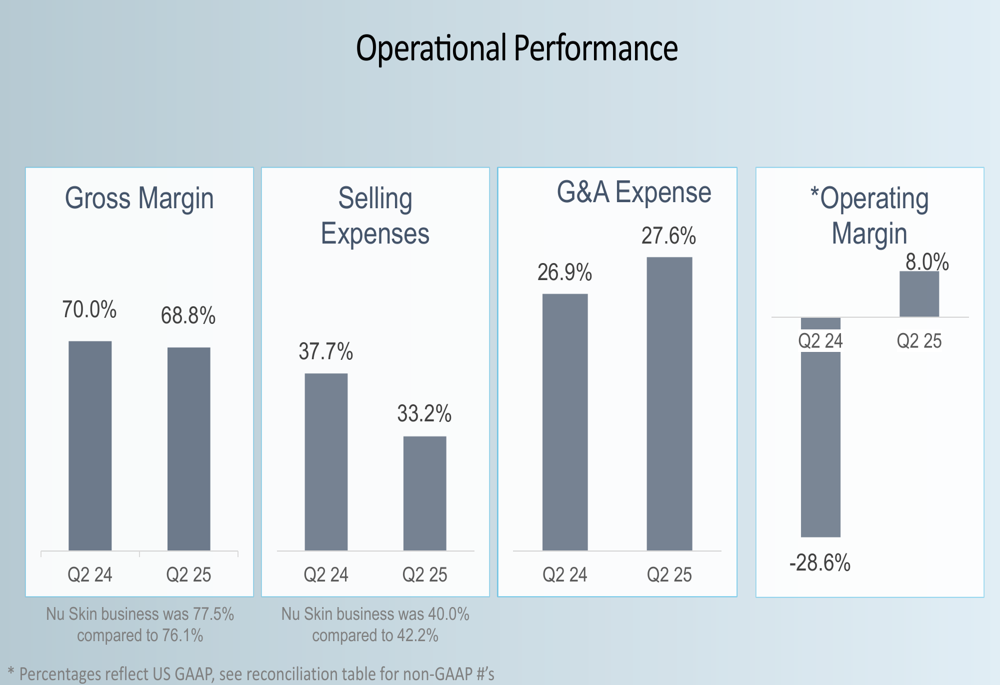
Despite revenue challenges, Nu Skin demonstrated improved operational efficiency in several key metrics. The company’s gross margin was 68.8% in Q2 2025, compared to 70.0% in Q2 2024. However, the core Nu Skin business saw margin improvement to 77.5% from 76.1% in the prior year.
Selling expenses decreased significantly to 33.2% of revenue from 37.7% in Q2 2024, reflecting the company’s cost management efforts. General and administrative expenses increased slightly to 27.6% from 26.9%. The most notable improvement came in operating margin, which reached 8.0% compared to -28.6% in Q2 2024 (which included impairment charges).
The following chart details these operational metrics:
These improvements align with trends observed in Nu Skin’s Q1 2025 results, where the company had reported better-than-expected earnings driven by strategic cost management and operational efficiencies. The continued focus on expense control appears to be yielding positive results despite the revenue headwinds.
Forward Guidance & Outlook
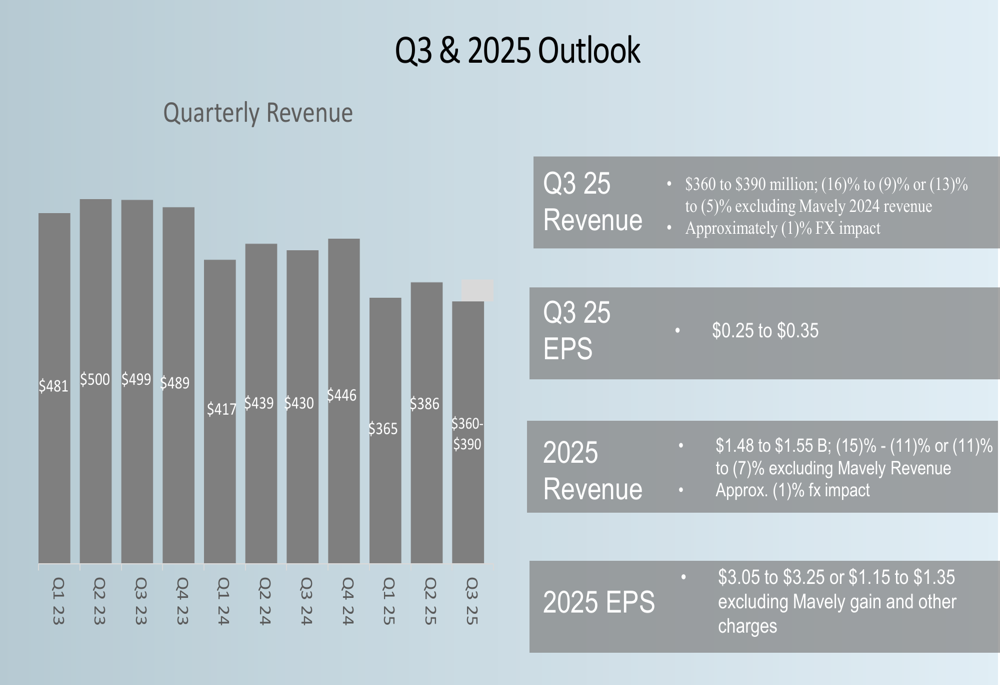
Looking ahead, Nu Skin provided guidance for both Q3 2025 and the full year. For Q3, the company expects revenue between $360 million and $390 million, representing a decline of 9% to 16% year-over-year, or 5% to 13% excluding Mavely 2024 revenue. Q3 earnings per share are projected to be between $0.25 and $0.35.
For the full year 2025, Nu Skin forecasts revenue of $1.48 billion to $1.55 billion, representing an 11% to 15% decline, or 7% to 11% excluding Mavely revenue. Full-year EPS is expected to be $3.05 to $3.25, or $1.15 to $1.35 excluding the Mavely gain and other charges.
The company’s outlook is illustrated in the following chart:
While the Q2 presentation didn’t specifically highlight the Prism IO wellness platform mentioned in previous communications, the reconciliation tables indicate the company has sold Mavely, suggesting a continued focus on streamlining operations and potentially reallocating resources toward more promising growth initiatives.
Nu Skin’s ability to improve operational metrics despite revenue challenges demonstrates management’s focus on efficiency. However, the persistent declines in customers, affiliates, and sales leaders across most regions indicate significant work remains to return the company to sustainable growth. The positive customer trends in the Americas region and revenue growth in Japan provide potential bright spots as Nu Skin navigates through 2025.
Full presentation:
This article was generated with the support of AI and reviewed by an editor. For more information see our T&C.