Fed’s Powell opens door to potential rate cuts at Jackson Hole

Introduction & Market Context
Pilgrim’s Pride Corporation (NASDAQ:PPC) released its first quarter 2025 financial results on May 1, showing substantial profit growth despite mixed market conditions in the poultry industry. The company’s stock is currently trading at $51.20 in premarket trading, down 6.19% following the presentation, suggesting investors may be taking profits after the stock’s recent strong performance.
The company’s presentation comes after a solid Q4 2024 performance where Pilgrim’s exceeded EPS expectations but missed revenue forecasts. The Q1 results demonstrate continued momentum in profitability metrics while navigating evolving industry supply dynamics.
Quarterly Performance Highlights
Pilgrim’s Pride reported significant year-over-year improvements across all major financial metrics for Q1 2025. Net income surged 69.4% to $296.3 million compared to $174.9 million in the same period last year, while earnings per share jumped to $1.24 from $0.73, representing a 69.9% increase.
Revenue grew more modestly at 2.3%, reaching $4.46 billion versus $4.36 billion in Q1 2024. This represents a sequential improvement from the $4.37 billion reported in Q4 2024, suggesting the company has overcome the previous quarter’s revenue challenges.
As shown in the following comprehensive financial review:
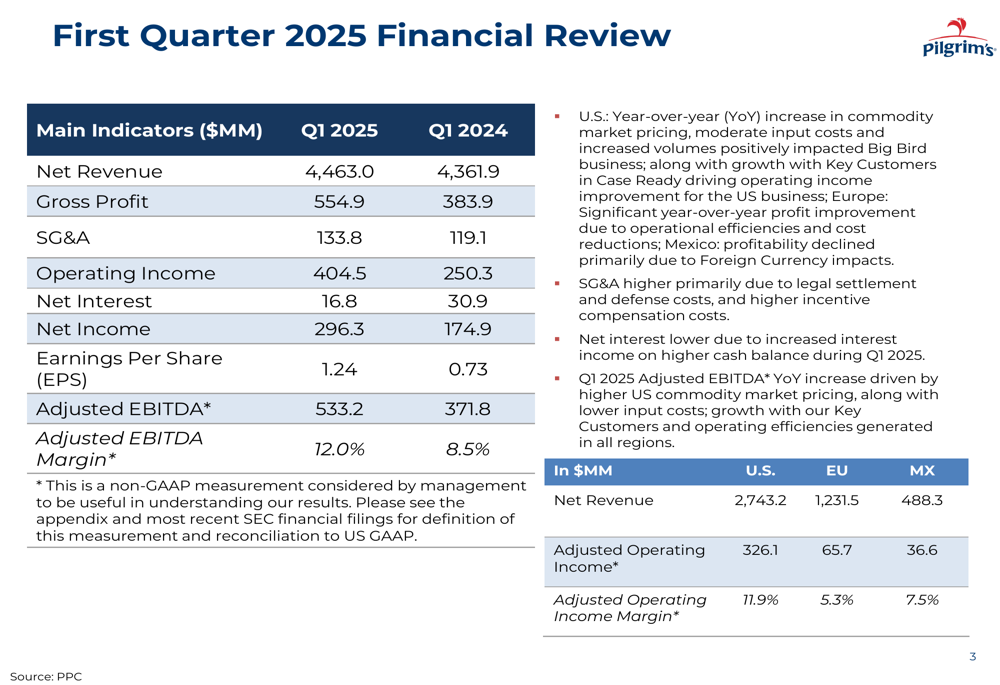
The company’s profitability metrics showed remarkable improvement, with gross profit increasing 44.5% to $554.9 million and operating income rising 61.6% to $404.5 million. Adjusted EBITDA reached $533.2 million, up 43.4% from the prior year, while the adjusted EBITDA margin expanded significantly to 12.0% from 8.5% in Q1 2024.
Detailed Financial Analysis
Pilgrim’s Pride’s financial performance was driven by improvements across all geographic segments. The detailed reconciliation of adjusted EBITDA by segment reveals the contribution of each region to the overall results:
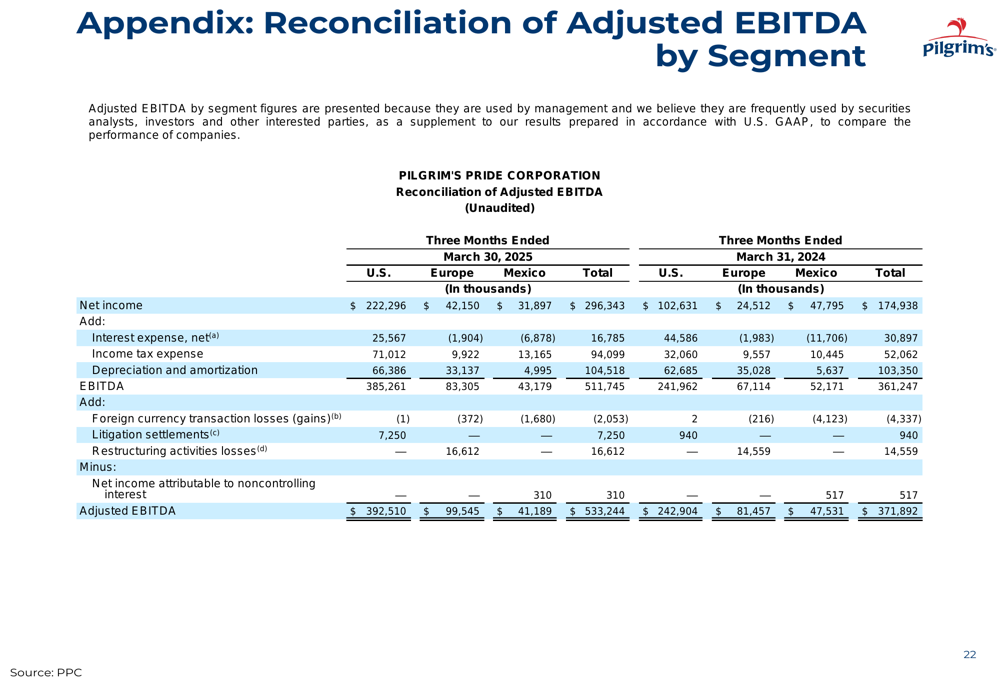
The U.S. operations remained the largest contributor to profitability, generating $392.5 million in adjusted EBITDA, followed by Europe at $99.5 million and Mexico at $41.2 million. The company also benefited from lower interest expenses, which decreased to $16.8 million from $30.9 million in the prior year, reflecting improved debt management.
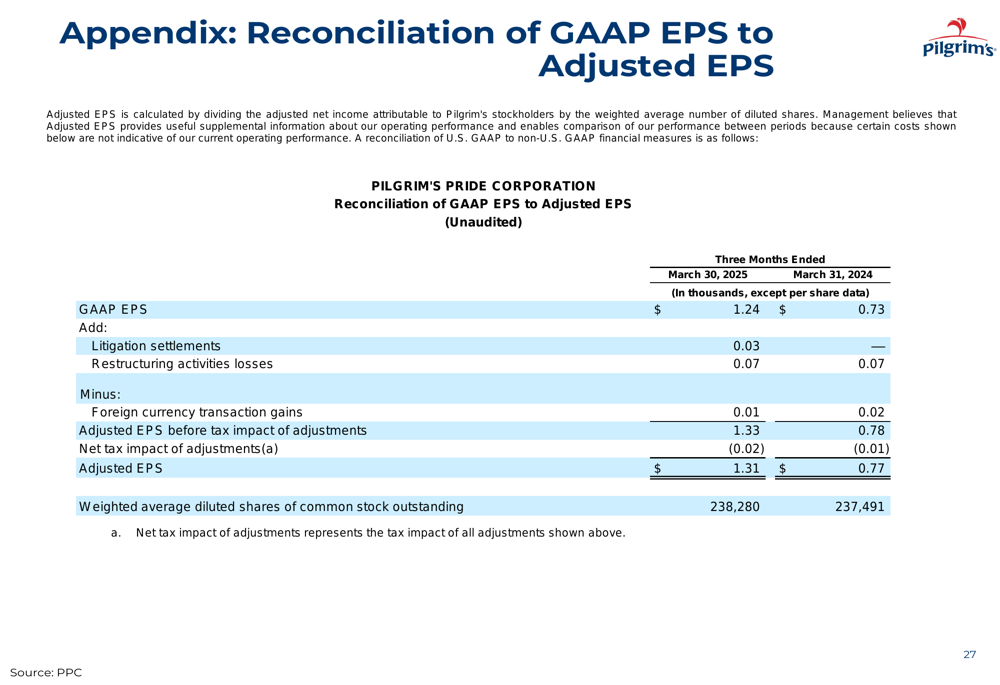
The company’s adjusted earnings per share reached $1.31, compared to $0.77 in the same period last year, as shown in the following reconciliation:
Industry Supply and Pricing Dynamics
The presentation highlighted several key industry trends affecting Pilgrim’s Pride’s performance. Total (EPA:TTEF) cold storage inventories ended Q1 2025 down 1.2% year-over-year and 4.9% below the five-year average, creating a favorable pricing environment for certain chicken products.
The following chart illustrates the industry cold storage supplies situation:
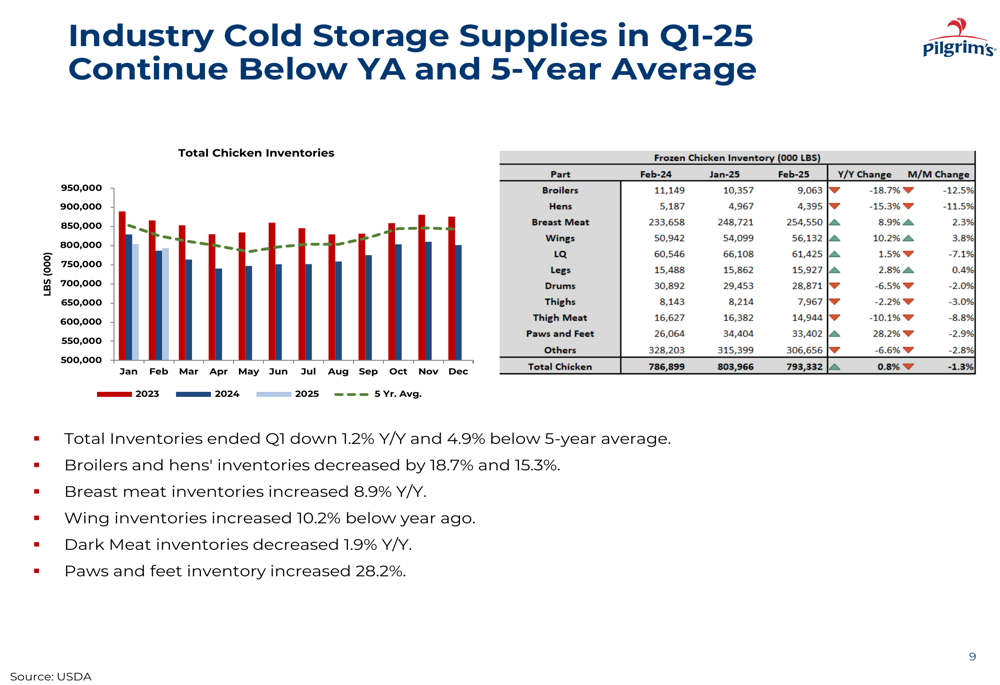
Pricing trends varied across different chicken products. Jumbo cutout pricing trended above both year-ago levels and the five-year average in Q1 2025. Boneless/skinless breast prices surged seasonally, while tenders remained stable. However, wing prices decreased significantly, and whole bird (WOG) pricing was below year-ago levels, though still above the five-year average.
Supply indicators showed mixed signals, with pullet placements increasing 0.7% year-over-year, broiler layer flock decreasing 2.3%, egg sets increasing 1.5%, and broiler placements rising 1.4% compared to Q1 2024. The company also noted increased head counts in the big bird debone segment.
Input Cost Trends
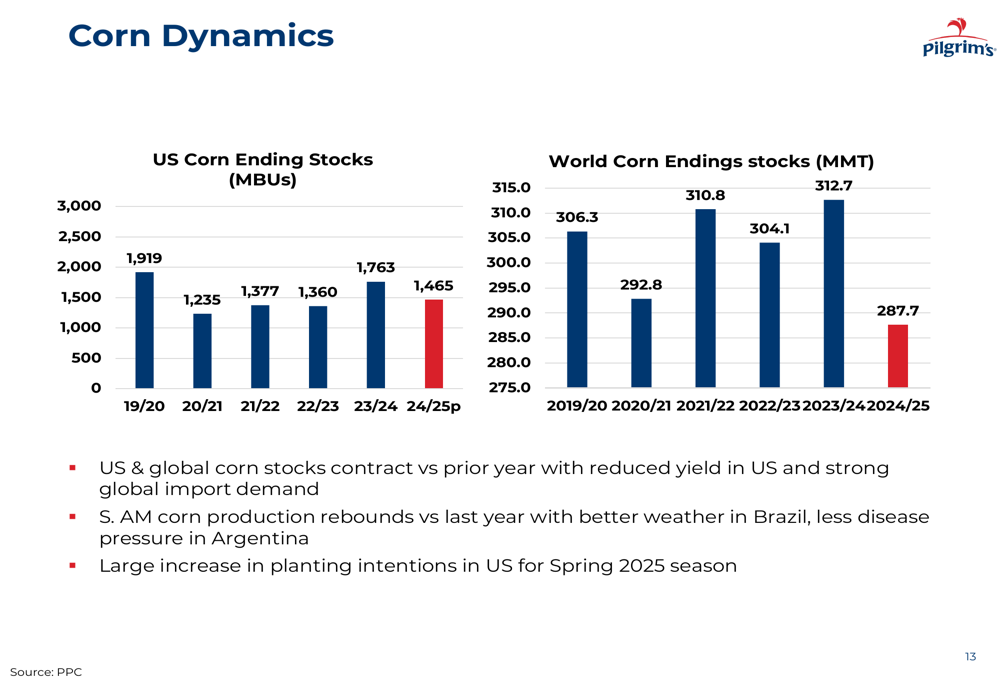
Feed costs, a significant component of poultry production expenses, showed contrasting trends between corn and soybeans. U.S. and global corn stocks contracted compared to the prior year, potentially putting upward pressure on prices, though a large increase in planting intentions for Spring 2025 could alleviate this pressure.
The corn dynamics are illustrated in the following chart:
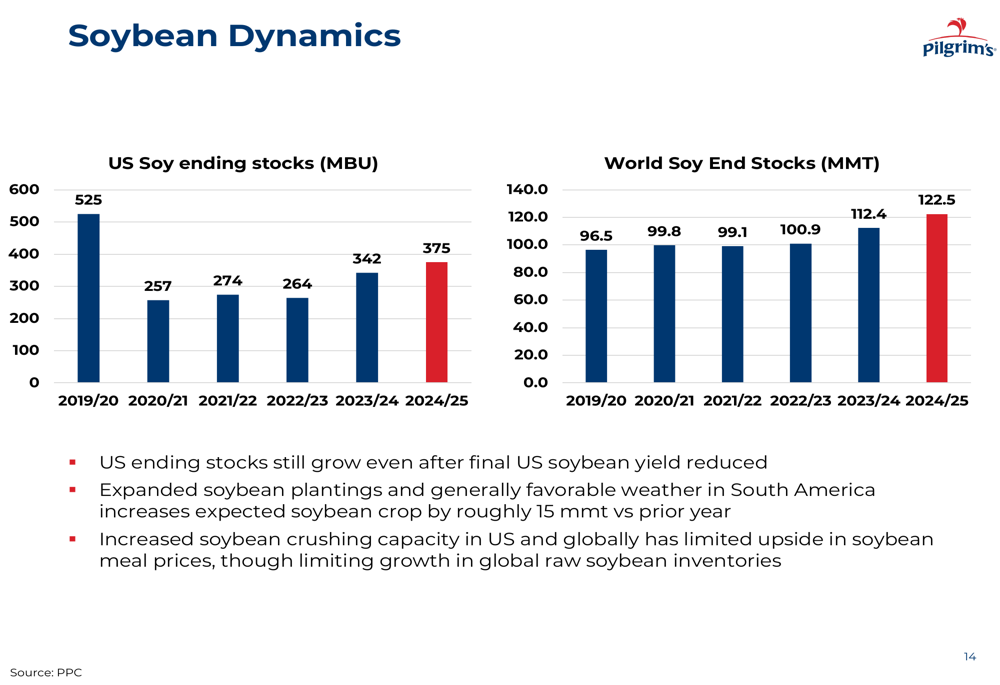
Meanwhile, soybean stocks continued to grow, with expanded plantings and favorable weather in South America increasing expected crop yields. Increased soybean crushing capacity in the U.S. and globally has limited upside in soybean meal prices, potentially benefiting feed costs.
The soybean dynamics are shown in the following chart:
Strategic Initiatives & Capital Allocation
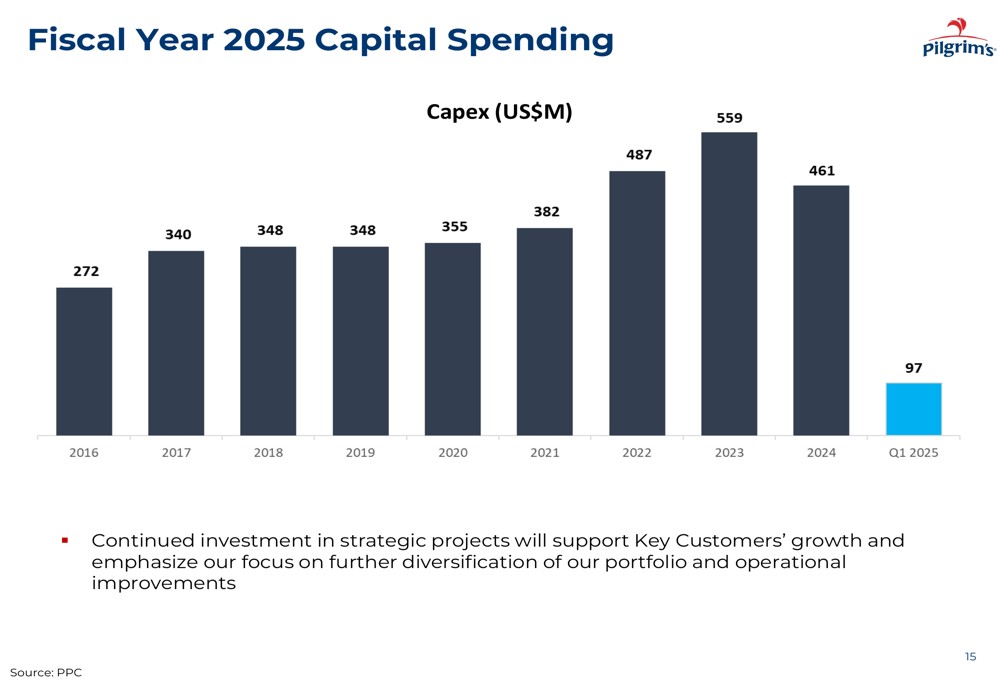
Pilgrim’s Pride continues to invest in strategic projects to support key customers’ growth while focusing on further diversification of its portfolio and operational improvements. Capital spending in Q1 2025 was $97 million, part of an ongoing investment strategy as illustrated in the following chart:
The company’s geographic diversification strategy continues to pay dividends, with operations in the U.S., Europe, and Mexico all contributing to the overall performance. This diversification helps mitigate regional market fluctuations and provides multiple growth avenues.
Forward-Looking Statements
While the presentation didn’t provide specific guidance for the remainder of 2025, the company’s strong Q1 performance positions it well to meet or exceed the full-year EPS forecast of $5.27 mentioned in previous communications. The company’s continued focus on operational excellence, portfolio diversification, and strategic investments suggests confidence in maintaining the momentum throughout the year.
However, potential challenges remain, including ongoing issues with hatchability (noted to be 0.6% below Q1 2024 levels), possible impacts from trade policies, and macroeconomic pressures affecting consumer demand. The company’s ability to navigate these challenges while maintaining its improved margins will be key to its performance in the coming quarters.
Pilgrim’s Pride’s Q1 2025 results demonstrate the company’s ability to drive significant profit growth and margin expansion despite mixed market conditions, positioning it well for continued success in the competitive poultry industry.
Full presentation:
This article was generated with the support of AI and reviewed by an editor. For more information see our T&C.