SoFi CEO enters prepaid forward contract on 1.5 million shares

Introduction & Market Context
PRA Group Inc. (NASDAQ:PRAA) presented its second quarter 2025 results on August 4, showing a significant improvement from its disappointing first quarter performance. The debt collection company reported net income of $42 million for Q2, a dramatic increase from the $4 million reported in Q1 2025, when the company missed analyst expectations considerably.
The company’s stock, which dropped 6.25% following the Q1 earnings miss, has shown recent signs of recovery with a 3.78% increase to $15.06 as of August 4. However, PRAA remains well below its 52-week high of $26.89, reflecting ongoing investor caution despite the improved quarterly results.
Quarterly Performance Highlights
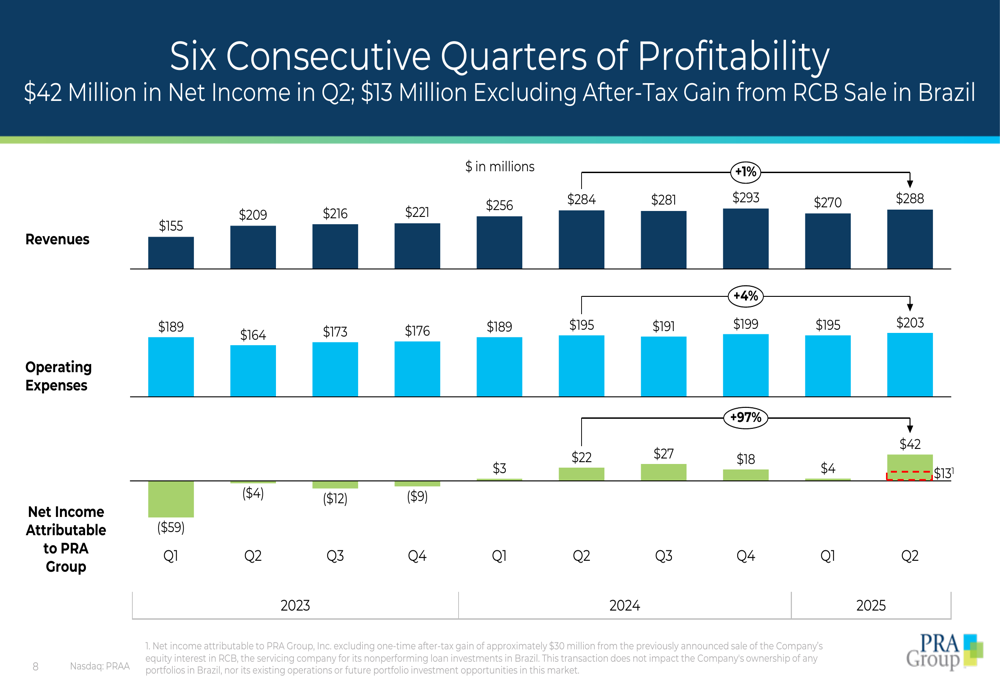
PRA Group reported six consecutive profitable quarters, with Q2 2025 representing a substantial rebound from Q1’s underwhelming performance. The company’s $42 million net income included gains from the sale of RCB in Brazil, though even excluding this one-time event, core profitability improved significantly.
Revenue reached $288 million in Q2, up from $270 million in Q1, while operating expenses increased modestly to $203 million from $195 million in the previous quarter.
As shown in the following chart of quarterly financial performance:
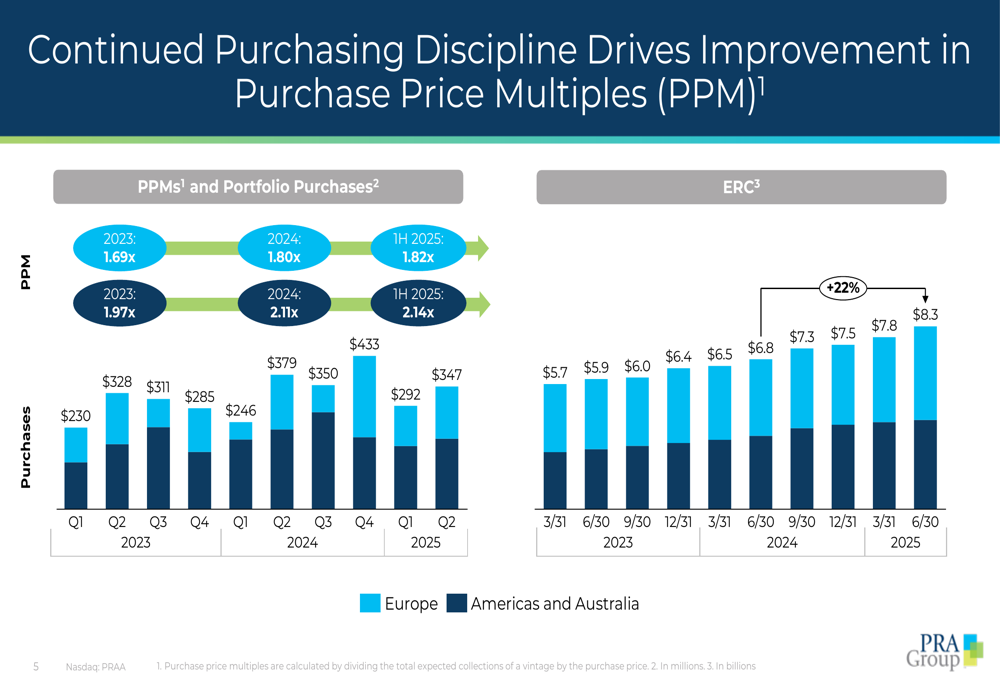
The company’s estimated remaining collections (ERC) - a key indicator of future revenue potential - reached a record $8.3 billion as of June 30, 2025, representing a 22% year-over-year increase. This growth reflects PRA Group’s continued investment in portfolio acquisitions across its global markets.
The following chart illustrates the steady growth in ERC alongside portfolio purchases and purchase price multiples:
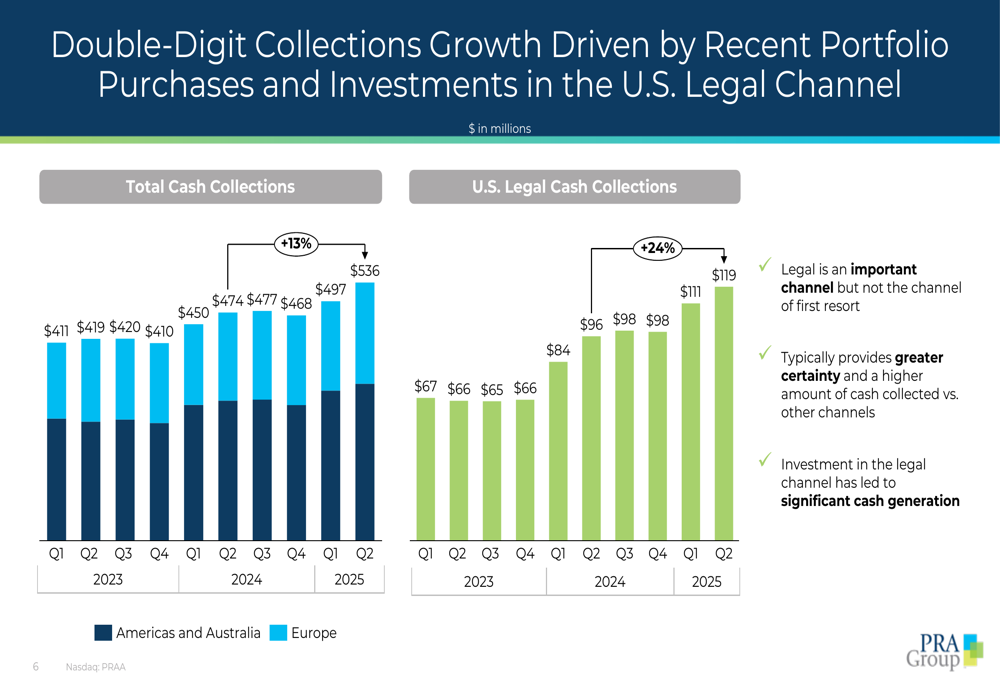
Total (EPA:TTEF) cash collections increased 13% year-over-year to $536 million in Q2 2025, with particularly strong performance in the U.S. legal channel, which grew 24% to $119 million. This growth was primarily driven by recent portfolio purchases and strategic investments in legal collection capabilities.
The following visualization shows the consistent growth in cash collections across regions:
Strategic Initiatives
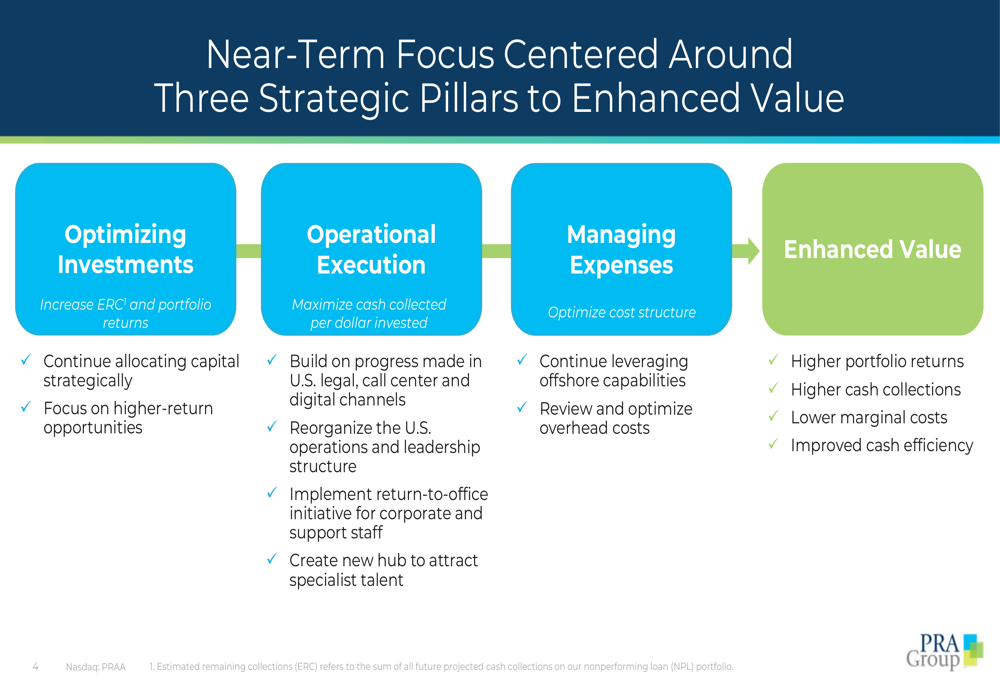
PRA Group’s presentation emphasized that the company is entering a "new chapter" focused intensely on shareholder value creation. Management outlined three strategic pillars that form the foundation of their transformation efforts: optimizing investments, improving operational execution, and managing expenses.
The company’s strategy is illustrated in this comprehensive framework:
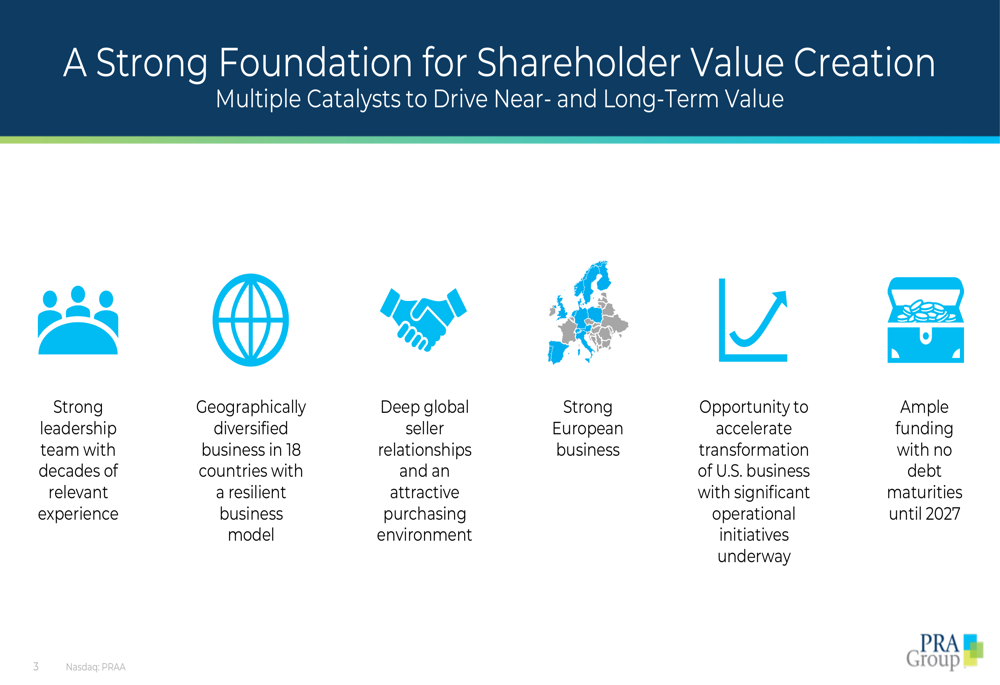
This approach leverages PRA Group’s established strengths, including its strong European business performance, which is serving as a model for transforming U.S. operations. The company highlighted several foundational elements supporting its strategy, including geographic diversification, deep seller relationships, and a strong leadership team.
As shown in this overview of the company’s strategic foundation:
Financial Position
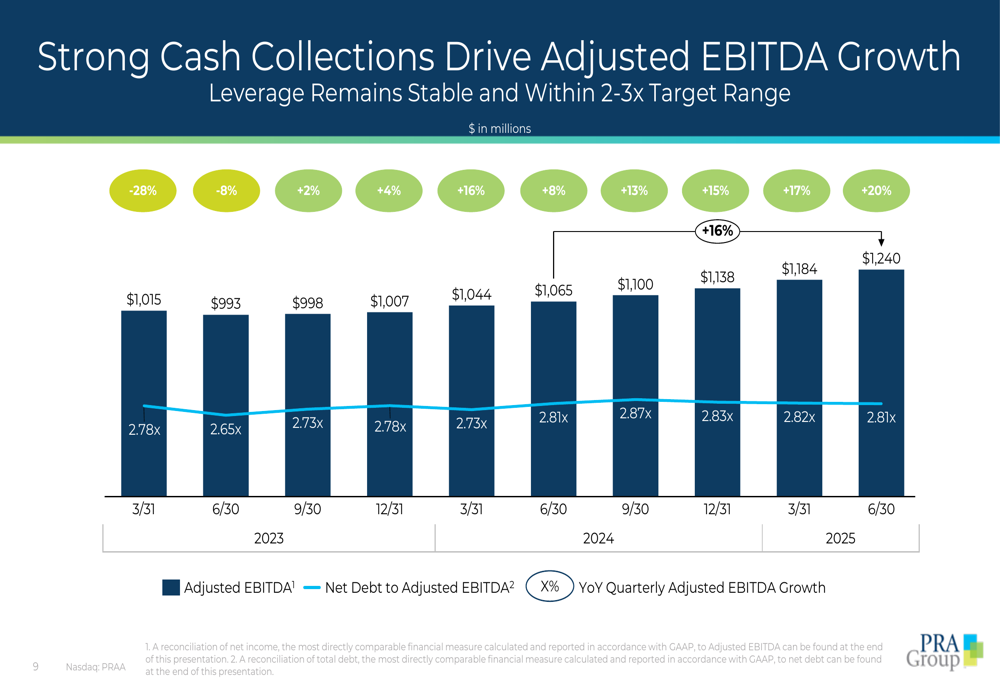
PRA Group maintained a stable financial position with a Net Debt to Adjusted EBITDA ratio of 2.81x at the end of Q2 2025. The company’s adjusted EBITDA has shown consistent growth, reaching $1.24 billion for the trailing twelve months ended June 30, 2025, a 20% increase year-over-year.
The following chart illustrates the company’s EBITDA growth and leverage ratio:
The company emphasized its strong capital structure with $841 million available under credit facilities as of June 30, 2025. PRA Group has no debt maturities until 2027, providing financial flexibility for continued portfolio investments. During Q2, the company repurchased $10 million of shares, demonstrating confidence in its long-term prospects.
The debt maturity profile is illustrated in this chart:
Forward-Looking Statements
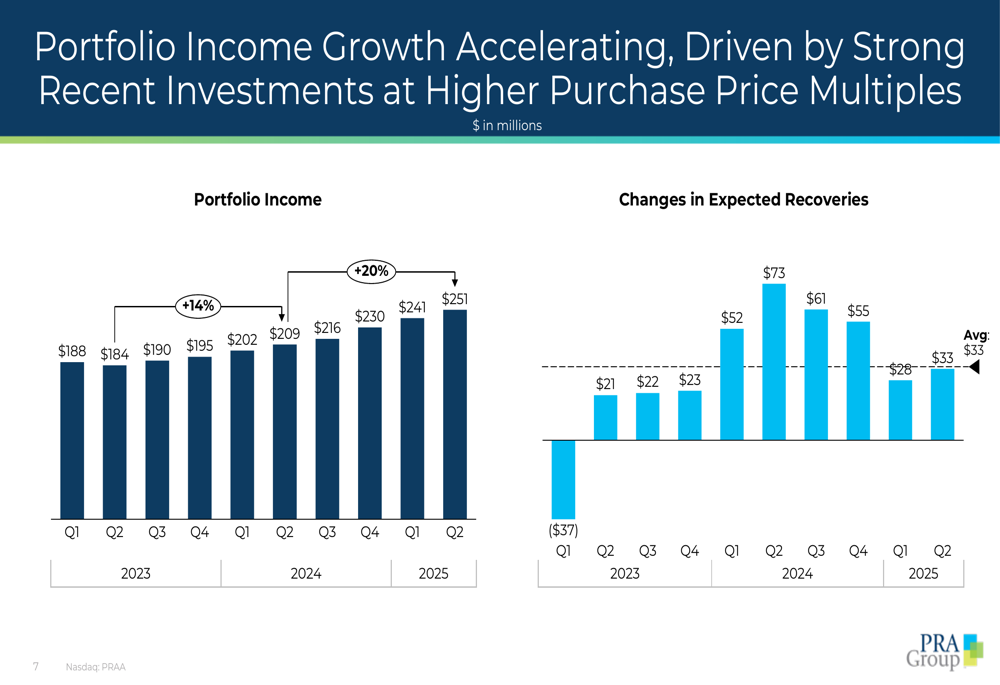
Looking ahead, PRA Group expressed confidence in its momentum entering the second half of 2025. Management highlighted the accelerating transformation of the U.S. business and continued focus on shareholder value creation. The company’s portfolio income growth is expected to continue accelerating, driven by recent investments at higher purchase price multiples.
Portfolio income reached $251 million in Q2 2025, showing steady growth from previous quarters as illustrated in this chart:
While the Q1 2025 earnings call had indicated concerns about elevated portfolio supply potentially impacting pricing and profitability, the Q2 presentation suggests the company has successfully navigated these challenges through disciplined purchasing. Purchase price multiples improved from 1.69x in 2023 to 1.82x in the first half of 2025, indicating better investment returns.
The company’s key takeaways emphasized solid results across all major metrics, with robust portfolio purchases, record ERC, double-digit cash collections growth, and cash efficiency exceeding 60%. Management expressed confidence that these trends would continue through the remainder of 2025.
Full presentation:
This article was generated with the support of AI and reviewed by an editor. For more information see our T&C.