Bank of America just raised its EUR/USD forecast

Introduction & Market Context
Prosperity Bancshares, Inc. (NYSE:PB) released its first quarter 2025 investor presentation on April 23, showcasing solid financial performance with improving profitability metrics. The Texas-based financial holding company reported net income of $130.2 million and earnings per share of $1.37 for Q1 2025, representing a 16.1% increase compared to the same period last year.
The results demonstrate continued momentum following the company’s strong Q4 2024 performance, when it reported net income of $130.1 million. Prosperity’s stock has shown positive movement recently, with shares trading at $67.16 as of April 22, 2025, up 2.49% from the previous close and well above its 52-week low of $57.16, though still below its 52-week high of $86.76.
Quarterly Performance Highlights
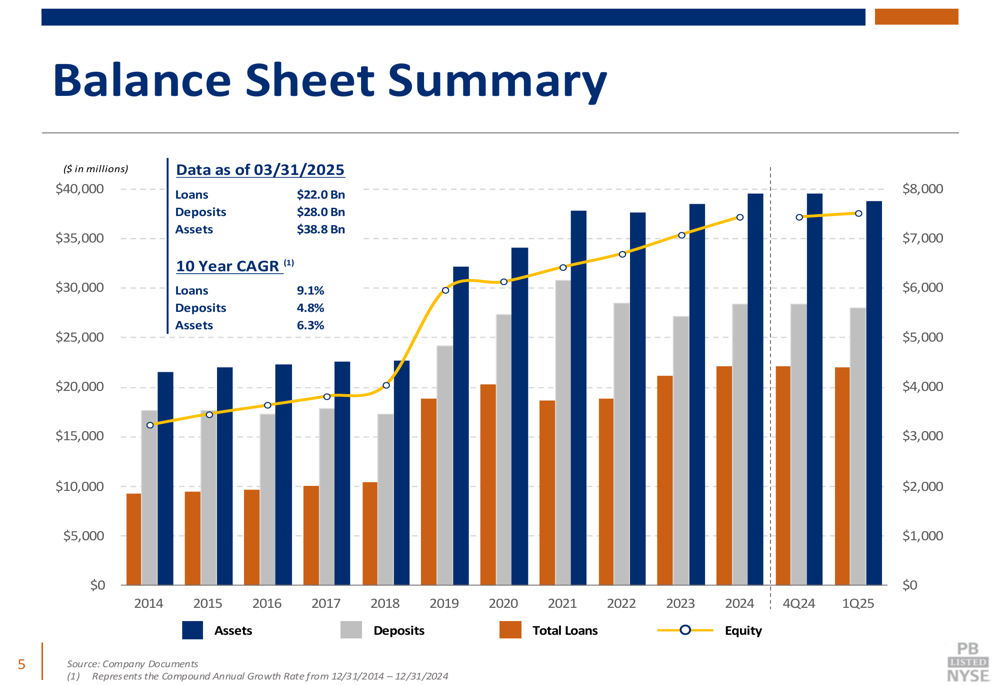
Prosperity Bancshares reported total assets of $38.8 billion, total loans of $22.0 billion, and deposits of $28.0 billion as of March 31, 2025. The company’s profitability metrics showed notable improvement, with return on average assets reaching 1.34% and return on average tangible common equity at 13.23% for the quarter.
As shown in the following chart of key financial metrics, the bank has demonstrated consistent growth in assets, deposits, loans, and equity over the past decade:
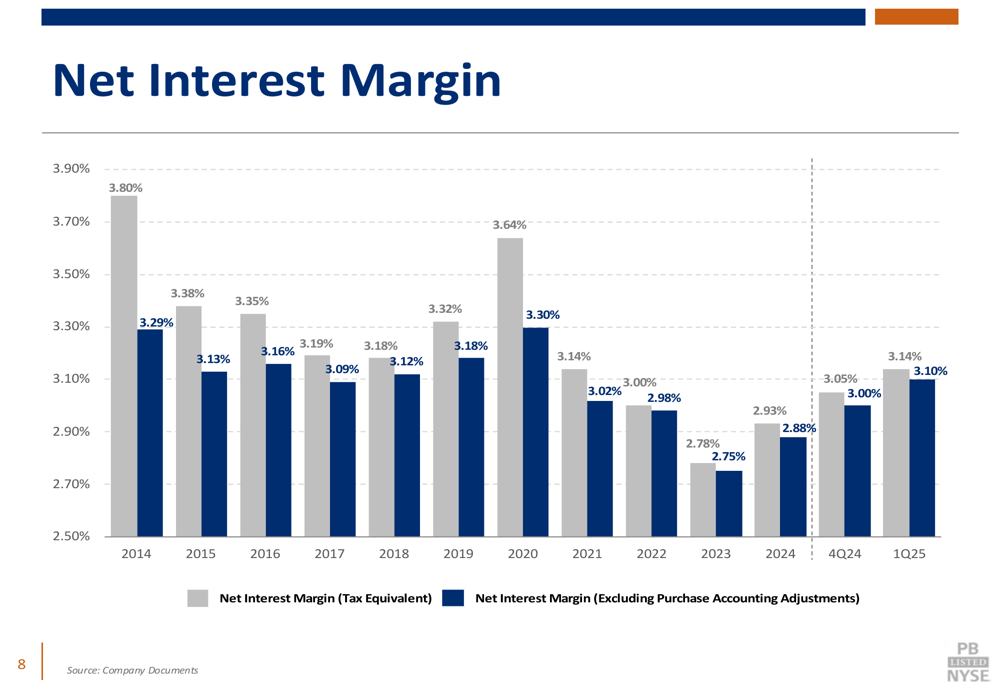
A significant driver of the improved profitability was the expansion in net interest margin (NIM), which increased by 35 basis points to 3.14% compared to the first quarter of 2024. This expansion aligns with management’s guidance from the Q4 2024 earnings call, where they projected NIM to reach between 3.25% and 3.35% by the end of 2025.
The following chart illustrates the bank’s NIM trend, showing the recent improvement:
The efficiency ratio improved to 45.7% in Q1 2025 from 46.1% in 2024, indicating better operational efficiency. This improvement is particularly notable given the challenging banking environment and aligns with the company’s focus on cost control.
Balance Sheet and Asset Quality
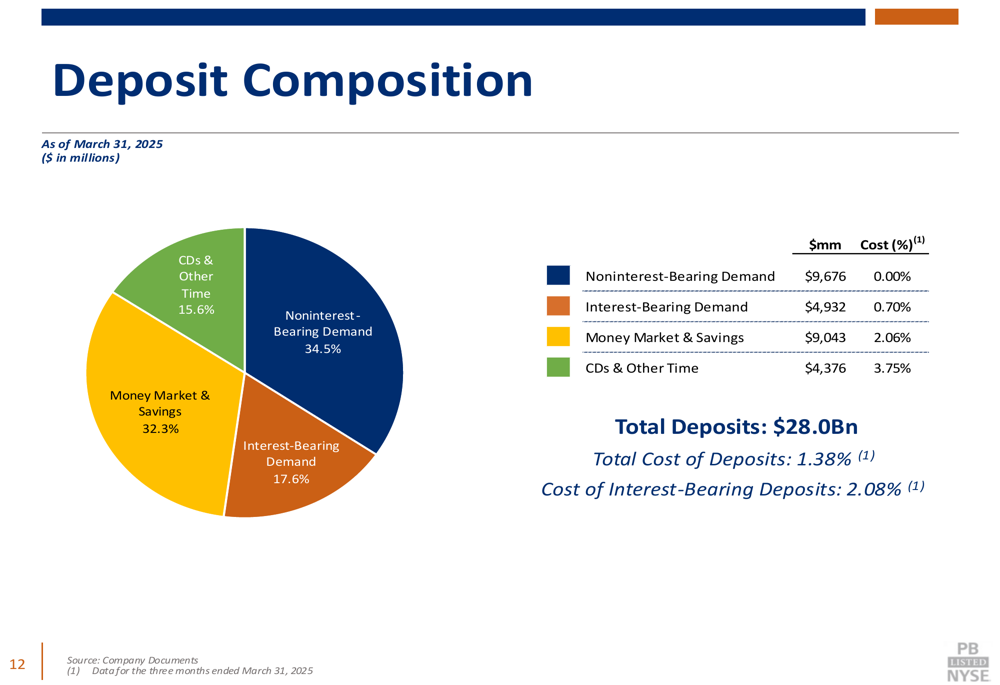
Prosperity maintains a strong deposit base with noninterest-bearing deposits of $9.7 billion, representing 34.5% of total deposits. This favorable deposit mix helps the bank maintain a relatively low cost of funds compared to peers.
The deposit composition as of March 31, 2025 is illustrated in the following chart:
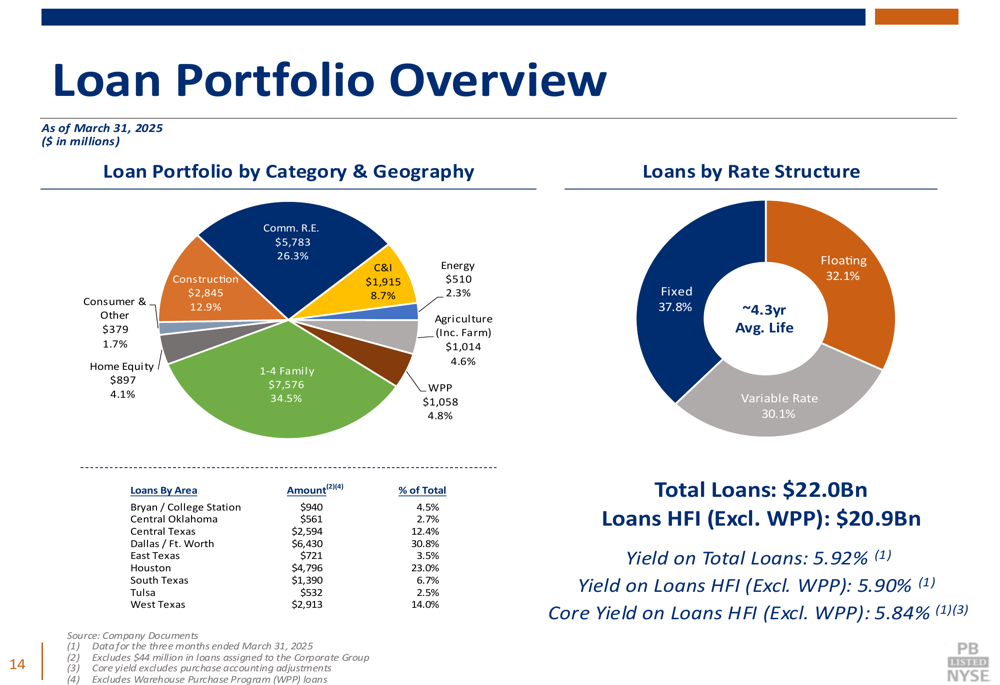
On the lending side, Prosperity reported a diversified loan portfolio with residential 1-4 family loans comprising the largest segment at 34.5% of total loans, followed by commercial real estate at 26.3%. The loan portfolio is well-balanced across different rate structures, with 37.8% fixed-rate, 30.1% variable-rate, and 32.1% floating-rate loans.
The following chart provides a detailed breakdown of the loan portfolio:
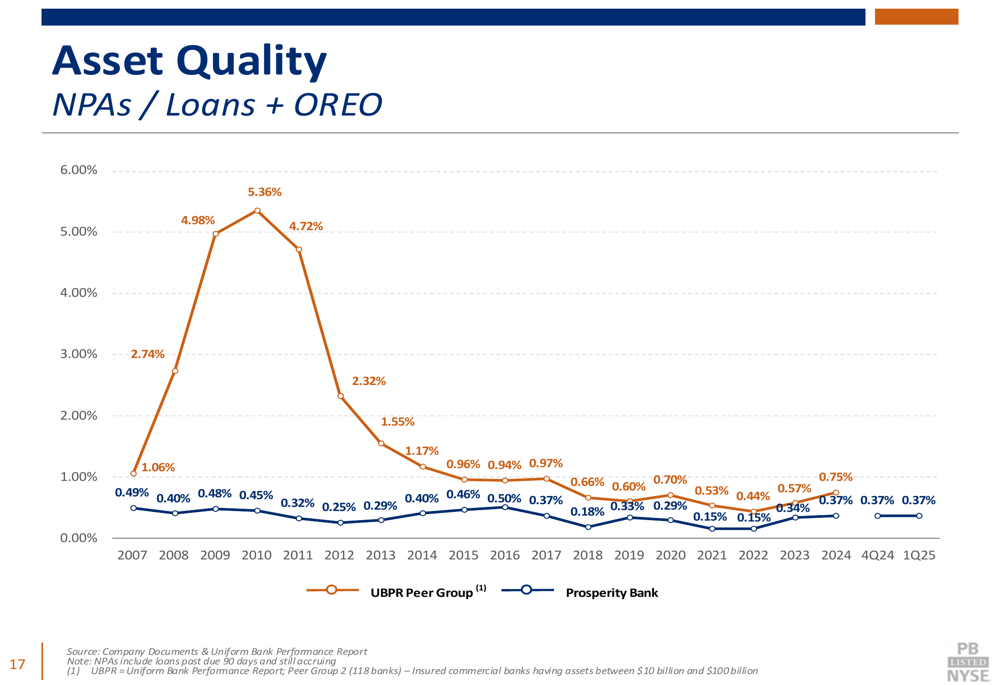
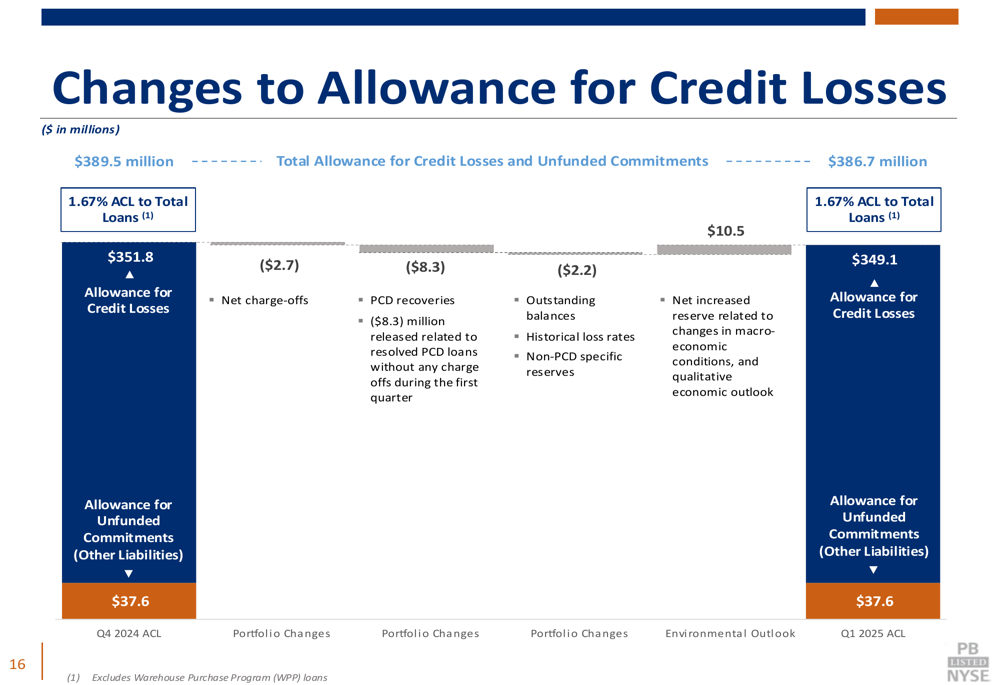
Asset quality remains strong, with nonperforming assets to average earning assets at a low 0.24%. The allowance for credit losses on loans and off-balance sheet credit exposures stood at $386.7 million, with the allowance for credit losses on loans to total loans (excluding Warehouse Purchase Program) at 1.67%.
The bank’s credit quality metrics continue to outperform its peer group, as illustrated in the following comparison:
Changes to the allowance for credit losses from Q4 2024 to Q1 2025 are detailed in the following chart, showing minimal movement and stable credit conditions:
Strategic Market Position
Prosperity Bancshares maintains a strong presence in Texas and Oklahoma, with 284 full-service banking locations strategically positioned across these high-growth markets. The company ranks #2 in deposit market share in Texas and has been recognized in Forbes’ America’s Best Banks list since its inception in 2010, ranking in the Top 10 for 14 consecutive years.
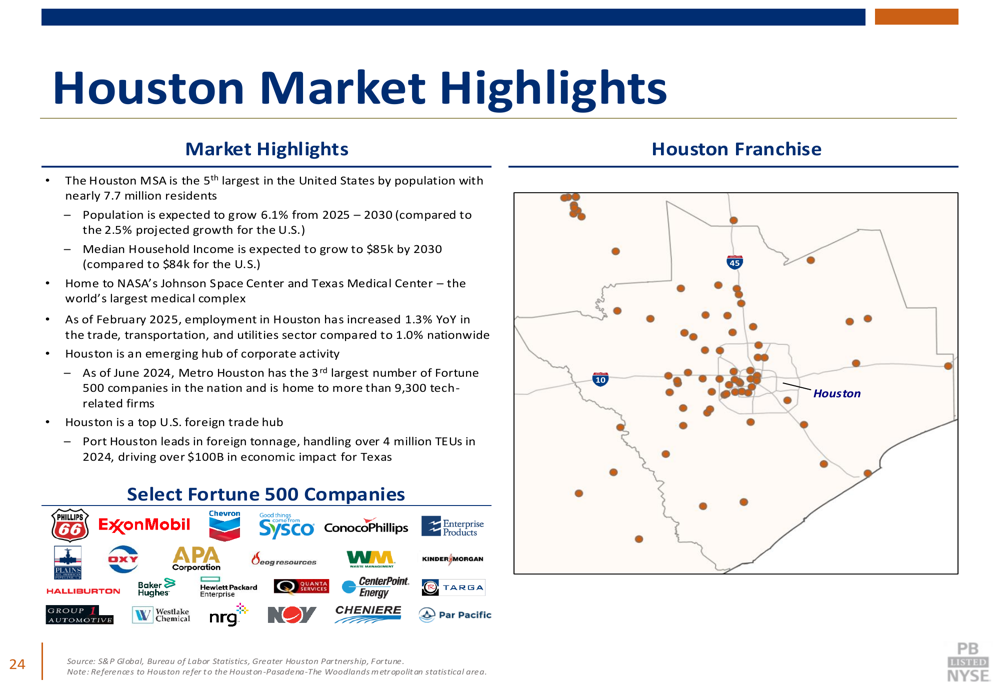
The bank’s geographic footprint is concentrated in some of the fastest-growing metropolitan areas in the United States, including Austin-Round Rock, Dallas-Fort Worth, and Houston. This positioning provides significant growth opportunities as these markets continue to expand.
As shown in the following regional breakdown, Prosperity has a substantial presence in the Houston market, which is the 5th largest MSA in the United States:
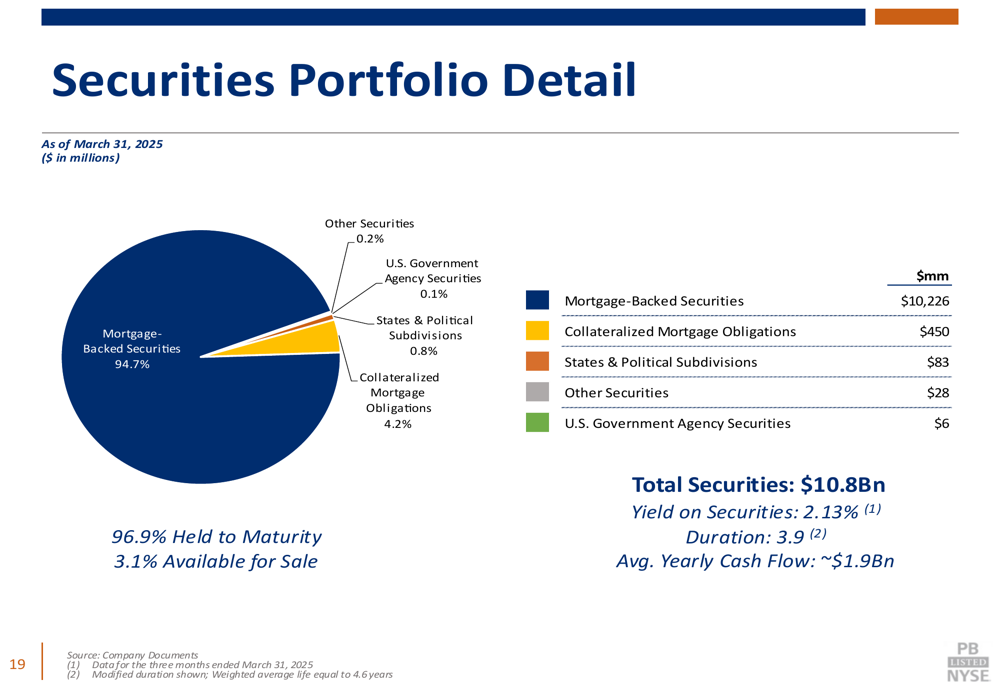
The company’s investment portfolio remains conservatively positioned, with 94.7% in mortgage-backed securities. The portfolio has a duration of 3.9 years and generates average yearly cash flow of approximately $1.9 billion, providing liquidity for reinvestment at potentially higher rates.
Forward Outlook
Prosperity Bancshares has maintained a consistent dividend growth trajectory, with a compound annual growth rate of 11.1% from 2003 to 2024. The company declared a cash dividend of $0.58 per share for the second quarter of 2025, continuing its commitment to returning capital to shareholders.
During the Q4 2024 earnings call, CEO David Zalman expressed optimism about the company’s growth prospects, noting that "the Queen Mary has turned the corner and we got the blinker switch on and we’re about to hit the Southwest Freeway." Management indicated they expect the net interest margin to continue expanding to a more normal ratio as assets reprice, thereby increasing earnings per share.
The bank’s strong capital position provides opportunities for potential mergers and acquisitions, stock repurchases, or funding organic growth without the need for additional capital. In January 2025, the company announced a stock repurchase program to acquire up to 5% of its outstanding common stock over a one-year period.
With its focus on high-growth markets in Texas and Oklahoma, conservative underwriting standards, and improving profitability metrics, Prosperity Bancshares appears well-positioned to capitalize on economic growth in its core regions while maintaining its track record of solid financial performance.
Full presentation:
This article was generated with the support of AI and reviewed by an editor. For more information see our T&C.