Gold prices slip as stronger dollar, Fed rate uncertainty weigh

PTC Inc. (NASDAQ:PTC) reported solid financial results for its third quarter of fiscal year 2025, with annual recurring revenue (ARR) growth near the high end of guidance and cash flow performance exceeding expectations. The company’s July 30 presentation, delivered by CEO Neil Barua and CFO Kristian Talvitie, highlighted PTC’s diversified product portfolio and geographic expansion strategy while maintaining disciplined financial management.
Quarterly Performance Highlights
PTC delivered reported ARR of $2.416 billion, representing 14% year-over-year growth. On a constant currency basis, ARR reached $2.372 billion, growing 9.3% year-over-year, which landed within the company’s guidance range of 8.5% to 9.5%. The company generated $244 million in operating cash flow and $242 million in free cash flow, both representing 14% year-over-year increases and exceeding the guided ranges of $234-239 million and $230-235 million, respectively.
As shown in the following chart of PTC’s Q3’25 ARR and cash flow results:
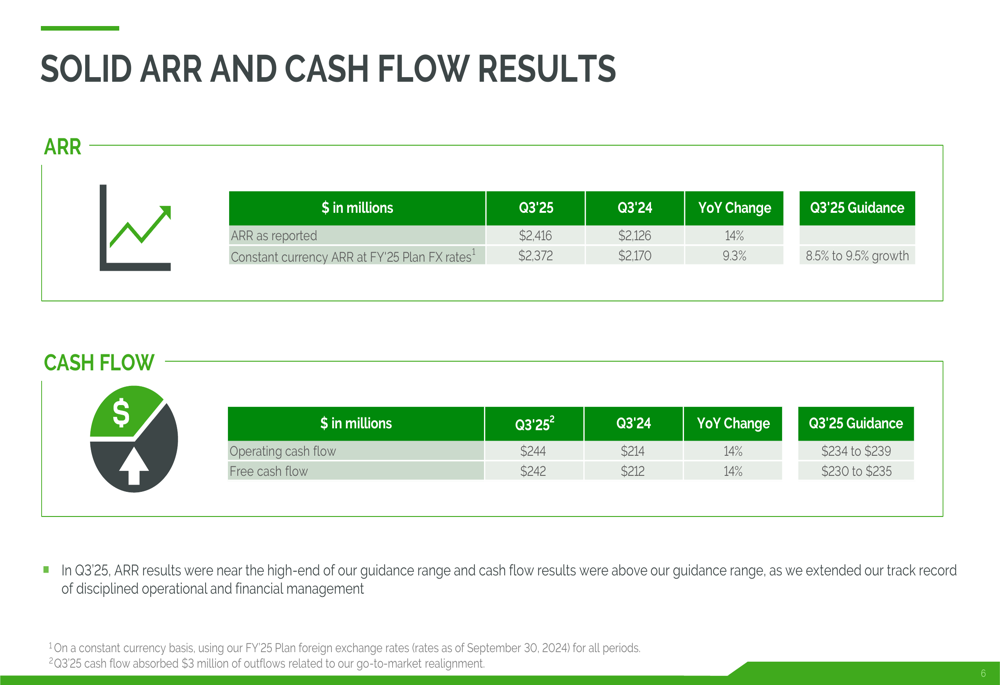
The company’s performance reflects its continued focus on disciplined management and execution of its strategic initiatives. PTC’s aftermarket stock price increased by 0.59% to $198.43 following the earnings release, indicating positive investor sentiment despite the stock trading below its 52-week high of $219.69.
Detailed Financial Analysis
PTC’s portfolio demonstrated balanced growth across product categories and geographic regions. The CAD (Computer-Aided Design) segment generated $915 million in ARR, an 8% increase from the previous year, while the larger PLM (Product Lifecycle Management) segment contributed $1.458 billion, growing 10% year-over-year.
The following breakdown illustrates PTC’s ARR by product group and geographic region:
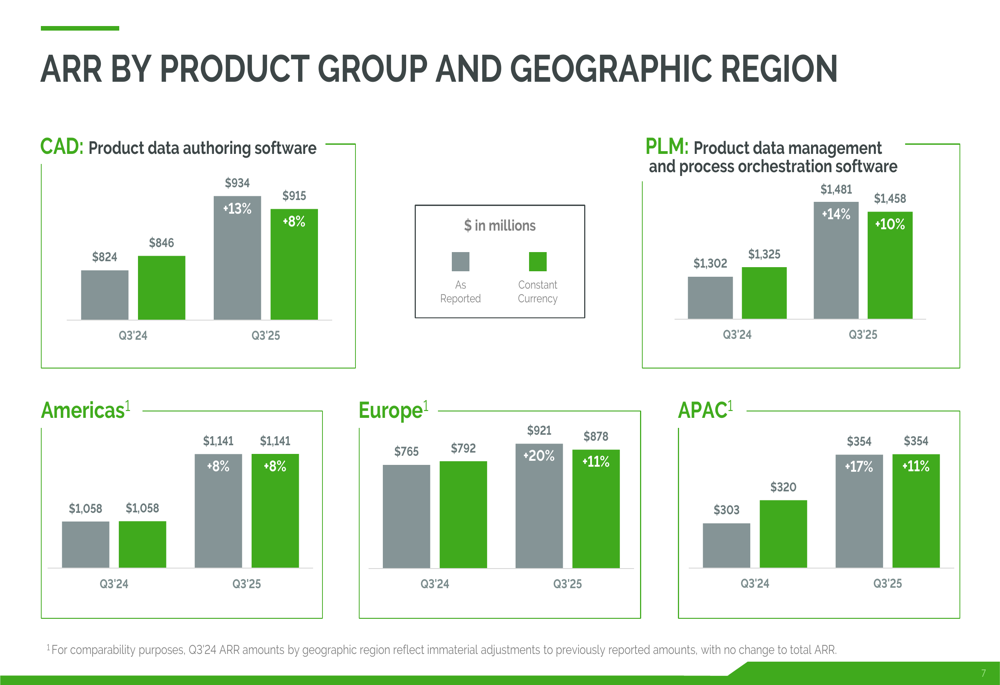
Geographically, PTC saw stronger growth outside the Americas, with both Europe and Asia-Pacific regions achieving 11% ARR growth compared to 8% in the Americas. This geographic diversification helps insulate the company from regional economic fluctuations.
The company maintained a solid balance sheet with $199 million in cash and cash equivalents. Total debt stood at $1.236 billion, resulting in a debt-to-EBITDA ratio of 1.2x, indicating conservative leverage. During Q3, PTC generated $242 million in free cash flow, allocating $156 million toward debt reduction and $75 million for share repurchases.
The following slide details PTC’s balance sheet and share repurchase program:
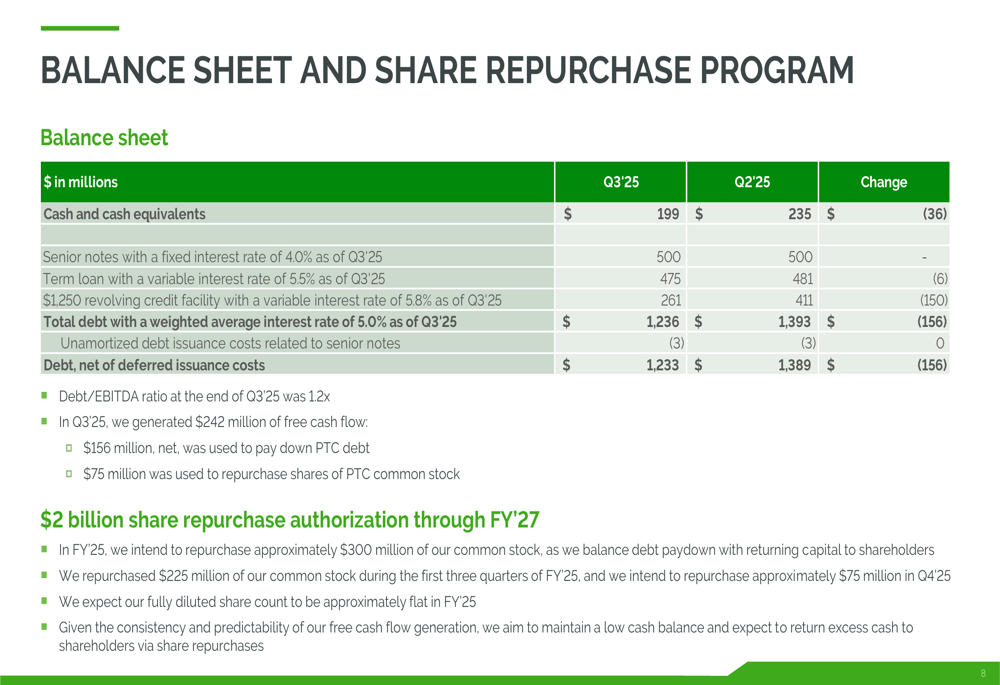
PTC continues to execute on its $2 billion share repurchase authorization through FY’27, having already repurchased $225 million of the $300 million planned for FY’25. The company expects its share count to remain approximately flat for the fiscal year, balancing repurchases with stock-based compensation.
Strategic Initiatives
PTC’s strategic positioning revolves around its diversified portfolio spanning five key areas: PLM, ALM (Application Lifecycle Management), SLM (Service Lifecycle Management), CAD, and SaaS (Software as a Service). This integrated approach helps customers accelerate time to market and manage increasing product complexity.
The following image illustrates PTC’s unique portfolio:

The company highlighted several case studies demonstrating successful customer implementations across industries. These include Codebeamer ALM cross-selling and Windchill PLM expansion at an automotive company, ServiceMax SLM expansion at a medical technology company, and Windchill+ SaaS PLM implementations at aerospace companies. These examples underscore PTC’s ability to deliver value across diverse industrial sectors while showcasing its transition toward SaaS-based offerings.
Forward-Looking Statements
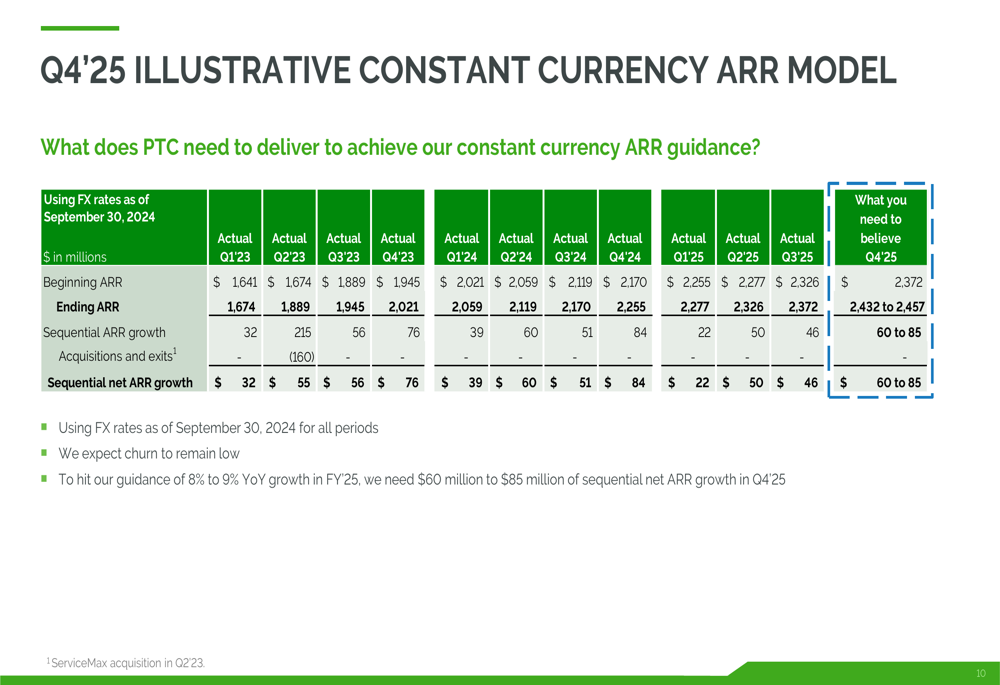
Looking ahead, PTC maintained its FY’25 constant currency ARR growth guidance at 8-9%. The company slightly raised its cash flow outlook, with FY’25 operating cash flow guidance of approximately $860 million and free cash flow of approximately $850 million. For Q4’25, PTC expects operating cash flow of $93-98 million and free cash flow of $90-95 million.
The following guidance summary outlines PTC’s financial expectations:
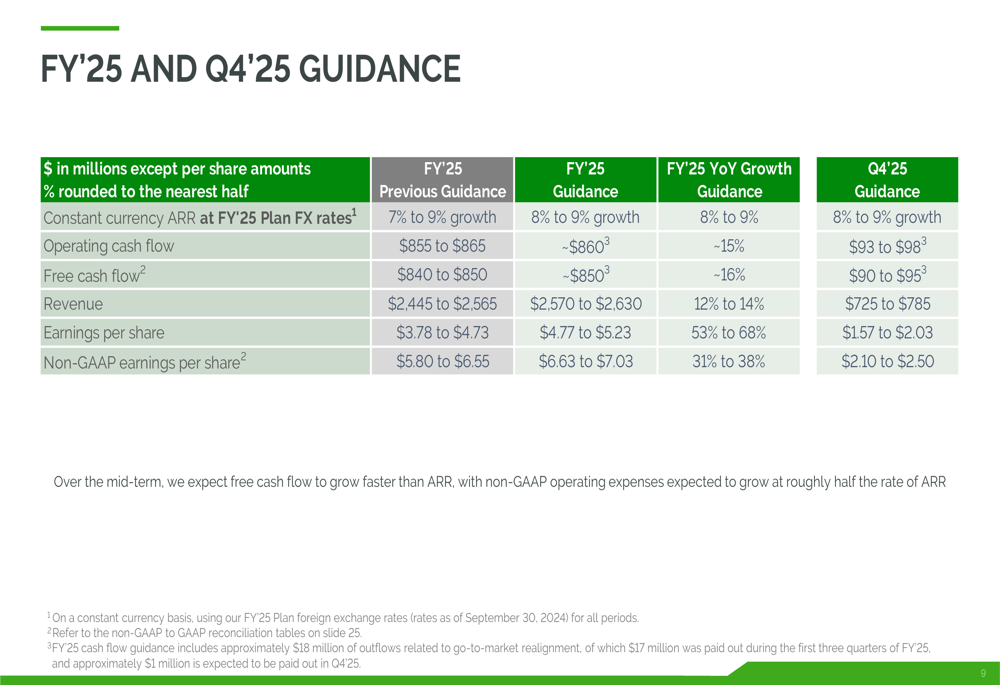
Revenue for FY’25 is projected to be between $2,570 and $2,630 million, with non-GAAP earnings per share expected to range from $6.63 to $7.03 for the full year and $2.10 to $2.50 for Q4’25.
To achieve its 8-9% constant currency ARR growth target for the fiscal year, PTC will need sequential ARR growth of $60-85 million in Q4’25, as illustrated in its constant currency ARR model:
PTC’s Q3 2025 presentation reflects a company executing well on its financial targets while continuing to expand its product portfolio and geographic reach. With strong cash flow performance, disciplined balance sheet management, and consistent ARR growth, PTC appears well-positioned to maintain its momentum through the remainder of fiscal year 2025 despite ongoing macroeconomic challenges.
Full presentation:
This article was generated with the support of AI and reviewed by an editor. For more information see our T&C.