Street Calls of the Week

Introduction & Market Context
QVC Group Inc. (NASDAQ:QVCGA) released its second quarter 2025 earnings presentation on August 7, revealing a 7% year-over-year revenue decline to $2.2 billion. While still challenging, this represents a slight improvement from the 10% decline reported in the first quarter. The company’s stock, which has traded between $2.27 and $37.23 over the past 52 weeks, closed at $3.23 on August 6, down 3% for the session.
The multi-platform retailer continues to face headwinds in the discretionary retail environment, with its customer count dropping by over 9% compared to the same period last year. Despite these challenges, the company is advancing its digital transformation strategy, particularly through social commerce initiatives like its TikTok Shop partnership.
Quarterly Performance Highlights
QVC Group reported second quarter adjusted OIBDA (Operating Income Before Depreciation and Amortization) of $232 million, representing an 18% decrease compared to the same period in 2024. The revenue breakdown shows QxH (QVC and HSN combined U.S. operations) accounting for 62% of total revenue, QVC International contributing 27%, and Cornerstone making up 11%.
As shown in the following chart of quarterly revenue and adjusted OIBDA:
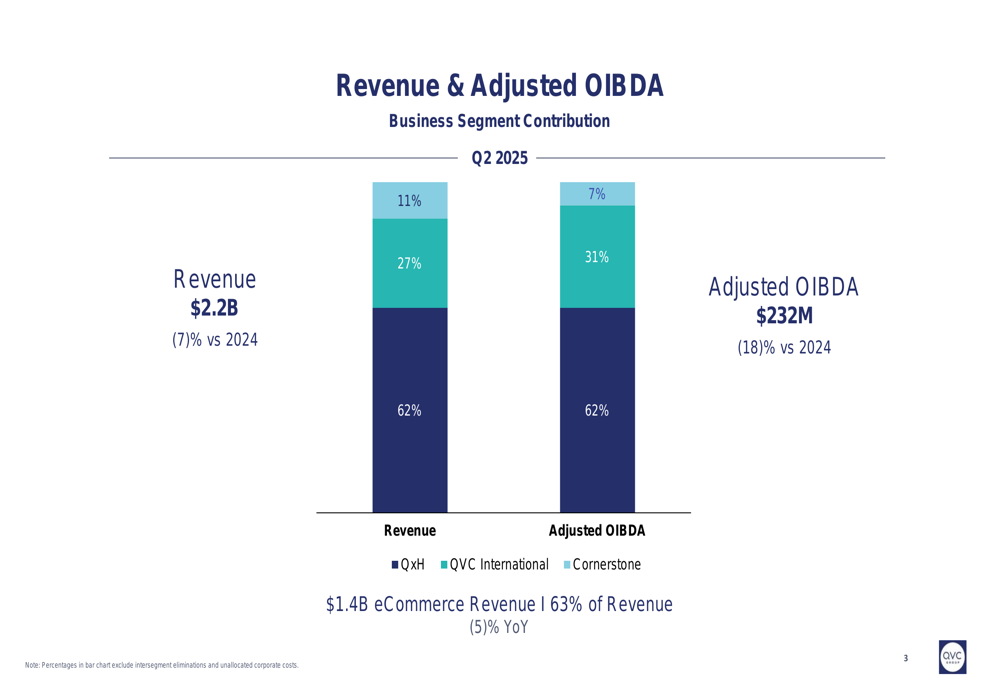
E-commerce remains a critical component of QVC’s business, generating $1.4 billion in revenue during the quarter, which represents 63% of total sales. However, even this digital segment experienced a 5% year-over-year decline.
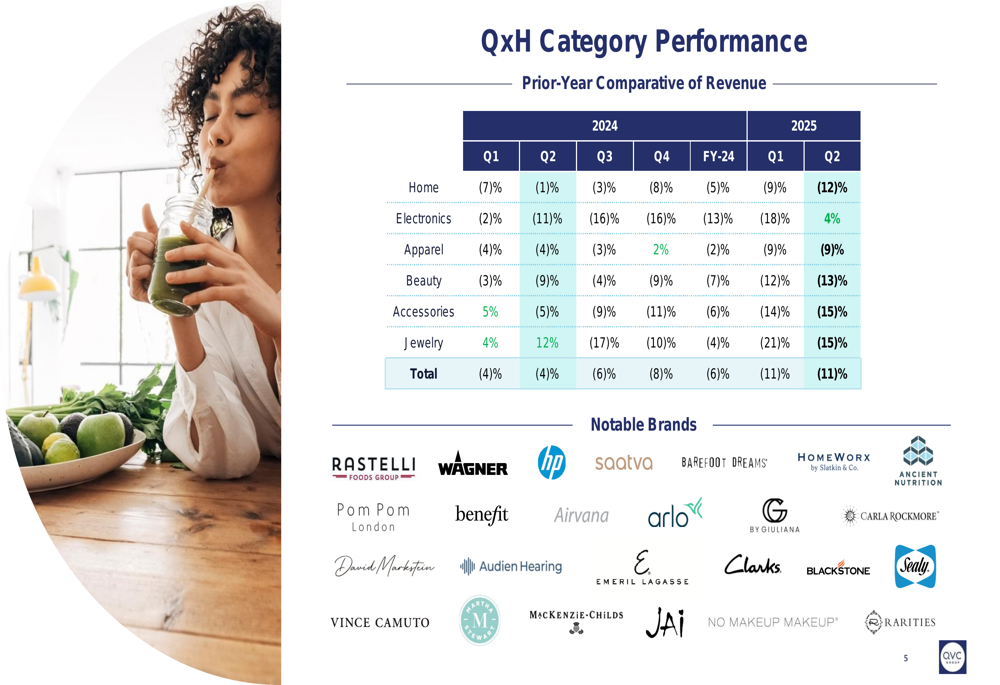
The company’s performance across product categories was mixed. Home products, which account for 38% of QxH revenue, saw a 12% decline, while Electronics, representing 5% of revenue, grew by 4%. Beauty, Accessories, and Jewelry categories showed varying degrees of resilience.
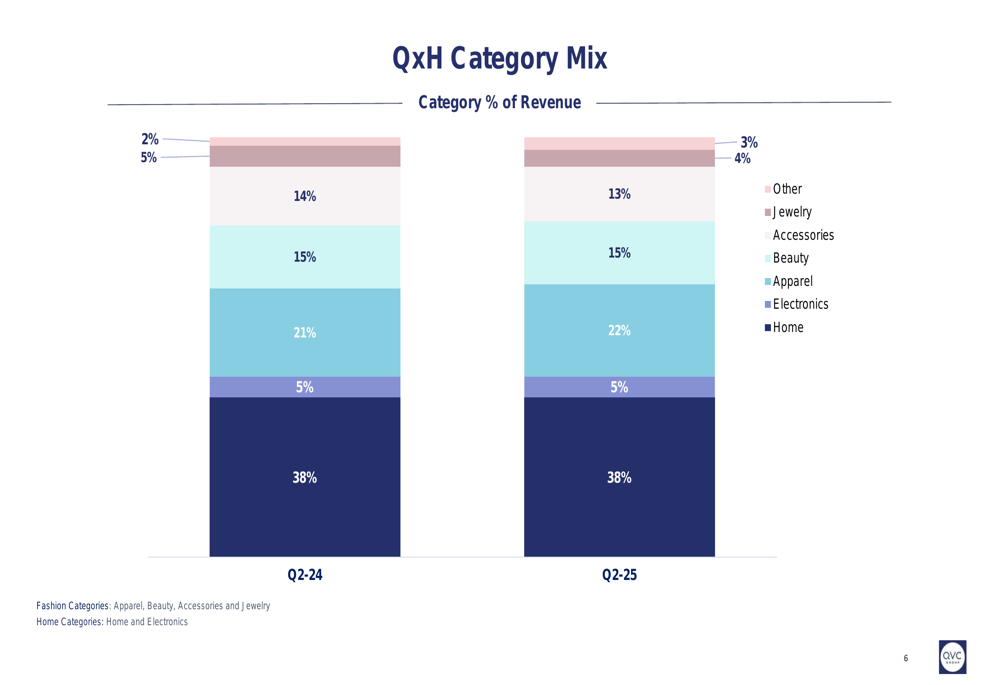
The category mix remained relatively stable year-over-year, with Home maintaining its 38% share despite the revenue decline, while Accessories slightly increased its contribution from 21% to 22% of total revenue.
Customer Trends and Digital Initiatives
QVC Group’s customer metrics reveal ongoing challenges in maintaining its customer base. Total (EPA:TTEF) customer count for the trailing twelve months ended June 2025 was 7.2 million, down from 7.9 million in June 2024. This decline was evident across all customer segments, with existing customers dropping from 4.0 million to 3.7 million, new customers falling from 1.95 million to 1.69 million, and reactivated customers decreasing from 1.98 million to 1.79 million.
The following chart illustrates this downward trend in customer count:
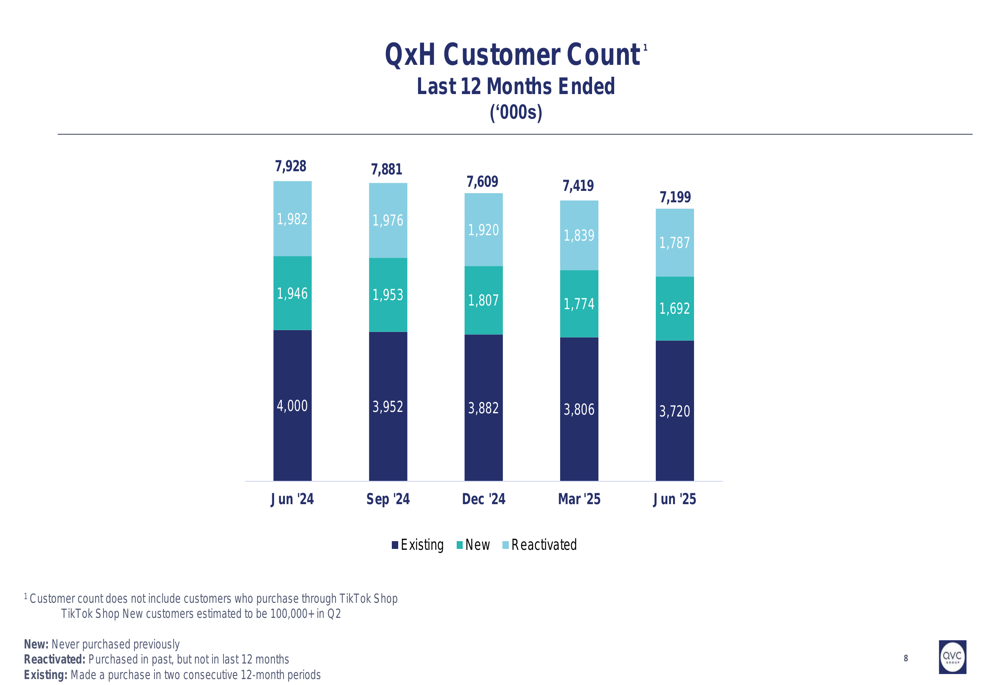
Despite the overall decline, the company highlighted that existing customers remain highly valuable, accounting for 90% of shipped sales while representing only 52% of the total customer base. The average customer purchased 31 items annually, spending approximately $1,620.
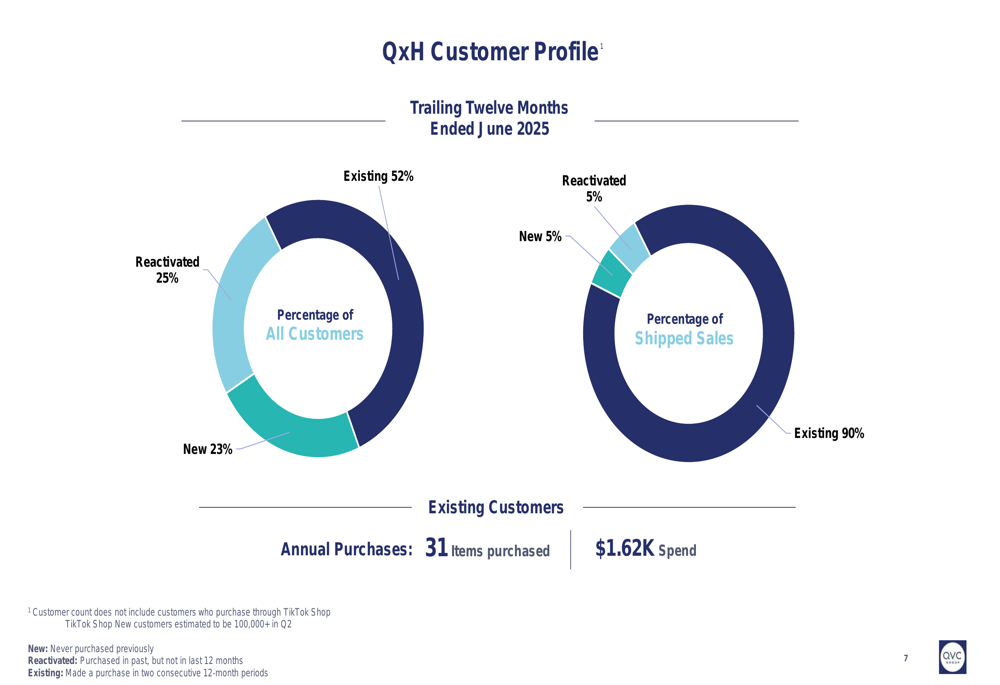
A bright spot in QVC’s digital strategy appears to be its TikTok Shop initiative, which reportedly added over 100,000 new customers in Q2. This suggests the company’s efforts to reach younger demographics through social commerce are gaining some traction, though not yet at a scale to offset broader customer losses.
Financial Health and Cash Flow
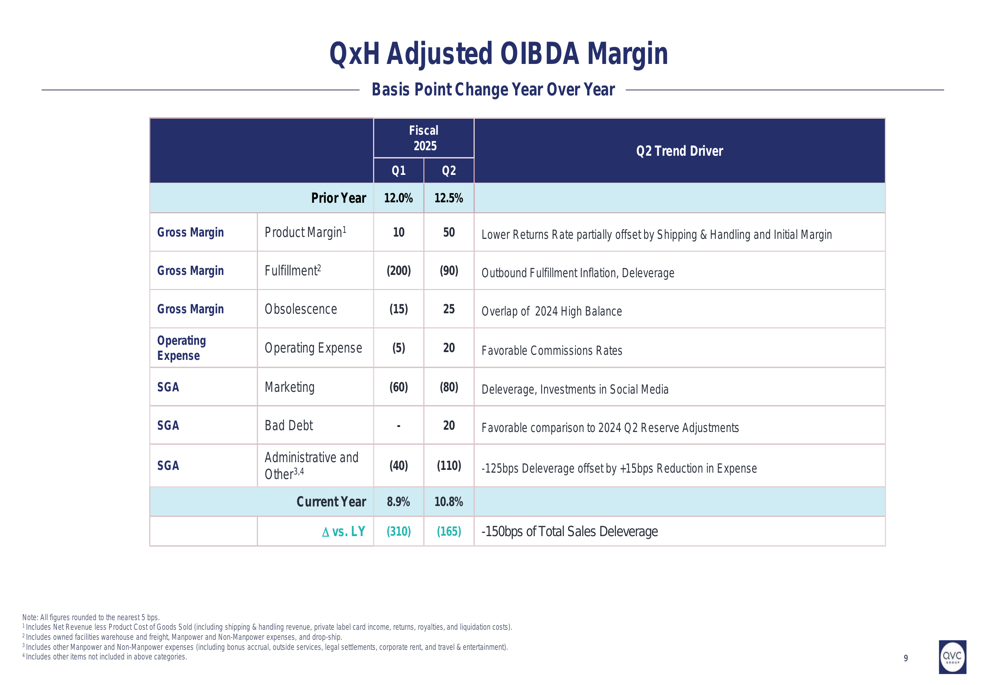
QVC Group’s adjusted OIBDA margin analysis reveals significant pressure points in the business. The QxH segment’s adjusted OIBDA margin declined by 165 basis points year-over-year to 10.8% in Q2 2025, with sales deleverage accounting for 150 basis points of this decline. While product margins improved by 50 basis points, this was more than offset by higher fulfillment costs (-90 bps), increased marketing expenses (-80 bps), and higher administrative costs (-110 bps).
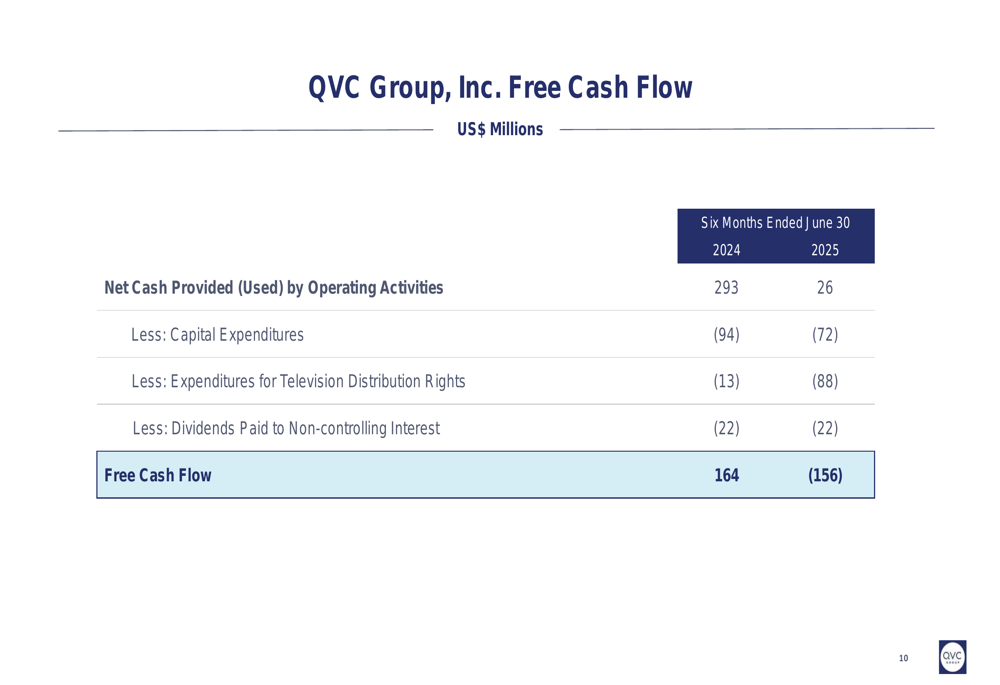
Perhaps most concerning is the company’s free cash flow, which turned negative for the six months ended June 30, 2025, at $(156) million, compared to positive $164 million in the same period of 2024. This deterioration was primarily driven by a dramatic decrease in net cash provided by operating activities, which fell from $293 million to just $26 million, coupled with increased expenditures for television distribution rights.
On the debt front, QVC, Inc.’s leverage ratio stood at 3.9x as of June 30, 2025, below its financial covenant threshold of 4.5x. This represents a slight increase from the 3.7x reported at the end of Q1 2025, indicating incremental pressure on the company’s balance sheet.
Forward Outlook
While QVC Group did not provide specific forward guidance in the presentation materials, the company’s strategic focus remains on transforming into a live social shopping company. The slight improvement in revenue decline rate from Q1 to Q2 (10% to 7%) may suggest some stabilization, though the persistent customer count erosion and negative free cash flow highlight ongoing challenges.
The company’s initiatives with TikTok Shop and other digital platforms represent potential growth avenues, but the scale of these efforts has not yet been sufficient to offset declines in traditional channels. With a leverage ratio approaching 4.0x and negative free cash flow, QVC Group’s financial flexibility remains constrained as it navigates this transition period.
Investors will likely focus on whether the company can accelerate customer acquisition through digital channels, stabilize its existing customer base, and return to positive free cash flow generation in the second half of 2025. The slight moderation in revenue decline offers a glimmer of hope, but significant challenges remain in QVC Group’s transformation journey.
Full presentation:
This article was generated with the support of AI and reviewed by an editor. For more information see our T&C.