These are top 10 stocks traded on the Robinhood UK platform in July

Introduction & Market Context
Radian Group Inc . (NYSE:RDN) released its second quarter 2025 financial results on July 31, showing steady performance in a challenging mortgage market environment. The mortgage insurer reported earnings per share growth despite a slight year-over-year decline in net income, while maintaining stable insurance in force and achieving significant book value growth.
Radian’s stock closed at $33.94 on July 30, down 1.27% for the day, trading within its 52-week range of $29.32 to $37.86. The company continues to navigate a mortgage market characterized by elevated interest rates and housing supply constraints.
Quarterly Performance Highlights
Radian reported diluted net income per share of $1.02 for Q2 2025, representing an increase from $0.98 in both Q1 2025 and Q2 2024. Net income for the quarter was $142 million, compared to $145 million in Q1 2025 and $152 million in Q2 2024. The company’s adjusted diluted net operating income per share was $1.01, consistent with the $1.01 reported in Q2 2024 and slightly higher than the $0.99 reported in Q1 2025.
As shown in the following summary of key financial metrics:
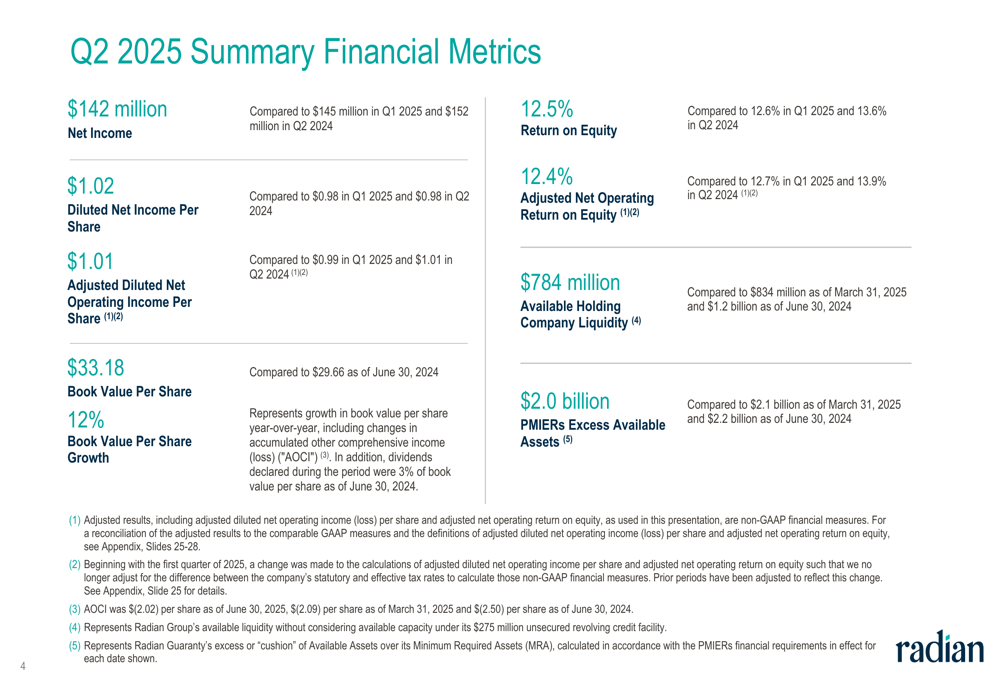
Book value per share grew significantly to $33.18 as of June 30, 2025, representing a 12% increase from $29.66 a year earlier. Return on equity was 12.5% for Q2 2025, slightly down from 12.6% in Q1 2025 and 13.6% in Q2 2024.
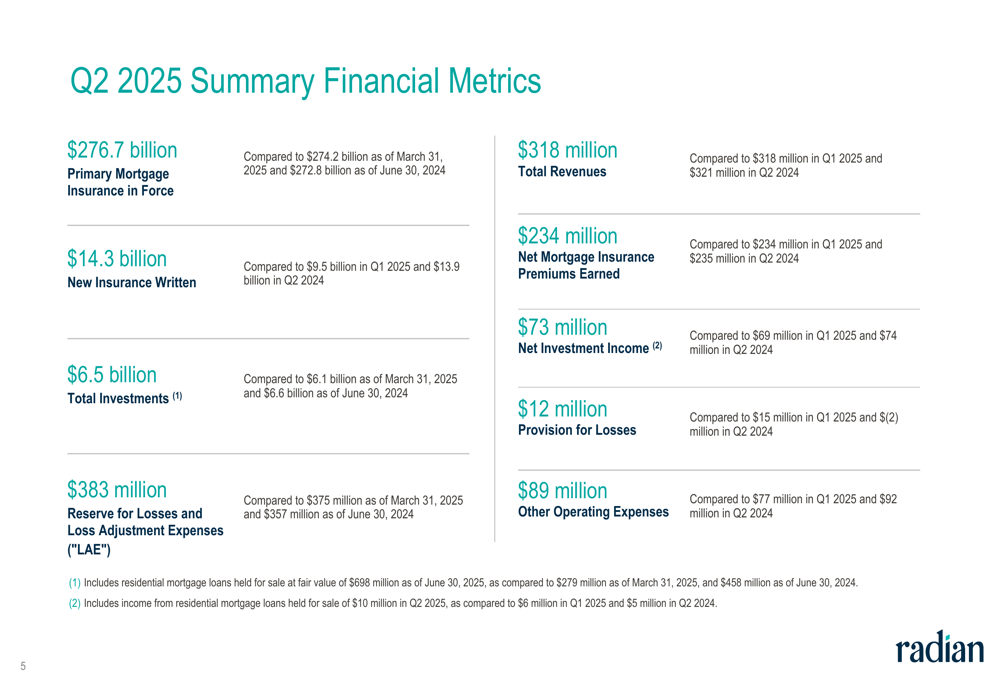
Total (EPA:TTEF) revenues remained stable at $318 million, unchanged from Q1 2025 and slightly below the $321 million reported in Q2 2024. Net mortgage insurance premiums earned were $234 million, consistent with Q1 2025 and marginally lower than the $235 million in Q2 2024.
Additional key financial metrics show stable performance across most business areas:
Detailed Financial Analysis
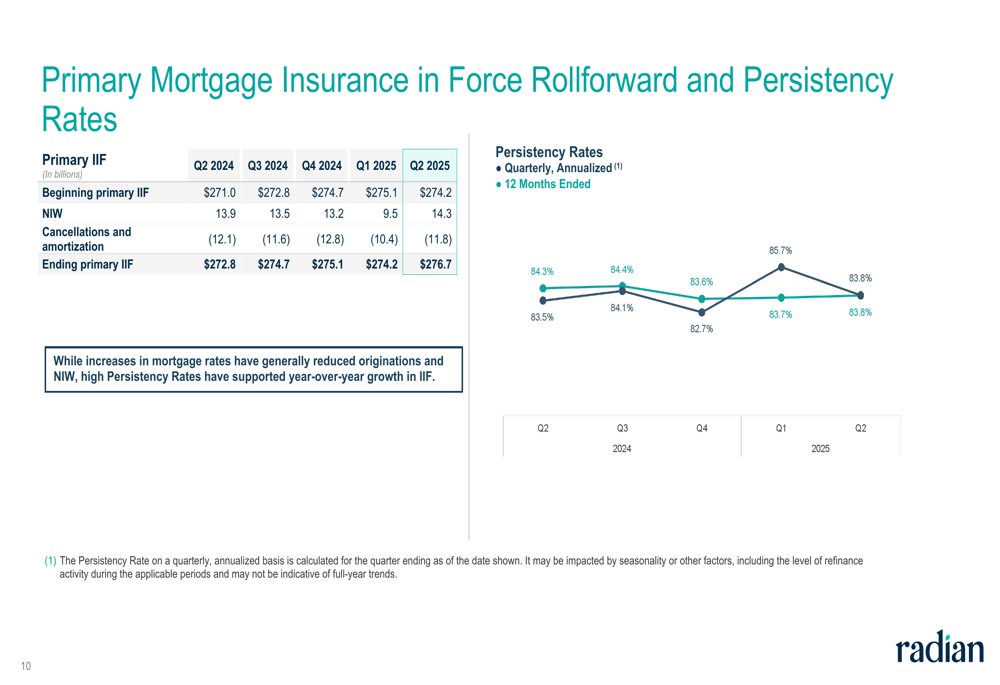
The company’s primary mortgage insurance in force grew to $276.7 billion as of June 30, 2025, up from $274.2 billion at the end of Q1 2025 and $272.8 billion a year earlier. New insurance written increased to $14.3 billion in Q2 2025, up from $9.5 billion in Q1 2025 and slightly higher than the $13.9 billion in Q2 2024.
High persistency rates have supported year-over-year growth in insurance in force despite reduced originations due to higher mortgage rates. The following chart illustrates this trend:
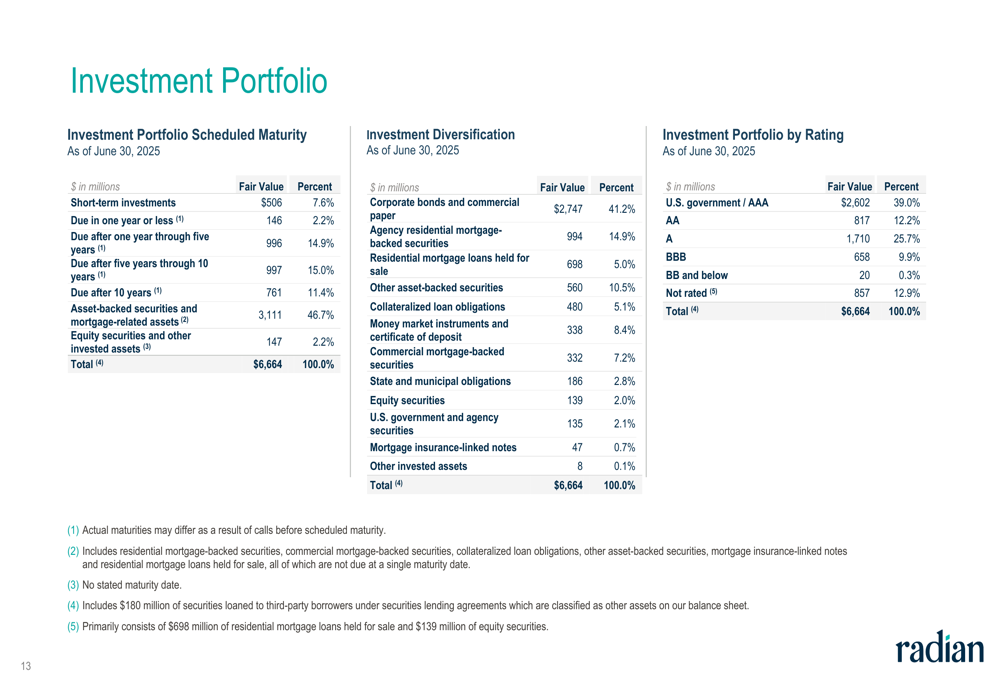
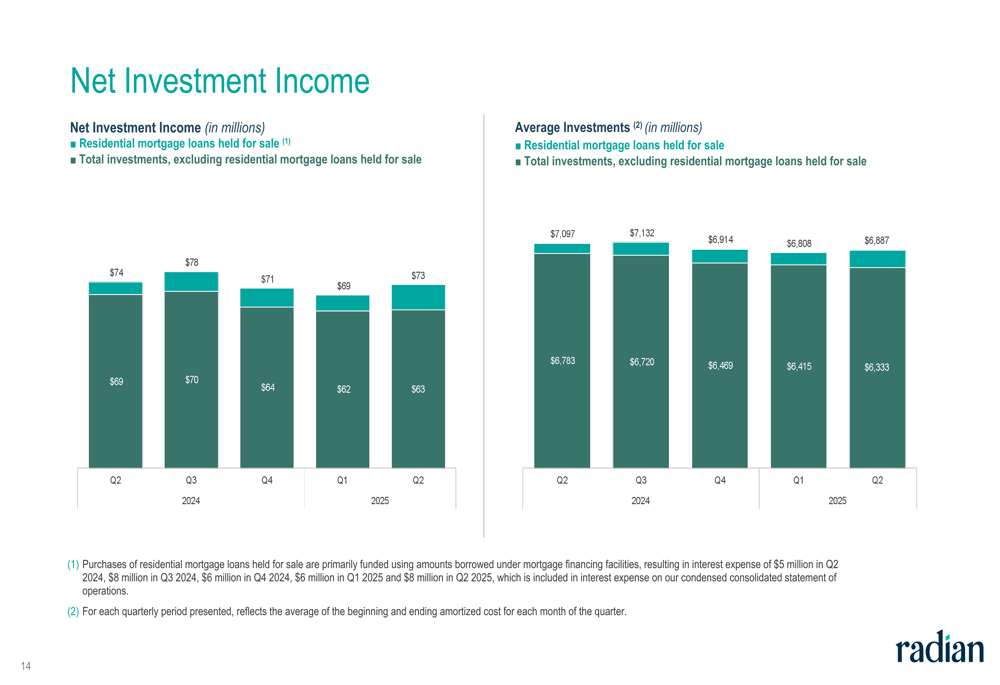
The company’s investment portfolio remains well-diversified across various asset classes and credit ratings, with a total value of $6.66 billion. Corporate bonds and commercial paper represent the largest segment at 41.2% of the portfolio, while U.S. government/AAA-rated securities account for 39.0%.
The investment portfolio breakdown demonstrates Radian’s balanced approach to managing investment risk:
Net investment income was $73 million in Q2 2025, up from $69 million in Q1 2025 but slightly down from $74 million in Q2 2024. The following chart shows the trend in net investment income:
Portfolio Quality and Risk Management
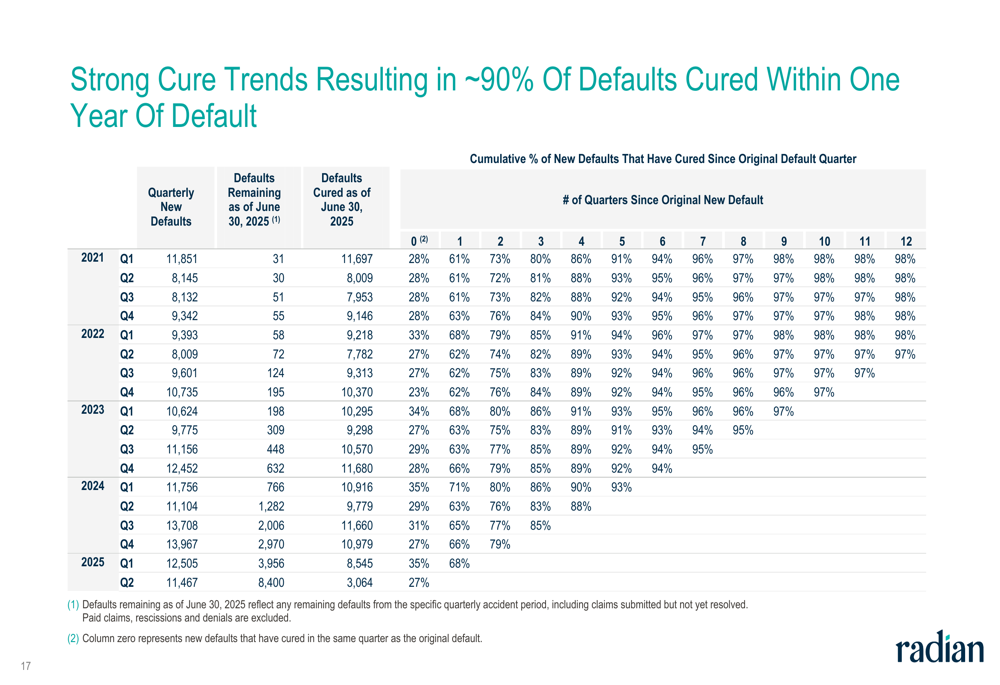
Radian’s default inventory increased to 22,258 as of June 30, 2025, compared to 20,850 a year earlier. The primary default rate rose to 2.27% from 2.04% in Q2 2024. Despite this increase, the company continues to demonstrate strong cure trends, with approximately 90% of defaults curing within one year of the initial default.
The following table highlights these impressive cure rates across different vintages:
The provision for losses was $12 million in Q2 2025, down from $15 million in Q1 2025 but up from a negative provision of $(2) million in Q2 2024. Total reserves for losses and loss adjustment expenses increased to $383 million as of June 30, 2025, compared to $357 million a year earlier.
Capital Position and Outlook
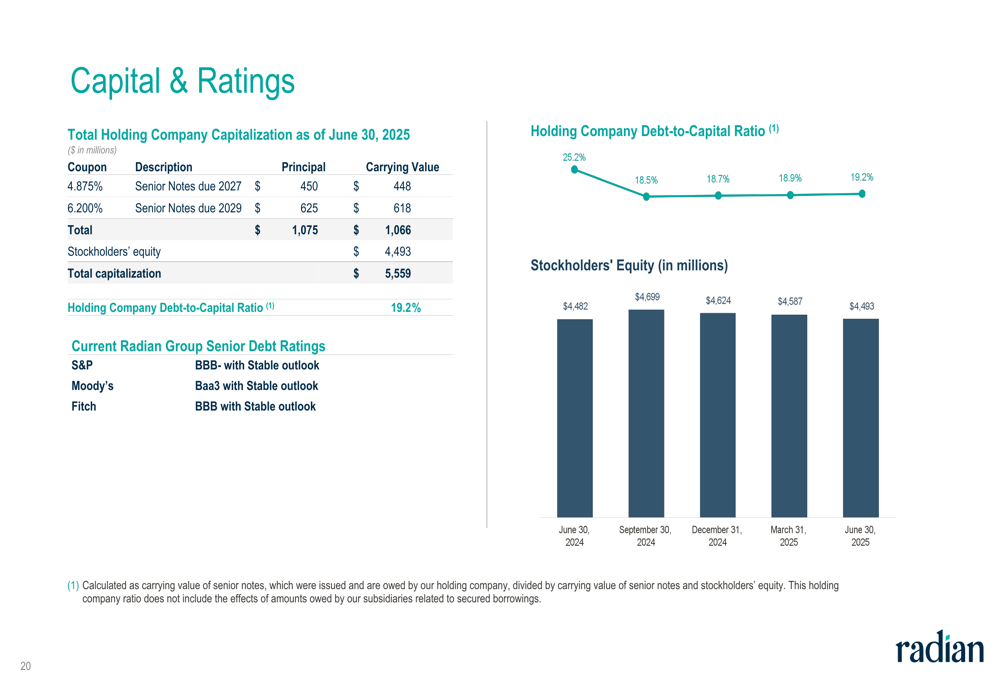
Radian maintains a strong capital position with $4.49 billion in stockholders’ equity and $1.07 billion in debt, resulting in a total capitalization of $5.56 billion. The company’s holding company debt-to-capital ratio was 19.2% as of June 30, 2025.
The following slide provides details on Radian’s capital structure and credit ratings:
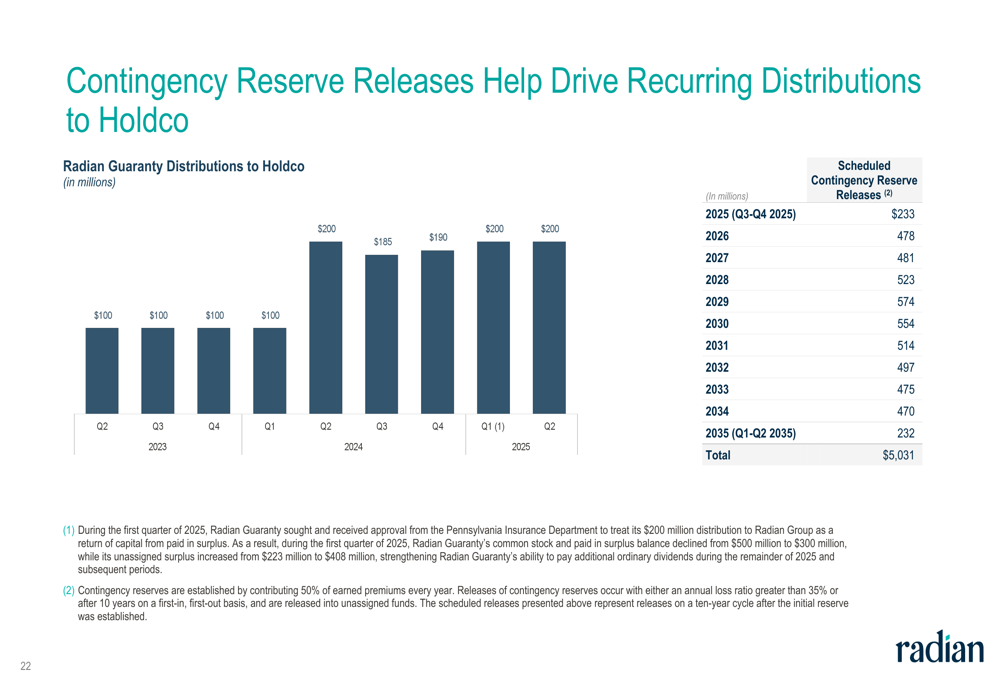
The company continues to benefit from contingency reserve releases, which help drive recurring distributions to the holding company. These scheduled releases provide visibility into future capital flows:
Radian Guaranty, the company’s principal mortgage insurance subsidiary, maintained a risk-to-capital ratio of 10.2:1 as of June 30, 2025, well below regulatory requirements. The company also reported $2.0 billion in PMIERs excess available assets, demonstrating strong compliance with regulatory capital standards despite a slight decrease from $2.2 billion a year earlier.
In the Q1 2025 earnings call, CEO Rick Thornberry had highlighted "the continued strength of our high-quality mortgage insurance in force portfolio," a theme that continues to be evident in the Q2 results. The company’s performance in Q2 2025 demonstrates resilience in a challenging market environment, with EPS growth and significant book value appreciation despite slight pressure on net income and default rates.
Full presentation:
This article was generated with the support of AI and reviewed by an editor. For more information see our T&C.