Microvast Holdings announces departure of chief financial officer

Introduction & Market Context
Rexford Industrial Realty (NYSE:REXR) presented its first quarter 2025 earnings results on April 17, 2025, highlighting the company’s resilience in a challenging market environment. The industrial REIT, which focuses exclusively on infill Southern California markets, maintained its full-year guidance despite ongoing market rent declines across its operating regions.
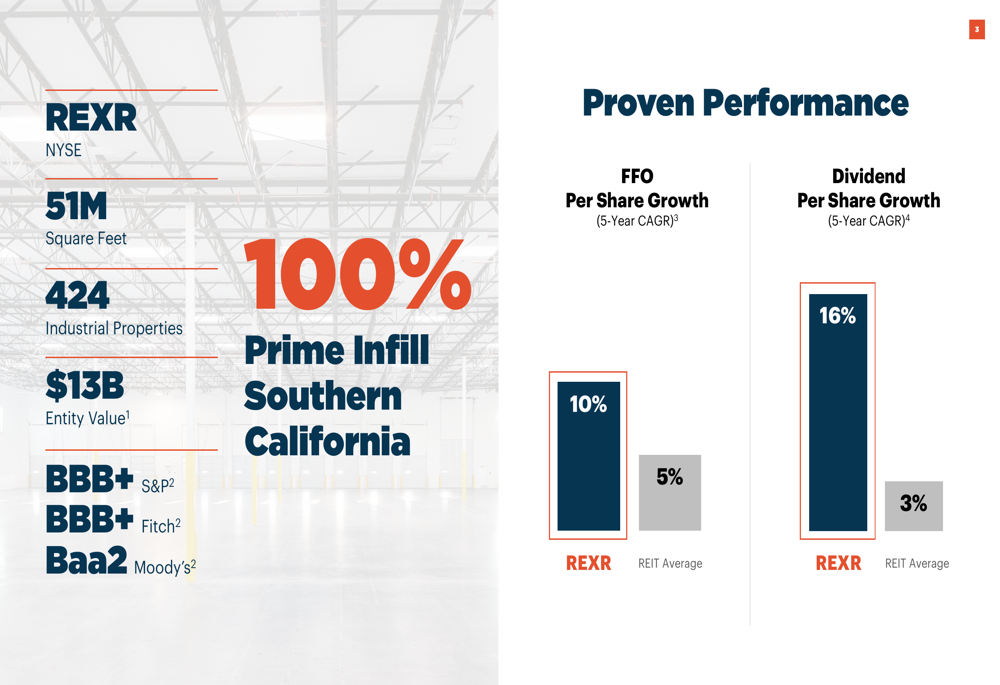
With a portfolio of 424 industrial properties spanning 51 million square feet and an entity value of $13 billion, Rexford continues to outperform the broader REIT market in key growth metrics. The company’s five-year compound annual growth rates for FFO per share (10%) and dividend per share (16%) significantly exceed REIT averages of 5% and 3%, respectively.
As shown in the following key metrics slide, Rexford maintains strong investment-grade ratings from all three major agencies, reflecting its solid financial position:
Quarterly Performance Highlights
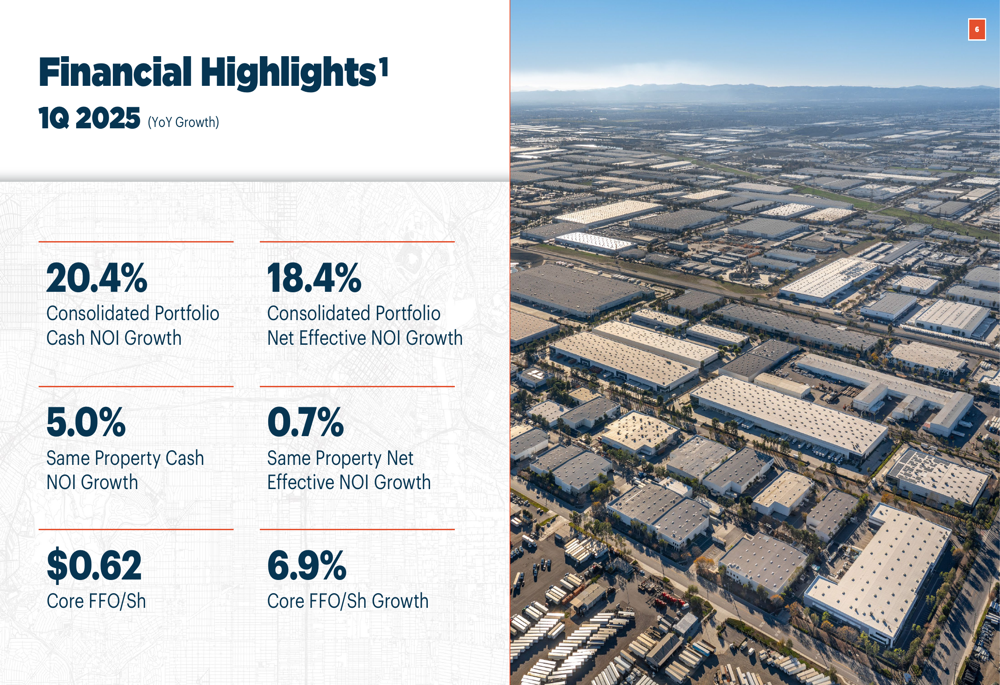
Rexford reported Core FFO of $0.62 per share for Q1 2025, representing a 6.9% increase year-over-year. The company achieved 5.0% same property cash NOI growth, while same property net effective NOI growth was more modest at 0.7%.
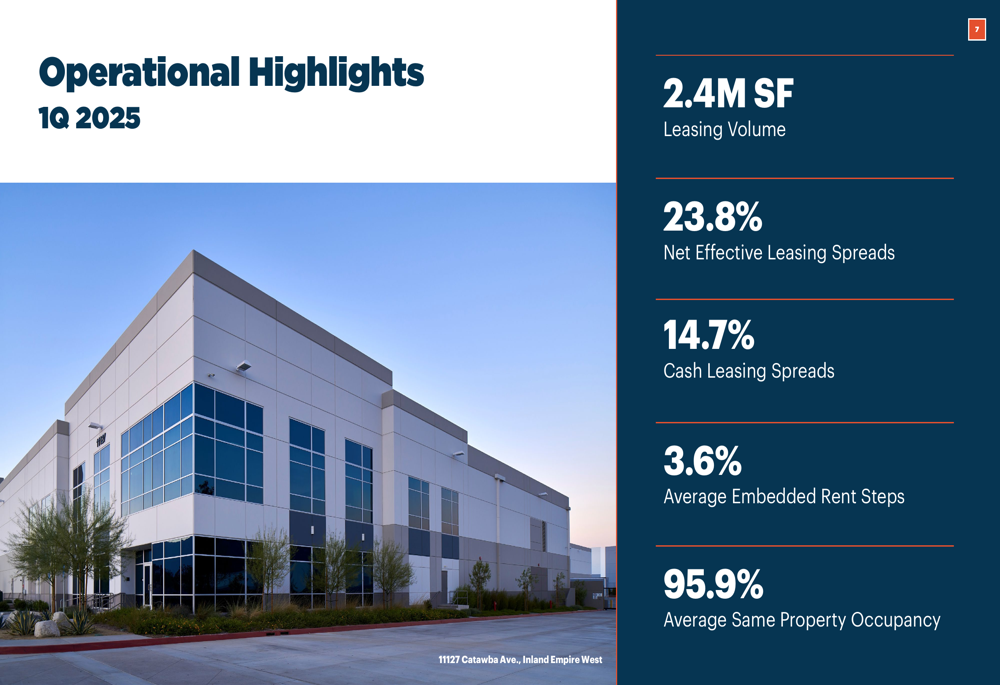
On the operational front, Rexford executed 2.4 million square feet of leasing during the quarter with impressive spreads of 23.8% on a net effective basis and 14.7% on a cash basis. The average same property occupancy stood at 95.9%, and the company maintained average embedded rent steps of 3.6% in its leases.
The following slide details the company’s financial performance for the first quarter:
Operational metrics remained strong despite challenging market conditions, as illustrated in this slide:
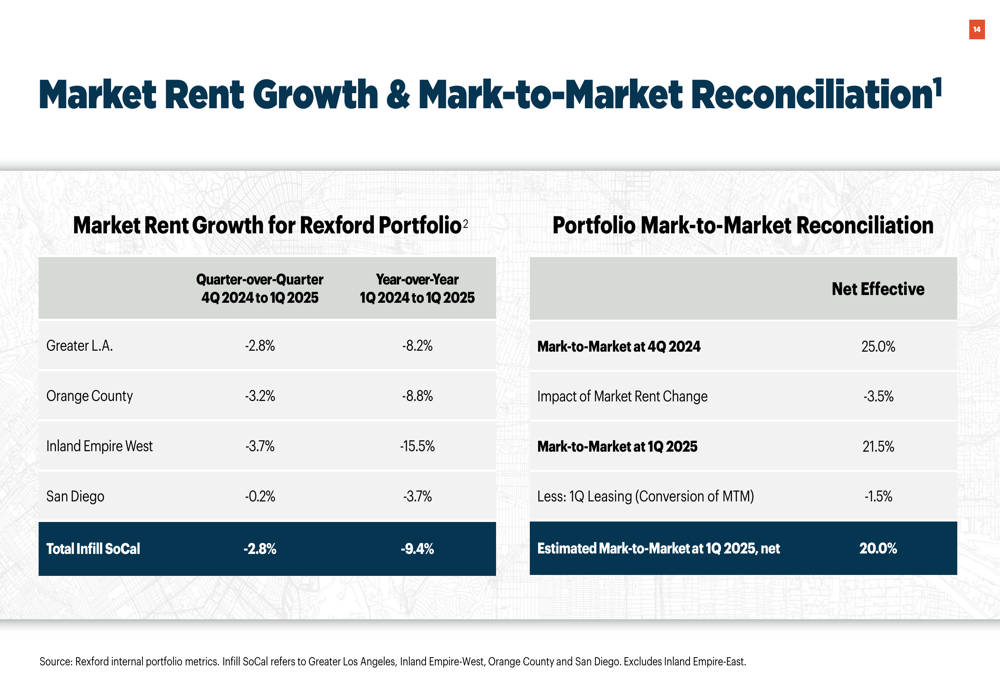
However, market rent trends present a more challenging picture. Rexford’s portfolio experienced market rent declines of 2.8% quarter-over-quarter and 9.4% year-over-year across its infill Southern California markets. The Inland Empire West submarket showed the steepest decline at 15.5% year-over-year, while San Diego performed relatively better with a 3.7% year-over-year decline.
Despite these market headwinds, Rexford’s portfolio mark-to-market stood at 21.5% at the end of Q1 2025, providing significant embedded rent growth potential as leases roll to market rates.
Strategic Capital Allocation
During Q1 2025, Rexford continued its disciplined approach to capital allocation, focusing on value-enhancing repositioning and redevelopment projects. The company stabilized five projects totaling 560,000 square feet, representing a total investment of $145.4 million and achieving an unlevered stabilized yield of 7.6%.
On the disposition front, Rexford sold two properties for a total of $103.3 million, comprising 230,000 square feet and generating an 11.9% unlevered IRR. The company also reported having $30 million of additional dispositions under contract or accepted offer.
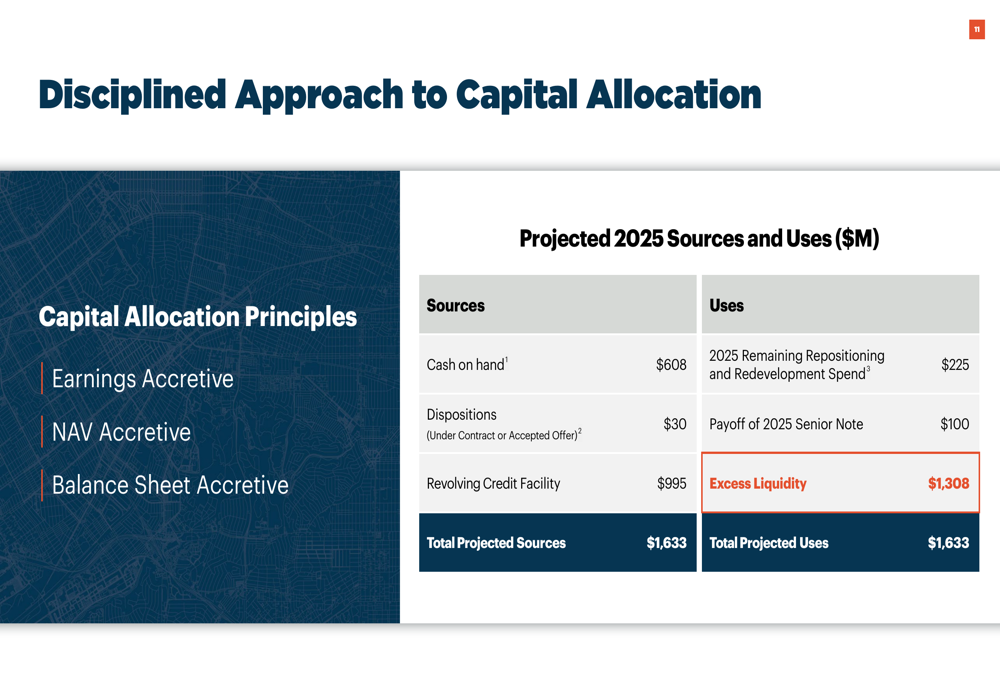
Rexford’s approach to capital allocation is guided by three key principles: earnings accretion, NAV accretion, and balance sheet accretion. For 2025, the company projects total sources of capital of $1.633 billion, including cash on hand, dispositions, and revolving credit facility availability. Planned uses include $225 million for remaining repositioning and redevelopment spend and $100 million to pay off a 2025 senior note, leaving $1.308 billion in excess liquidity.
Balance Sheet Strength
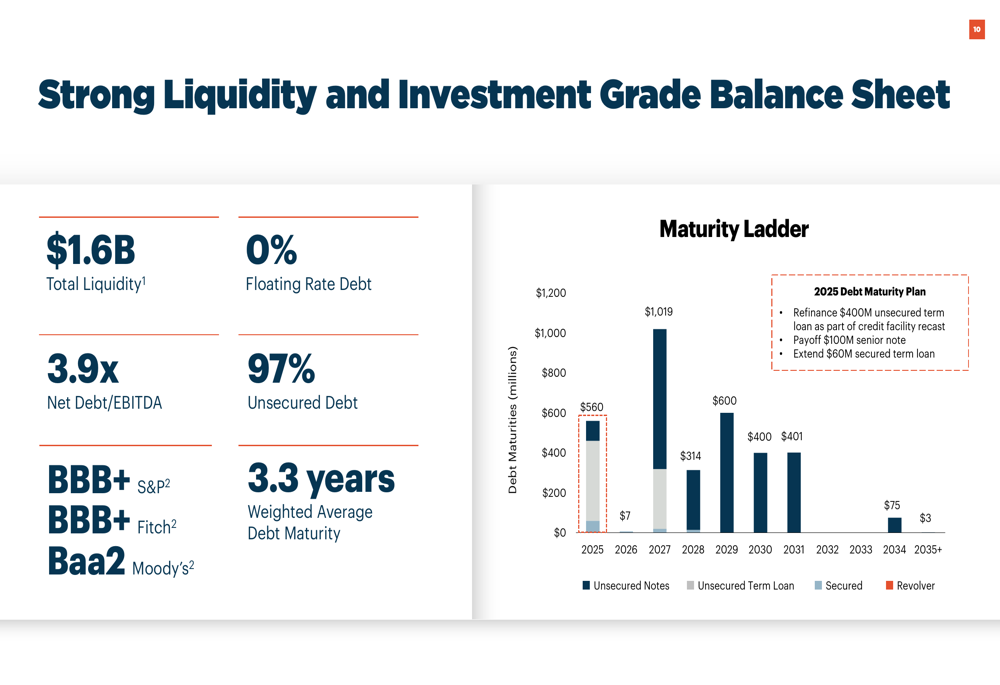
Rexford maintains a strong balance sheet with $1.6 billion in total liquidity and a conservative leverage profile with net debt to EBITDA of 3.9x. Notably, the company has no floating rate debt, insulating it from interest rate volatility, and 97% of its debt is unsecured.
The company’s debt maturity ladder is well-structured, with a weighted average debt maturity of 3.3 years and no significant maturities until after 2025. This financial flexibility positions Rexford to navigate market uncertainties while maintaining capacity for opportunistic investments.
Forward-Looking Statements & Guidance
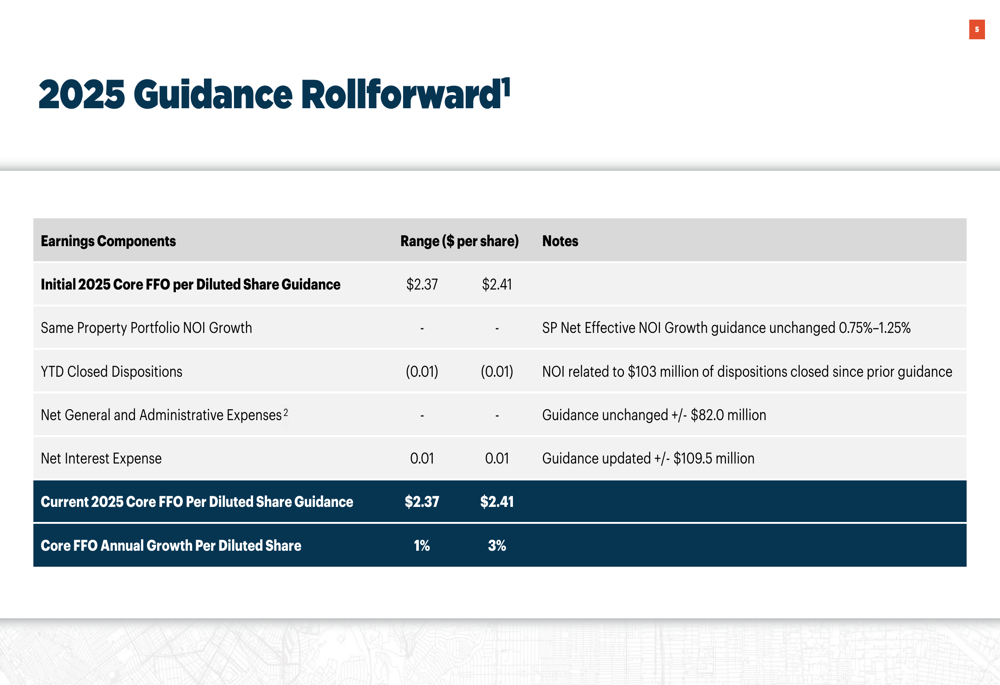
Despite market headwinds, Rexford maintained its 2025 Core FFO per diluted share guidance of $2.37-$2.41, representing 1-3% annual growth. The company’s guidance rollforward shows minimal changes from its initial outlook, with a $0.01 reduction from YTD closed dispositions offset by a $0.01 improvement in net interest expense.
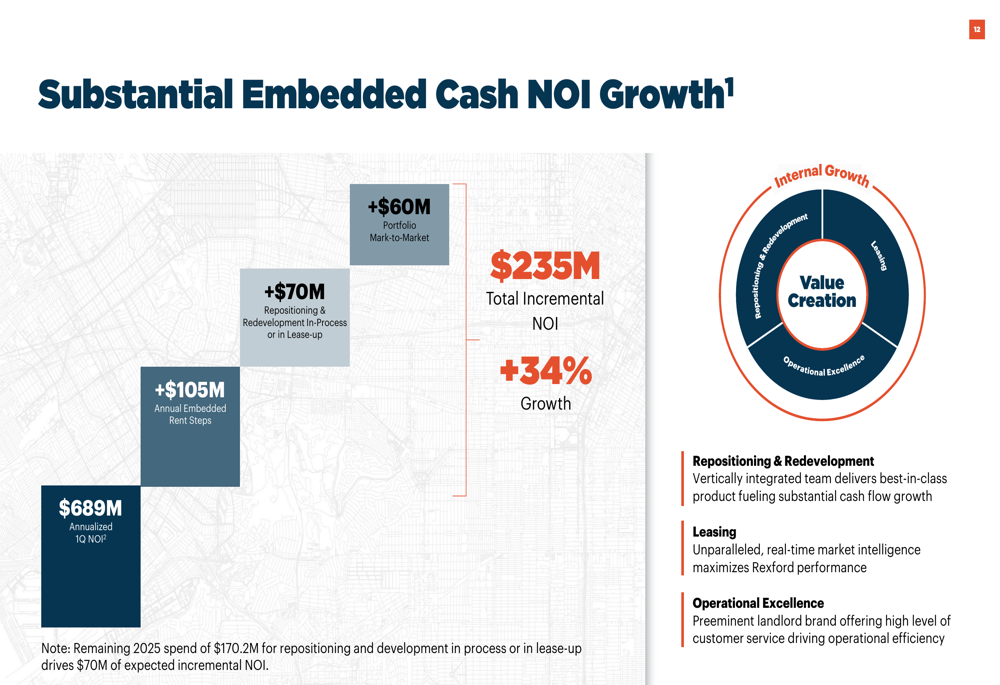
Perhaps most significantly, Rexford highlighted substantial embedded cash NOI growth within its existing portfolio. The company projects $235 million in total incremental NOI, representing 34% growth, driven by portfolio mark-to-market ($60 million), repositioning and redevelopment projects in process or lease-up ($70 million), and annual embedded rent steps ($105 million).
This embedded growth provides Rexford with a significant cushion against market rent declines and positions the company for continued FFO growth even in a challenging leasing environment.
In summary, Rexford Industrial Realty’s Q1 2025 presentation demonstrates the company’s resilience in navigating market headwinds while maintaining its growth trajectory. With a strong balance sheet, disciplined capital allocation strategy, and substantial embedded NOI growth potential, Rexford remains well-positioned within its exclusive infill Southern California industrial markets despite ongoing market rent declines.
Full presentation:
This article was generated with the support of AI and reviewed by an editor. For more information see our T&C.