Raytheon awarded $71 million in Navy contracts for missile systems

Introduction & Market Context
Runway Growth Finance Corp (NASDAQ:RWAY) released its second quarter 2025 investor presentation on August 7, highlighting the company’s performance in a venture debt market that remains resilient despite broader market volatility. The business development company (BDC) maintained a stable portfolio value of $1.025 billion while improving its net asset value (NAV) per share.
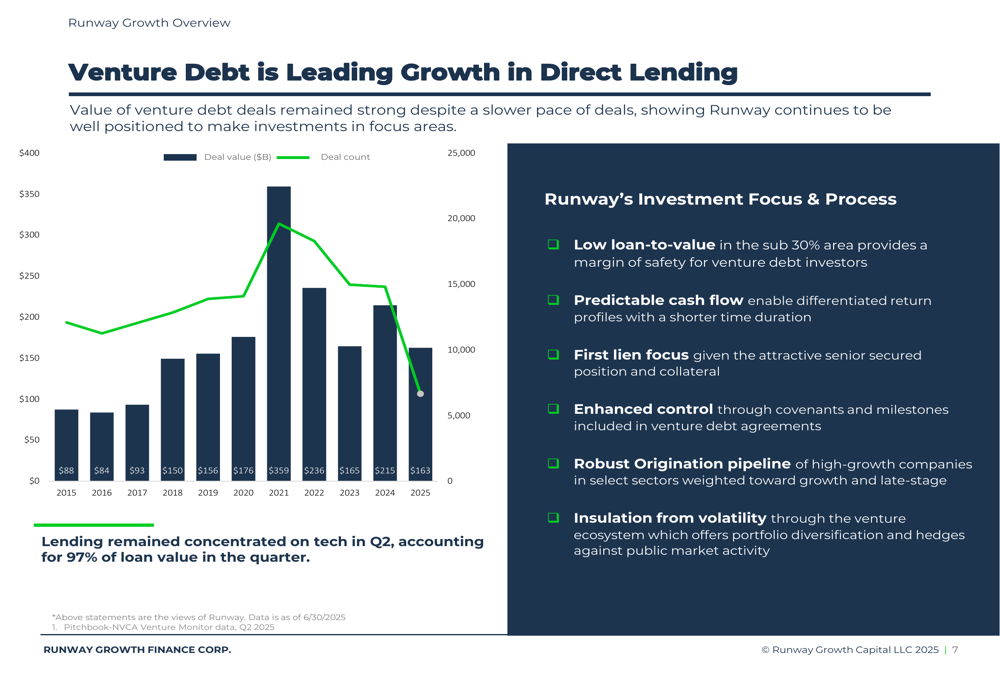
The presentation emphasized Runway’s position in the venture debt ecosystem, which has shown continued strength despite a slower pace of deals. According to the company’s market analysis, venture debt deal values reached $163 billion in 2025, down from the $215 billion in 2024 but still significantly higher than pre-2020 levels.
As shown in the following chart of venture debt’s growth in direct lending:
Portfolio Performance Highlights
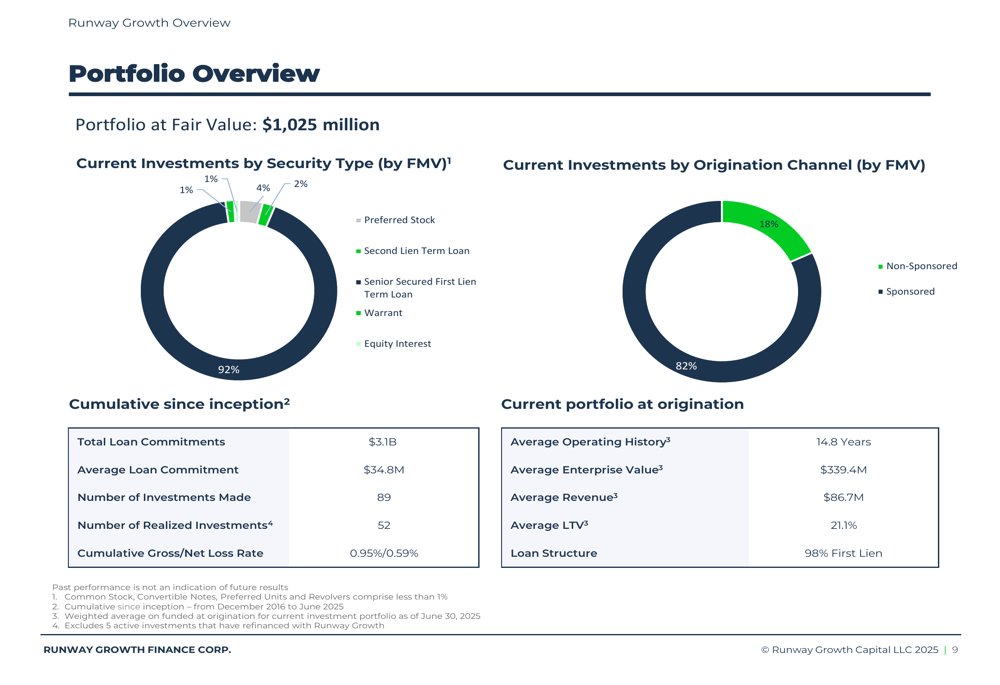
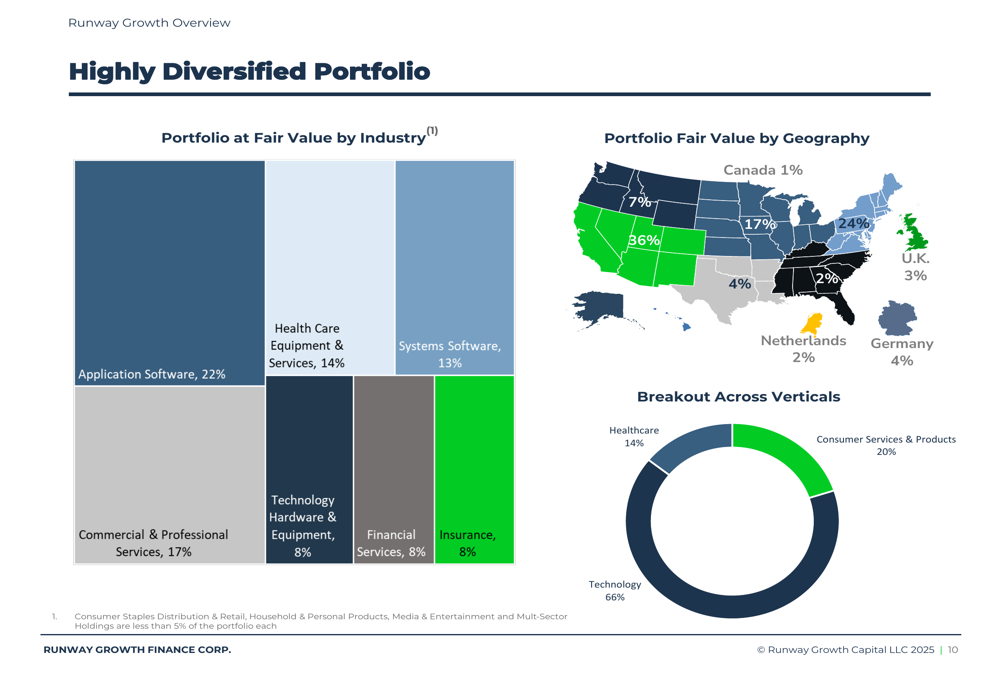
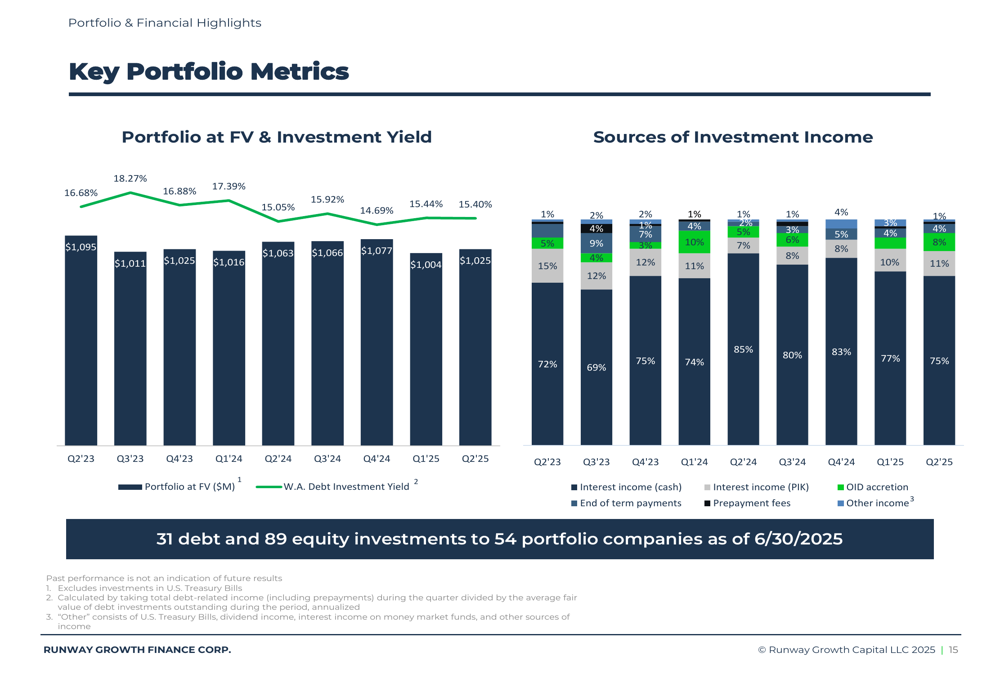
Runway’s portfolio remained relatively stable at $1.025 billion fair value in Q2 2025, compared to $1.004 billion in Q2 2023. The company maintained a well-diversified portfolio across industries and geographies, with technology sectors representing 66% of investments, consumer services and products at 20%, and healthcare at 14%.
The portfolio composition demonstrates Runway’s focus on senior secured lending, with 92% of investments in senior secured first lien term loans. The company’s origination strategy continues to favor non-sponsored deals (82%) over sponsored transactions (18%), reflecting its direct relationship approach with venture-backed companies.
The following chart provides a comprehensive overview of the portfolio composition:
Geographic and industry diversification remains a key strength, with investments spread across multiple regions and sectors. Application software represents the largest industry concentration at 22%, followed by commercial and professional services at 17%, and healthcare equipment and services at 14%.
As illustrated in this diversification breakdown:
Credit Quality and Risk Management
Runway emphasized its disciplined approach to credit underwriting, maintaining a weighted average loan-to-value ratio of 21.1% at origination. This conservative approach has resulted in strong credit performance, with a cumulative net loss rate of just 0.59% since inception across 89 investments.
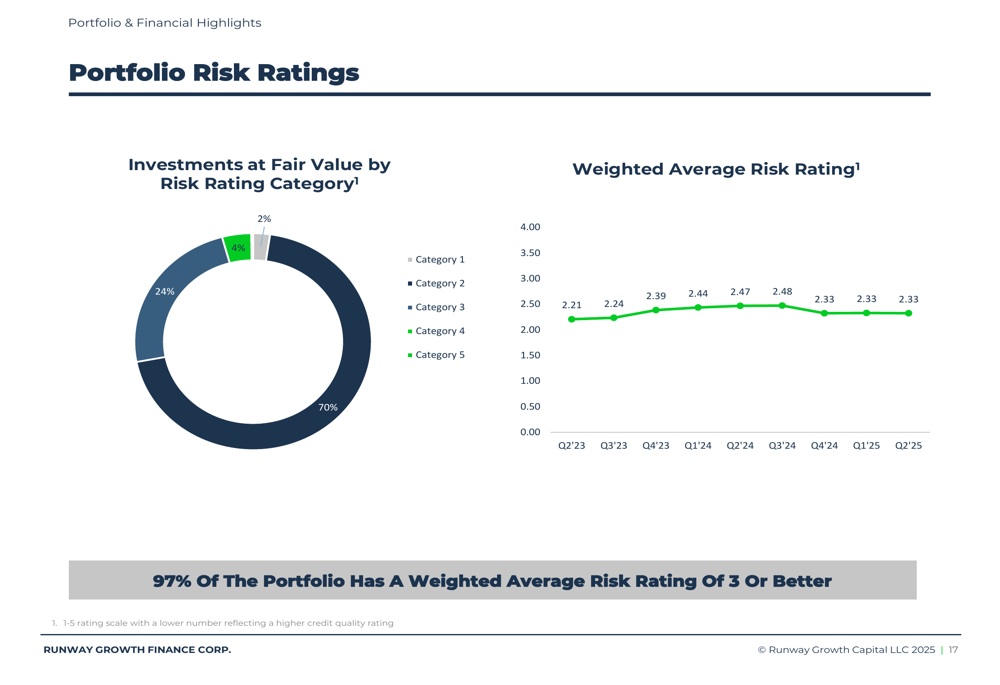
The company’s risk rating system shows that 97% of the portfolio has a weighted average risk rating of 3 or better, with 70% of the portfolio in the highest quality Category 5. The weighted average risk rating has remained relatively stable between 2.21 and 2.48 from Q2 2023 to Q2 2025.
The portfolio risk ratings are visualized in the following chart:
Runway’s approach to underwriting focuses on structural protections, including low loan-to-value ratios, structured amortization schedules, and active portfolio monitoring. The company emphasizes understanding the "core vs. growth" aspects of borrowers’ cash burn and implementing covenants that allow for early intervention before problems become critical.
Strategic Initiatives and Growth Levers
A significant strategic development highlighted in the presentation is Runway’s relationship with BC Partners, which has expanded the company’s capabilities across the venture growth ecosystem. This combination has created a platform with approximately $10 billion in assets under management and a global presence with eight offices across the US, UK, and Canada.
The presentation outlined three key growth levers following the BC Partners combination:
1. Enhanced financing solutions
2. Expanded origination channels
3. Augmented access to capital
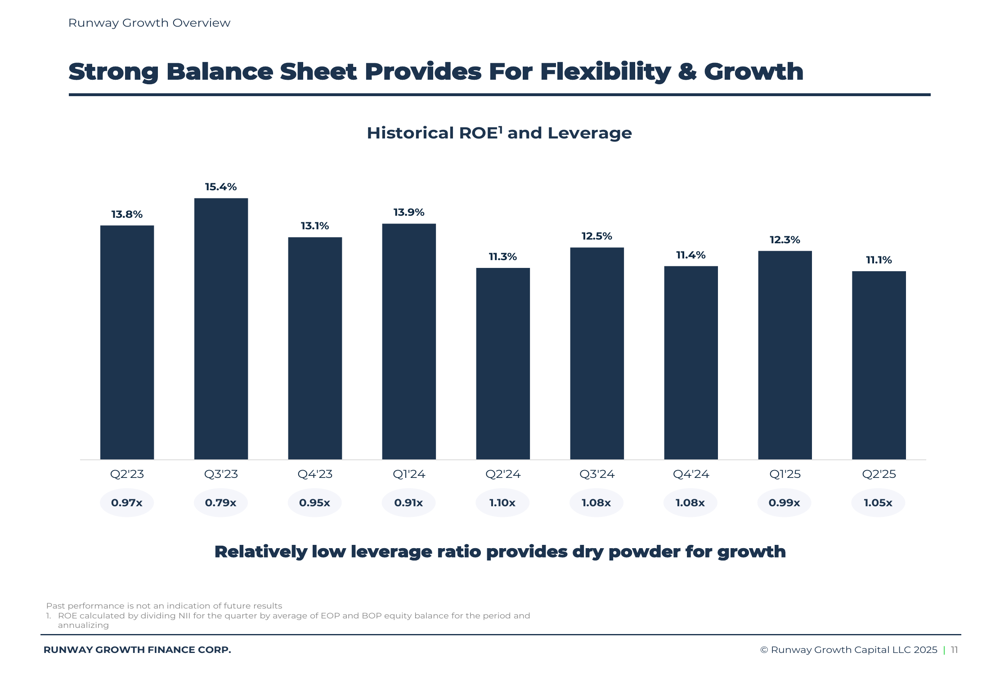
The company’s balance sheet remains optimized for flexibility and disciplined growth, with a leverage ratio of 1.05x in Q2 2025, providing dry powder for future investments.
As shown in this chart of historical ROE and leverage:
Financial Results and NAV Growth
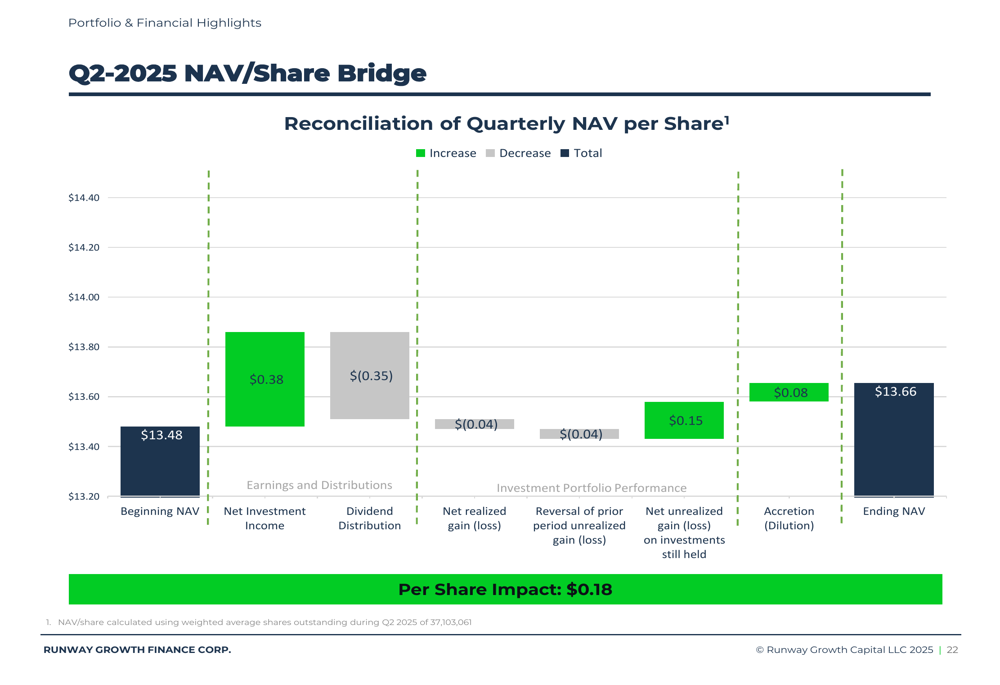
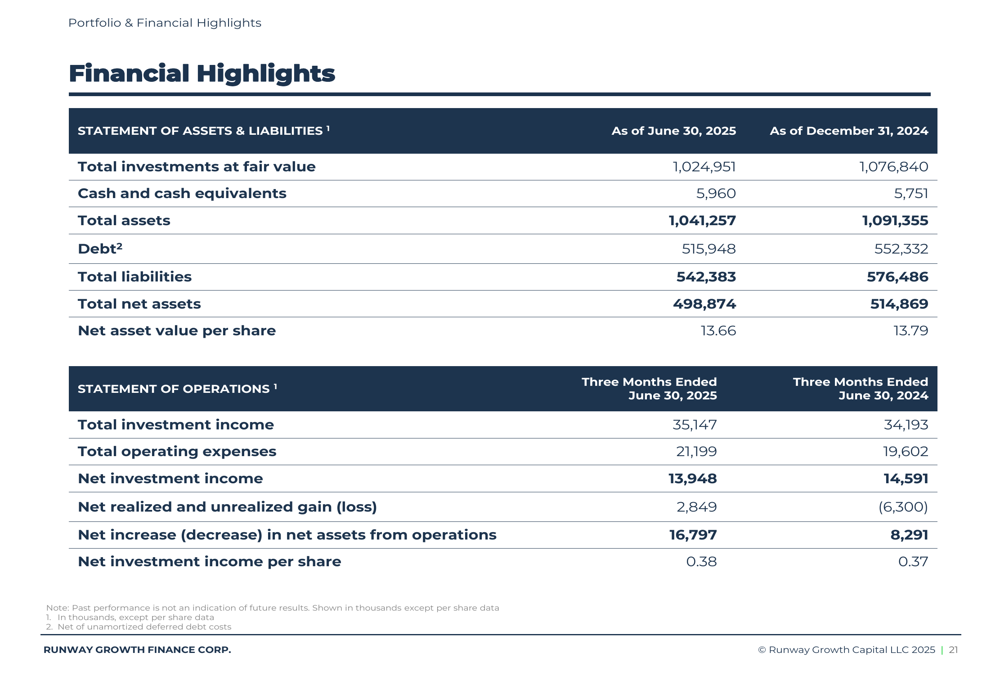
Runway reported a positive NAV per share increase from $13.48 to $13.66 in Q2 2025, representing a $0.18 per share improvement. This growth was driven by net investment income of $0.38 per share, partially offset by dividend distributions of $0.35 per share and net realized losses of $0.04 per share.
The NAV bridge illustrates these changes:
The company’s return on equity (ROE) was 11.1% in Q2 2025, down from 13.8% in Q2 2023 but still representing a solid performance in the current market environment. The average accounting yield remained strong between 14.1% and 14.7% throughout the period.
Key portfolio metrics, including investment yield and sources of income, are shown in the following chart:
The company’s financial highlights as of June 30, 2025, show total investments at fair value of $1,024,951,000 and total assets of $1,041,257,000. The statement of operations demonstrates Runway’s ability to generate consistent investment income.
Forward Outlook
Runway’s presentation suggests a cautious but optimistic outlook, emphasizing the company’s ability to capitalize on venture debt opportunities while maintaining disciplined underwriting standards. The relatively low leverage ratio of 1.05x provides capacity for portfolio growth when attractive opportunities arise.
The company’s warrant and equity portfolio also represents potential upside, with investments in 24 companies that have both loan and warrant components. These equity positions have historically helped offset debt losses, contributing to the company’s strong overall performance.
Management, led by founder and CEO David Spreng, CFO/COO Tom Raterman, and CIO Greg Greifeld, brings extensive experience from previous roles at firms including Decathlon Capital Partners (WA:CPAP), GSV Financial Group, and HPS Investment Partners. This leadership team has delivered 29 consecutive quarterly distributions since inception, demonstrating consistent execution through various market cycles.
In the context of recent earnings, Runway appears well-positioned to maintain its base dividend coverage while focusing on building NAV per share. The company’s strategic focus on first lien loans, low loan-to-value ratios, and active portfolio management should continue to support stable performance despite ongoing challenges in the venture capital ecosystem.
Full presentation:
This article was generated with the support of AI and reviewed by an editor. For more information see our T&C.