These are top 10 stocks traded on the Robinhood UK platform in July

Introduction & Market Context
Rayonier Advanced Materials (NYSE:RYAM) released its first quarter 2025 financial presentation on May 7, 2025, revealing a significant deterioration in performance amid operational challenges and tariff pressures. The company reported an operating loss of $15 million, down $32 million from the same period last year, while revenue declined to $356 million from $388 million in Q1 2024.
The market has responded negatively to RYAM’s ongoing challenges, with the stock closing at $4.26 on May 6, down from $6.63 following its Q4 2024 earnings release. After-hours trading showed a further 7.59% decline to $3.90, approaching the company’s 52-week low of $3.83.
Quarterly Performance Highlights
RYAM’s Q1 2025 results showed broad-based weakness across most segments, with Adjusted EBITDA falling to $17 million, a $35 million decrease from Q1 2024. Despite the operational challenges, the company generated $10 million in adjusted free cash flow, representing a $26 million improvement from the prior year.
As shown in the following financial highlights chart, most business segments experienced declining performance:
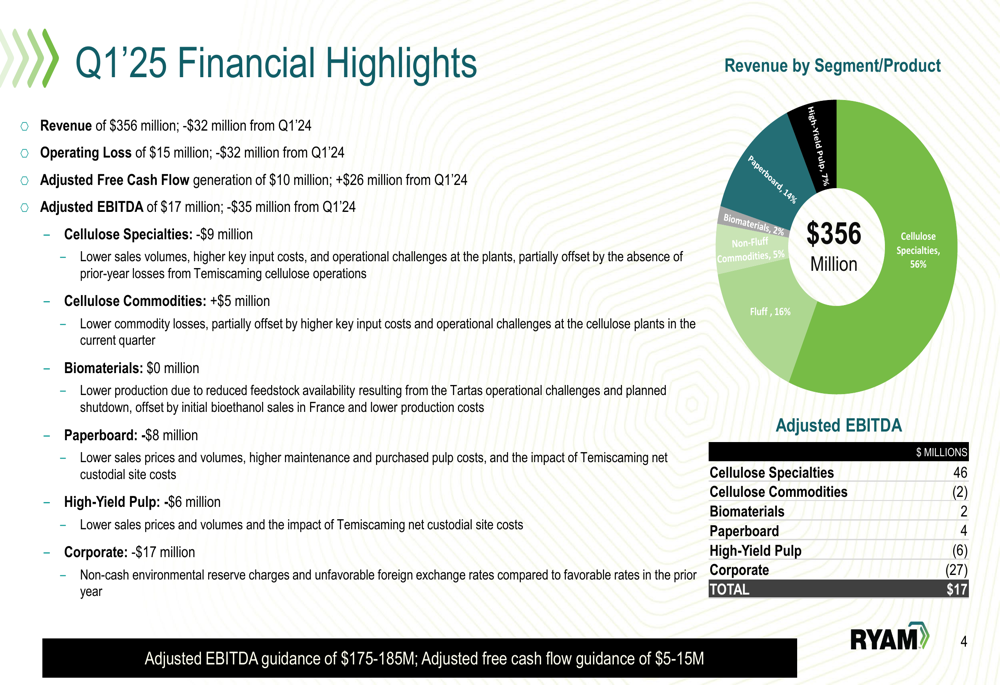
The revenue breakdown reveals that Cellulose Specialties remains the company’s largest segment at 56% of total revenue, followed by Fluff (16%) and Paperboard (14%). The company’s guidance for 2025 has been lowered to $175-185 million in Adjusted EBITDA and $5-15 million in Adjusted Free Cash Flow, down from the $215-235 million EBITDA guidance provided after Q4 2024 results.
Detailed Financial Analysis
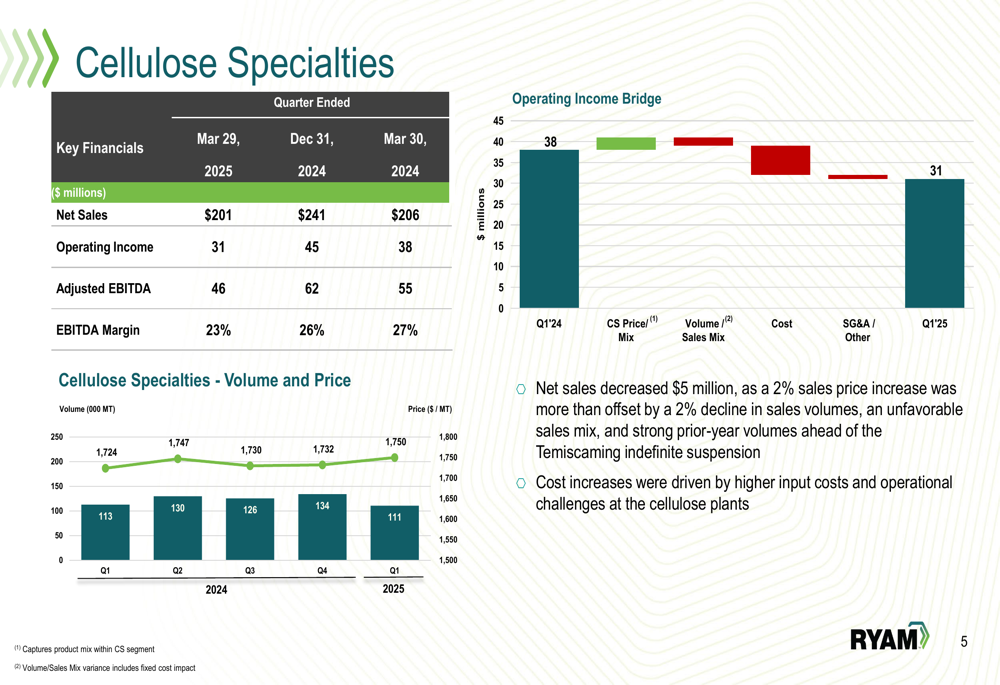
The Cellulose Specialties segment, RYAM’s largest business unit, experienced significant challenges in Q1 2025. Net sales decreased to $201 million from $241 million in Q1 2024, while operating income fell to $31 million from $45 million. The segment’s EBITDA margin contracted to 23% from 26% a year earlier.
As illustrated in the following segment performance chart, while pricing improved slightly, volumes declined and costs increased:
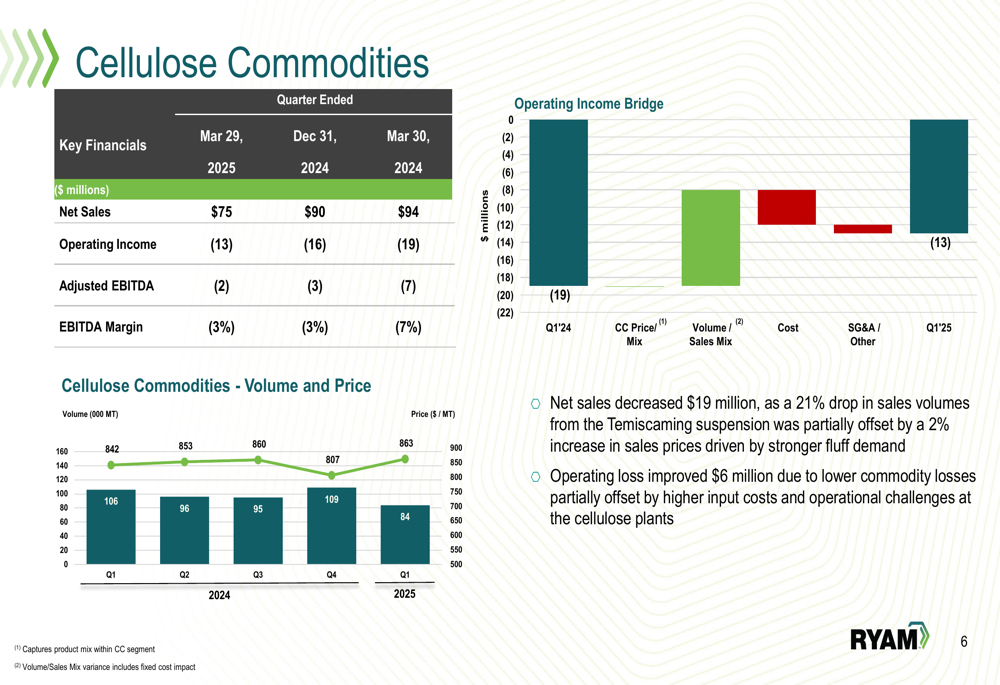
The Cellulose Commodities segment showed some improvement in its operating loss, which narrowed to $13 million from $19 million in Q1 2024. However, net sales decreased to $75 million from $94 million, primarily due to a 21% drop in sales volumes following the Temiscaming suspension. The segment’s performance was supported by a 2% increase in sales prices driven by stronger fluff demand.
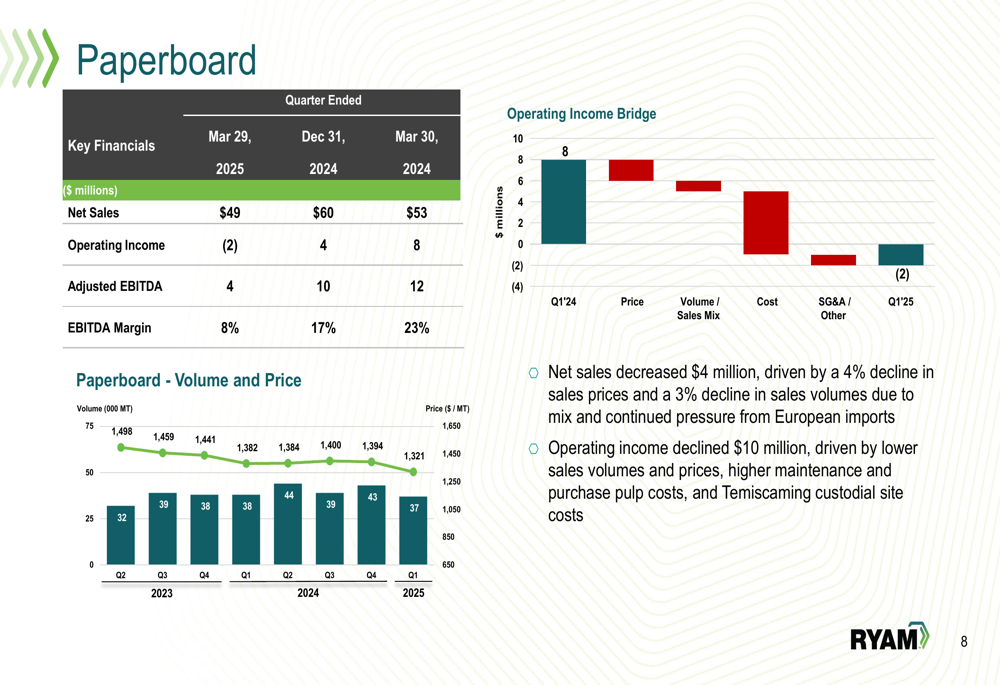
The Paperboard segment also faced significant headwinds, swinging from an $8 million operating income in Q1 2024 to a $2 million operating loss in Q1 2025. This decline was driven by lower sales prices (-4%), reduced volumes (-3%), and higher maintenance and pulp costs. The segment continues to face pressure from European imports.
The company’s consolidated operating income bridge provides a clear picture of the factors driving the $32 million decline from Q1 2024 to Q1 2025:
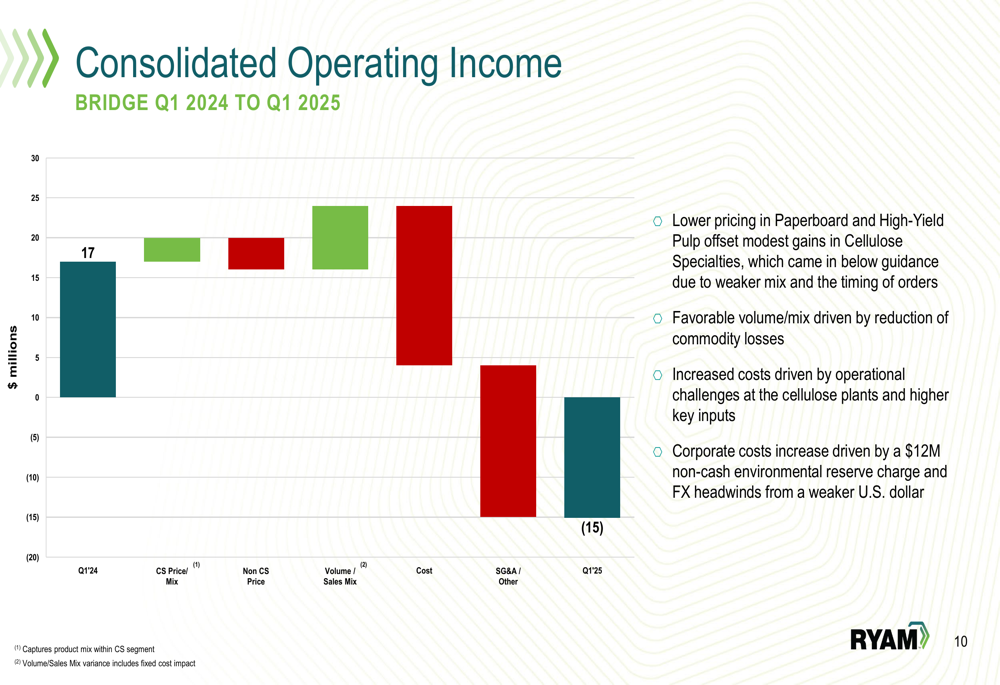
A $12 million non-cash environmental reserve charge and foreign exchange headwinds from a weaker U.S. dollar significantly impacted corporate costs, while operational challenges at cellulose plants and higher input costs further pressured margins.
Strategic Initiatives
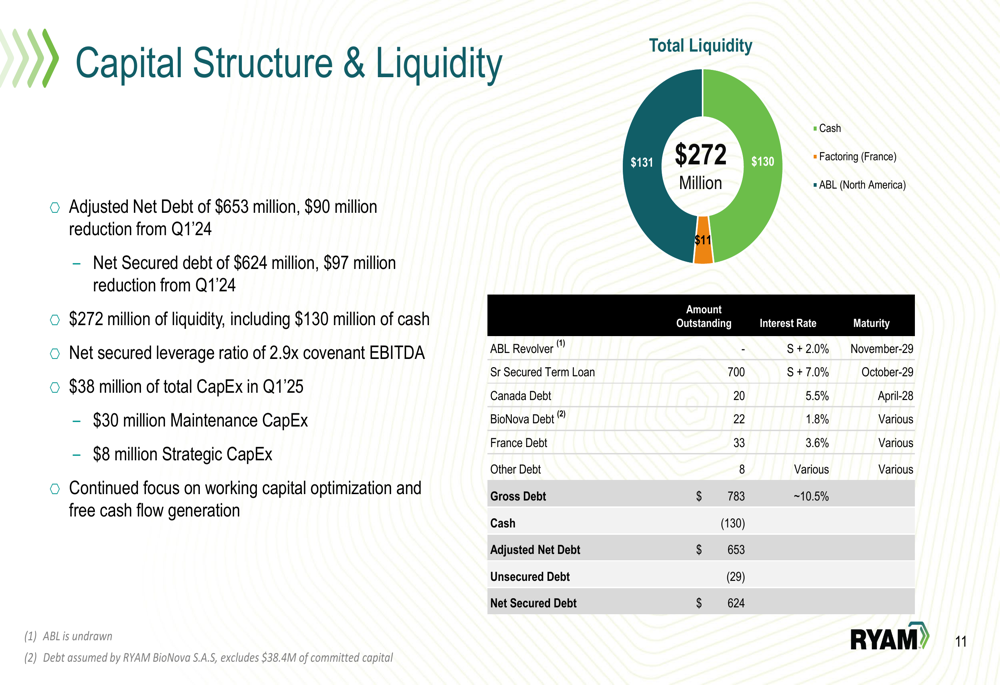
Despite operational challenges, RYAM continues to make progress on its debt reduction strategy. The company reported adjusted net debt of $653 million, a $90 million reduction from Q1 2024, and net secured debt of $624 million, down $97 million year-over-year. The net secured leverage ratio improved to 2.9x covenant EBITDA.
The following chart illustrates the company’s liquidity position:
RYAM is actively addressing tariff challenges through a multi-faceted approach. The company is focusing on customer advocacy, market diversification into non-tariff affected geographies, and operational adjustments to product mix and volumes. The tariff impact varies across segments, with Cellulose Commodities facing the highest exposure.
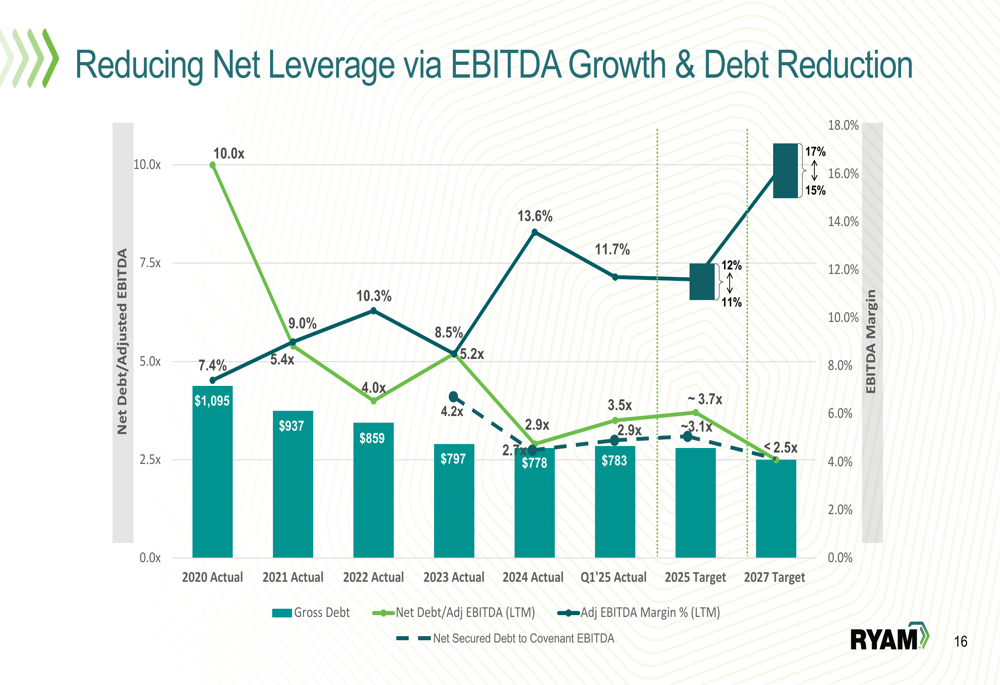
The company’s long-term leverage reduction strategy shows significant progress, with net debt to adjusted EBITDA improving from 10.0x in 2020 to 2.9x in Q1 2025:
Forward-Looking Statements
RYAM has revised its 2025 guidance downward, now projecting Adjusted EBITDA of $175-185 million and Adjusted Free Cash Flow of $5-15 million. The following waterfall chart details the components of the expected cash flow:
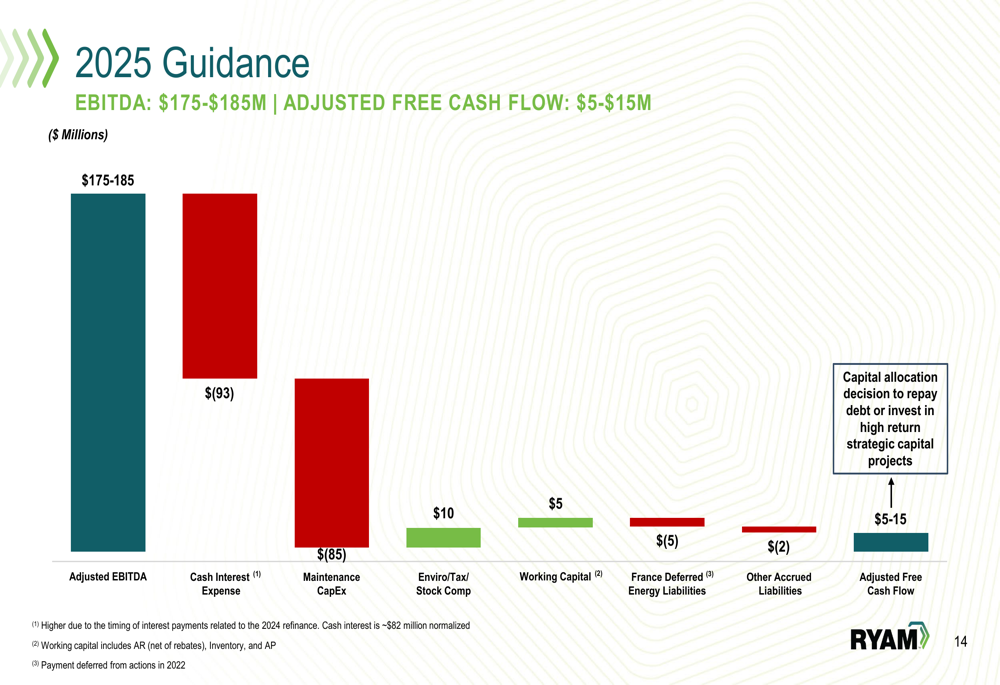
The company’s capital allocation strategy prioritizes debt repayment and investments in high-return strategic capital projects. For 2025, RYAM plans $38 million in total CapEx, with $30 million allocated to maintenance and $8 million to strategic initiatives.
Looking ahead, RYAM is advancing biomaterials projects supported by secured green capital, with final investment decisions for several initiatives expected in the second half of 2025. The company also continues to focus on asset optimization to reduce earnings volatility and increase profit margins, including the requalification of Temiscaming CS volumes.
Market conditions remain challenging across segments, with commodity prices showing mixed trends:
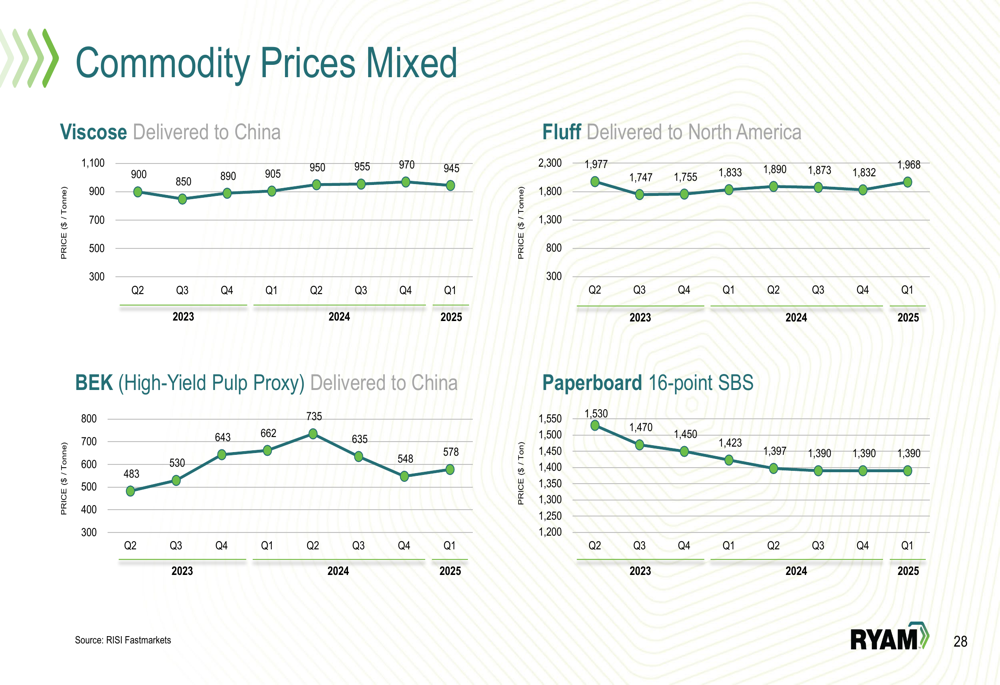
As RYAM navigates these challenges, the company’s ability to execute on its tariff mitigation strategies and operational improvements will be critical to meeting its revised 2025 guidance and continuing its debt reduction progress.
Full presentation:
This article was generated with the support of AI and reviewed by an editor. For more information see our T&C.