Fed Governor Adriana Kugler to resign

Introduction & Market Context
Scotiabank (TSX:BNS) recently released its Q2 2025 investor presentation, revealing mixed financial results with 9% year-over-year revenue growth but declining earnings per share compared to both the previous quarter and the same period last year. The bank continues to leverage its diversified business model across North America and Latin America while maintaining strong capital and liquidity positions.
Following a strong Q1 2025 where the bank reported EPS of $1.76 and revenue of $9.37 billion, Q2 results show some moderation with EPS of $1.48 and revenue of $9.1 billion. The stock has been trading in a 52-week range of $43.68 to $57.07, with a recent closing price of $52.19 as of May 23, 2025.
Quarterly Performance Highlights
Scotiabank reported Q2 2025 net income of $2.0 billion, representing a 3% decrease year-over-year but a substantial 105% increase quarter-over-quarter. Diluted EPS came in at $1.48, down 6% from Q2 2024 but up 124% from Q1 2025. Revenue reached $9.1 billion, growing 9% year-over-year despite a 3% decline from the previous quarter.
As shown in the following comprehensive financial performance summary:
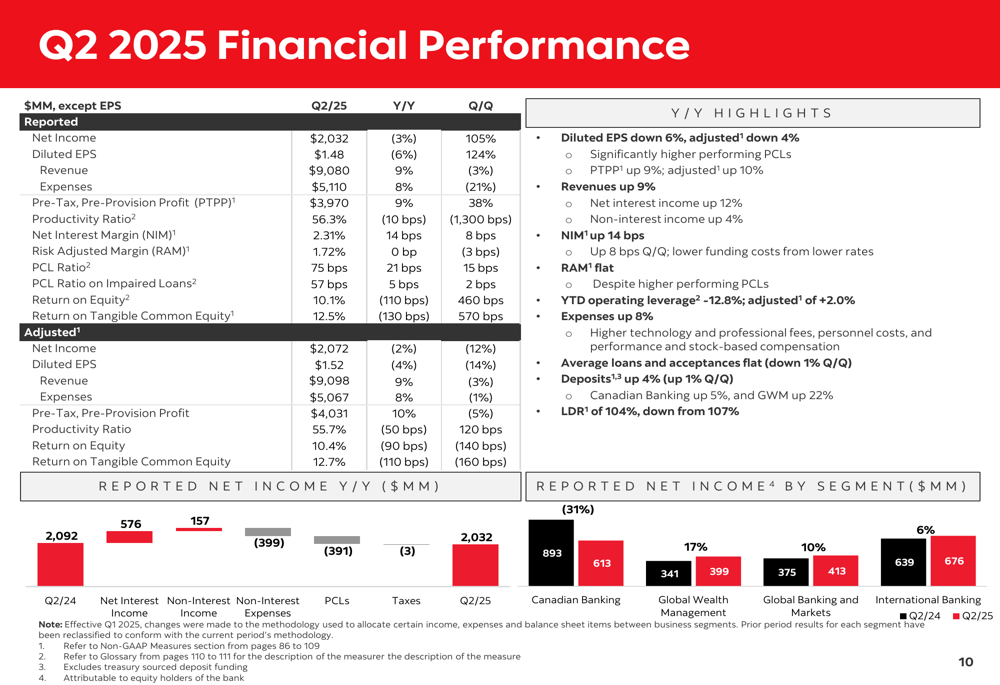
The bank’s productivity ratio stood at 56.3%, while return on equity was 10.1%, below the medium-term target of >14%. Net interest margin improved to 2.31%, up 14 basis points year-over-year and 8 basis points quarter-over-quarter, reflecting the bank’s ability to manage its interest rate spread effectively in the current rate environment.
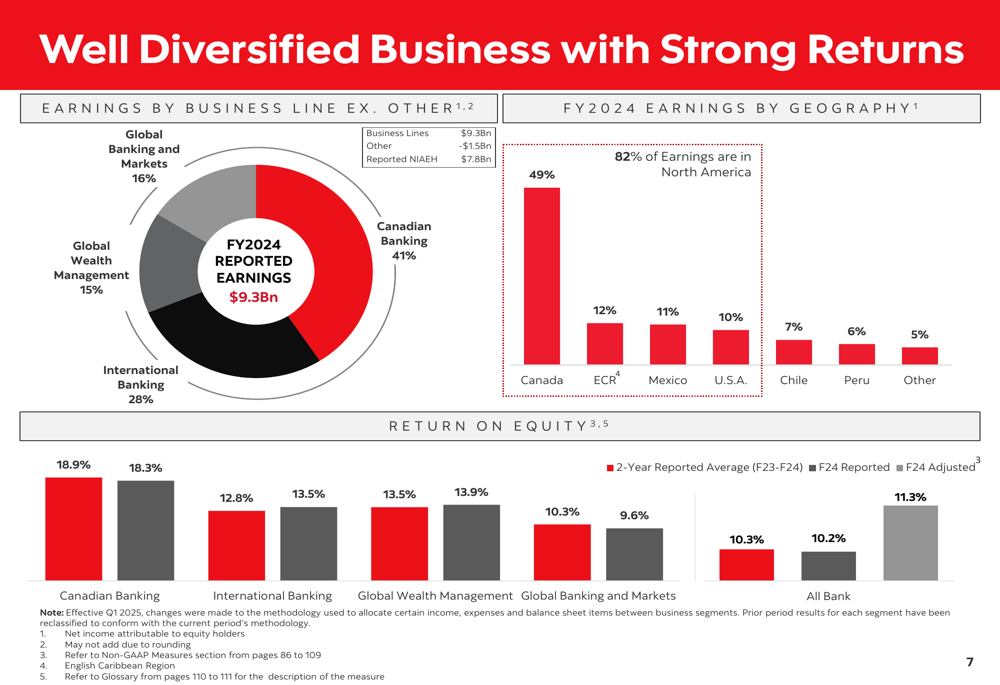
Scotiabank’s business remains well-diversified across both business lines and geography, providing stability amid varying economic conditions in different markets. The following chart illustrates this diversification:
Business Segment Performance
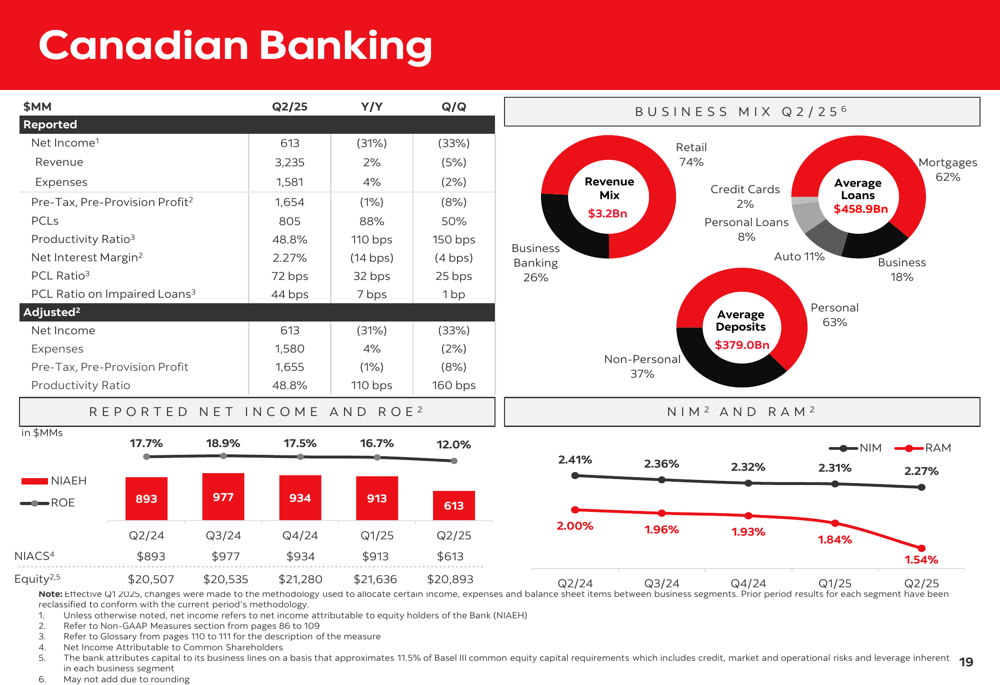
Canadian Banking, which represents 41% of the bank’s earnings, reported net income of $613 million with a strong return on equity of 18.9%. The segment’s net interest margin was 2.27%, while its productivity ratio stood at 48.8%. The Canadian retail loan portfolio remains high-quality with 77% of residential mortgages being uninsured but maintaining a low loan-to-value ratio of 52%.
The following chart details Canadian Banking’s financial performance:
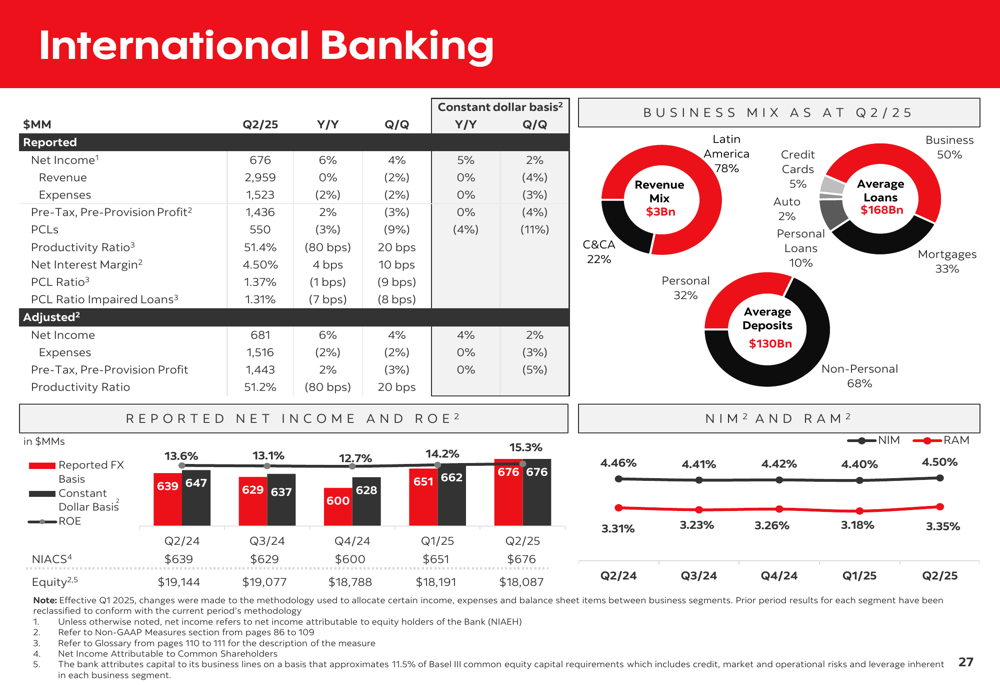
International Banking, contributing 28% of earnings, delivered net income of $676 million with a return on equity of 12.8%. This segment showed resilience across key markets including Mexico, Chile, Peru, Colombia, and the Caribbean. The following chart illustrates International Banking’s performance metrics:
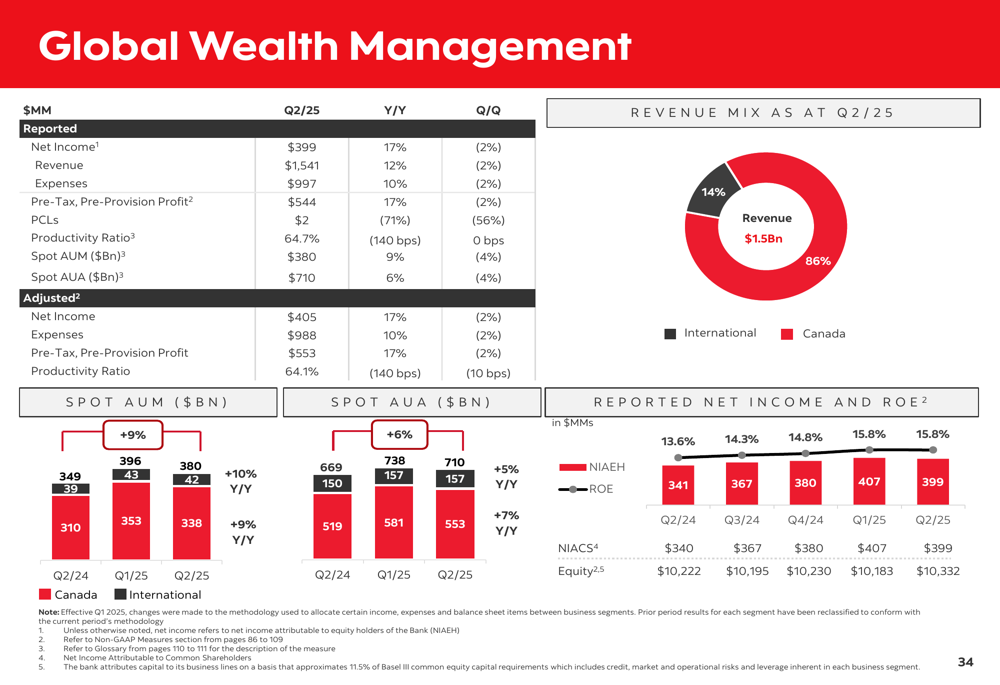
Global Wealth Management, representing 15% of earnings, reported net income of $399 million with a return on equity of 13.5%. The segment’s revenue mix was heavily weighted toward Canada (86%) versus international operations (14%).
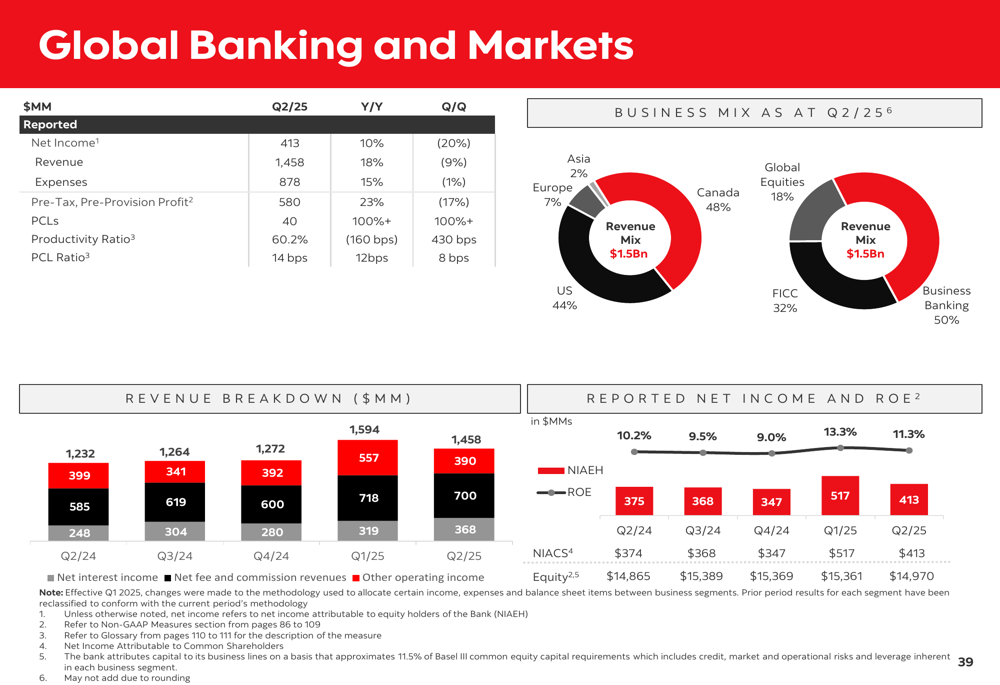
Global Banking and Markets, accounting for 16% of earnings, delivered net income of $413 million with a return on equity of 10.3%. This segment’s revenue was well-balanced geographically, with 48% from Canada and 44% from the US.
Capital and Liquidity Position
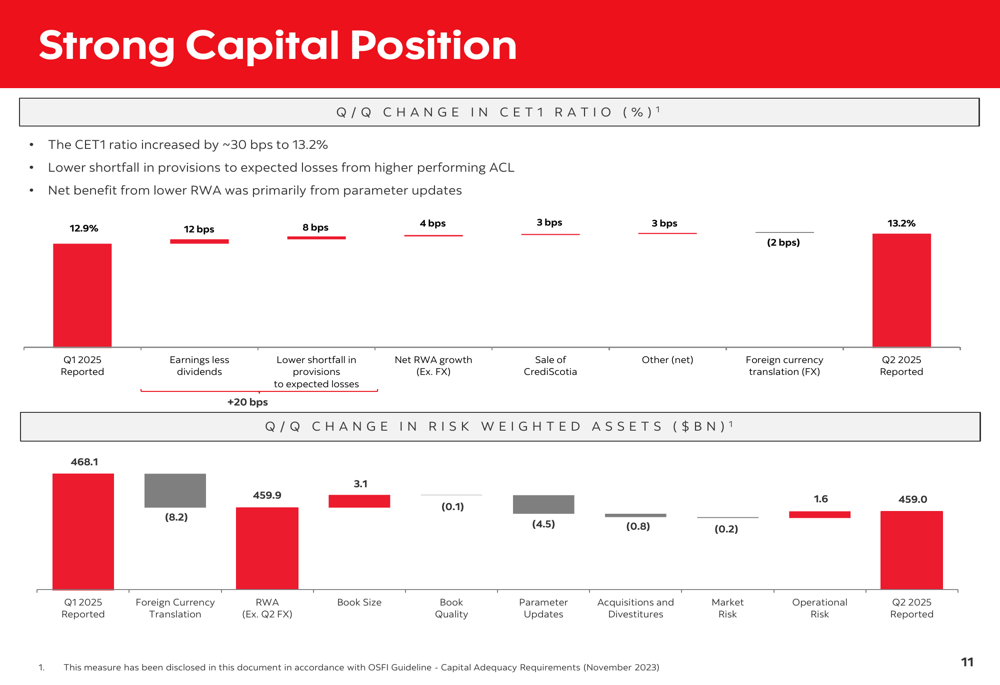
Scotiabank maintained a strong capital position in Q2 2025, with its Common Equity Tier 1 (CET1) ratio increasing by approximately 30 basis points quarter-over-quarter to 13.2%, well above its medium-term target of 12%+. This improvement was primarily driven by earnings less dividends (+12 bps) and lower shortfall in provisions (+8 bps).
The following chart illustrates the changes in the bank’s capital position:
Liquidity metrics also remained robust, with a Liquidity Coverage Ratio of 131% and a Net Stable Funding Ratio of 120%. The bank’s Total (EPA:TTEF) Loss Absorbing Capacity (TLAC) ratio stood at 30.3%, comfortably above the regulatory minimum of 25.08%.
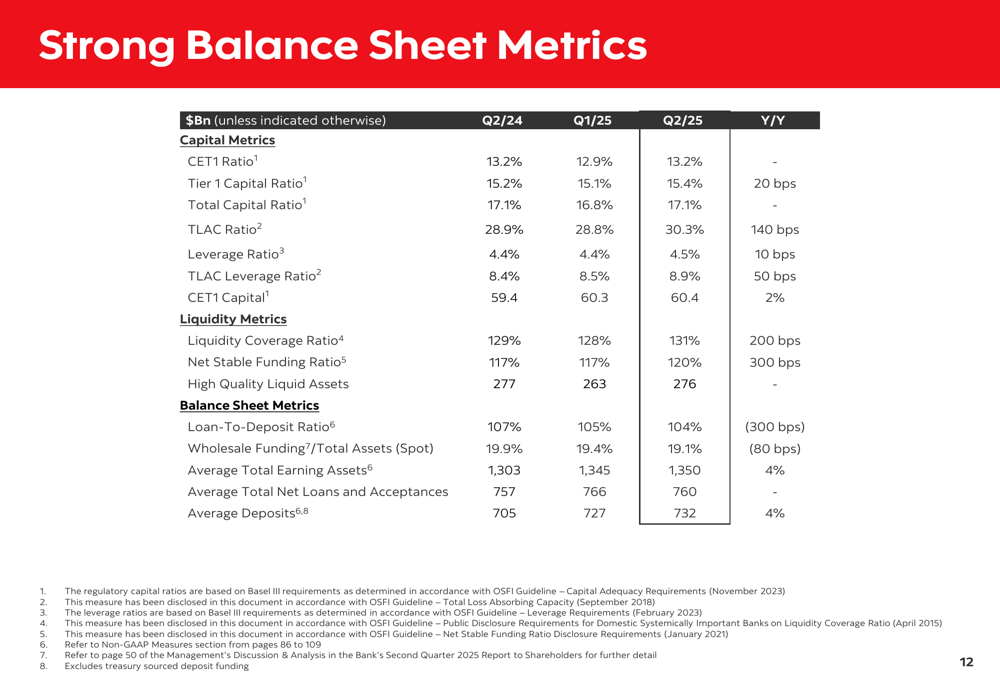
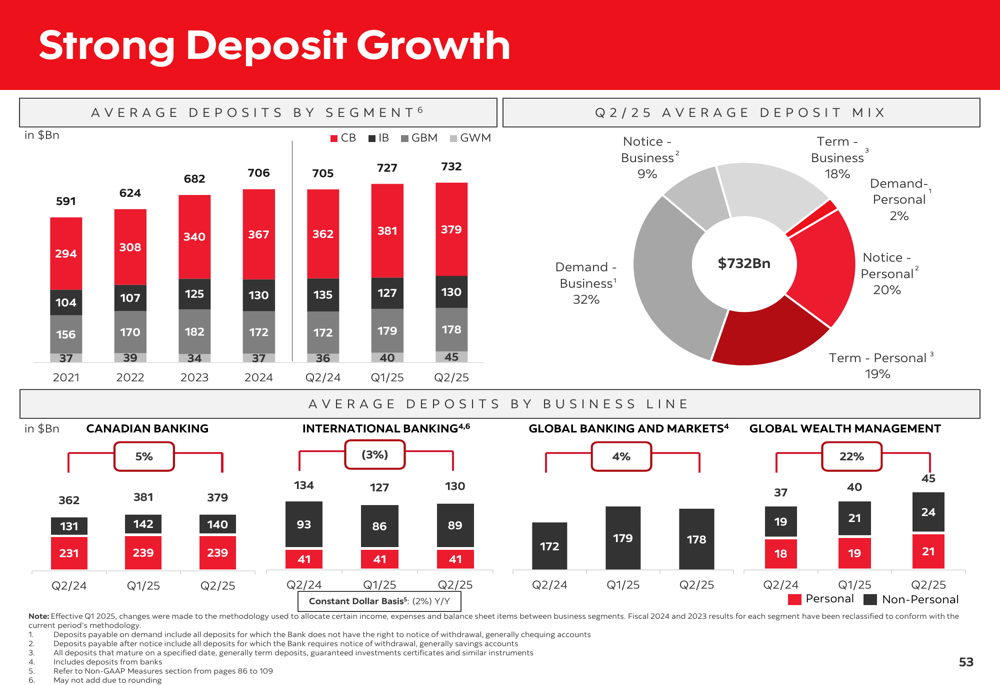
Deposit growth has been strong across business lines, providing a stable funding base for the bank’s operations:
Strategic Initiatives and Outlook
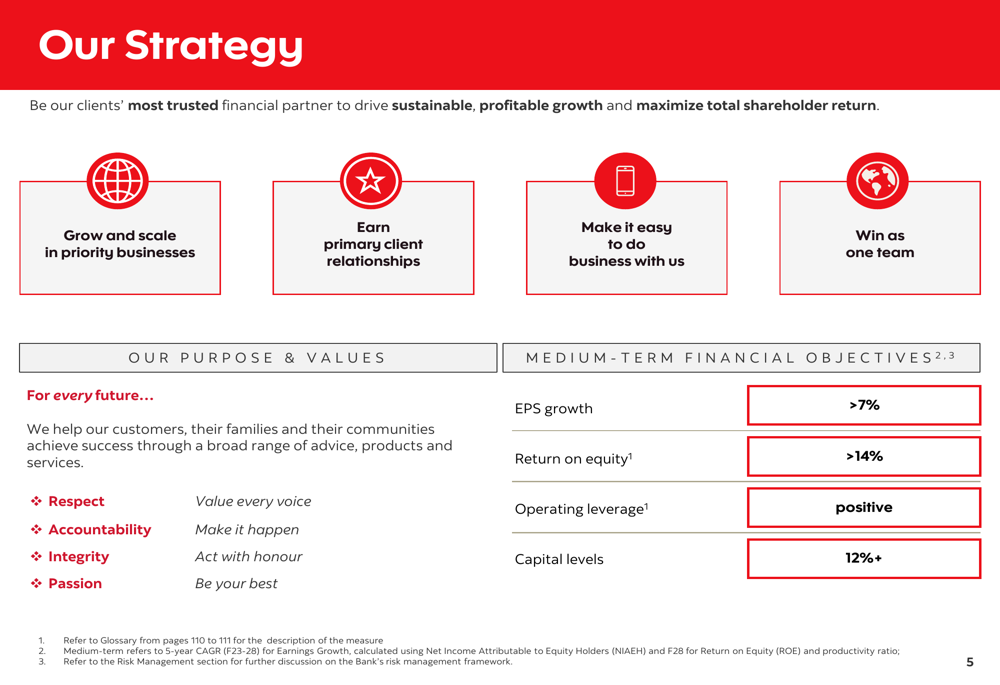
Scotiabank outlined its strategic priorities focused on growing and scaling priority businesses, earning primary client relationships, making it easier to do business with them, and winning as one team. The bank has set medium-term financial objectives including EPS growth of >7%, ROE of >14%, positive operating leverage, and capital levels of 12%+.
The following chart summarizes these strategic priorities:
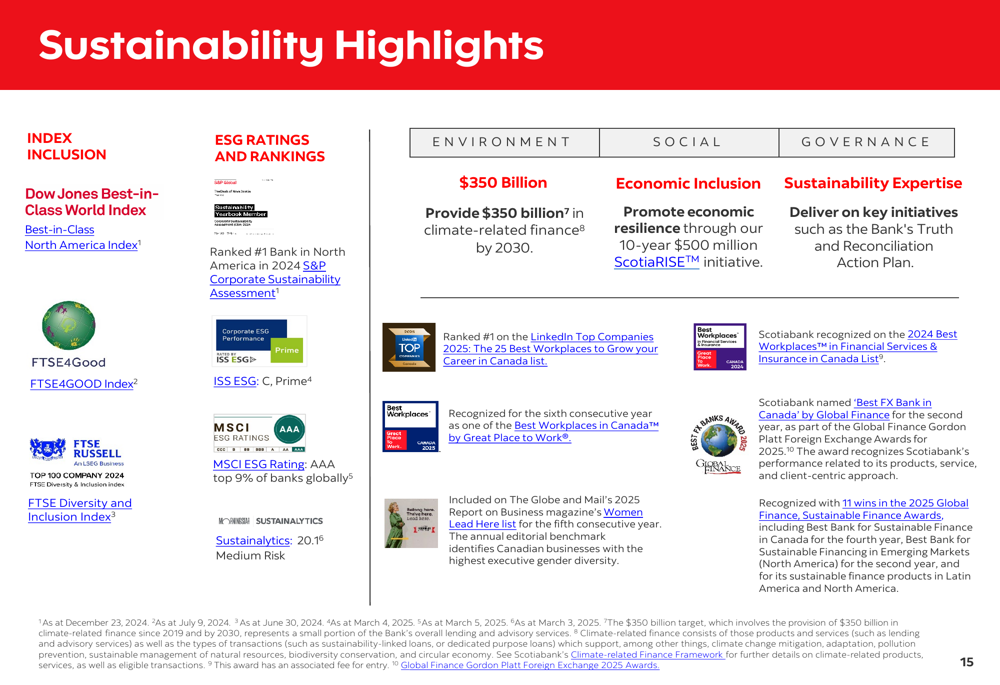
The bank continues to make progress on its sustainability initiatives, including a commitment to $350 billion in climate-related finance by 2030 and its $500 million ScotiaRISE™ initiative. Scotiabank has received recognition for its ESG efforts, including inclusion in the Dow Jones Sustainability Indices and top ratings from MSCI and Sustainalytics.
Looking ahead, Scotiabank faces both opportunities and challenges. While the bank’s CEO Scott Thompson had previously indicated that 2025 was "off to a strong start" following Q1 results, the Q2 performance suggests some moderation. The bank remains cautious about navigating potential volatility, with particular attention to macroeconomic conditions in key markets like Canada and Mexico.
Despite the mixed Q2 results, Scotiabank’s diversified business model, strong capital position, and strategic focus on priority markets position it to manage through economic uncertainties while pursuing long-term growth opportunities, particularly in the North American corridor.
Full presentation:
This article was generated with the support of AI and reviewed by an editor. For more information see our T&C.