Walmart halts H-1B visa offers amid Trump’s $100,000 fee increase - Bloomberg

Introduction & Market Context
SEI Investments Company (NASDAQ:SEIC) reported strong year-over-year growth in its Q2 2025 earnings presentation released on July 23, with significant gains in revenue, net income, and earnings per share. The financial services company, which closed the day at $90.58, down 0.66%, showcased robust performance across most metrics while highlighting the impact of several non-recurring items that substantially boosted its bottom line.
The company’s results come amid continued market volatility but demonstrate SEI’s ability to maintain growth momentum following its strong Q1 2025 performance, when it reported an EPS of $1.17 that exceeded analyst expectations.
Quarterly Performance Highlights
SEI reported Q2 2025 revenues of $559.6 million, representing a 7.8% increase year-over-year and a 1.5% improvement sequentially. Operating income reached $148.6 million, up 8.9% compared to Q2 2024, though down 5.4% from the previous quarter.
As shown in the following financial highlights:
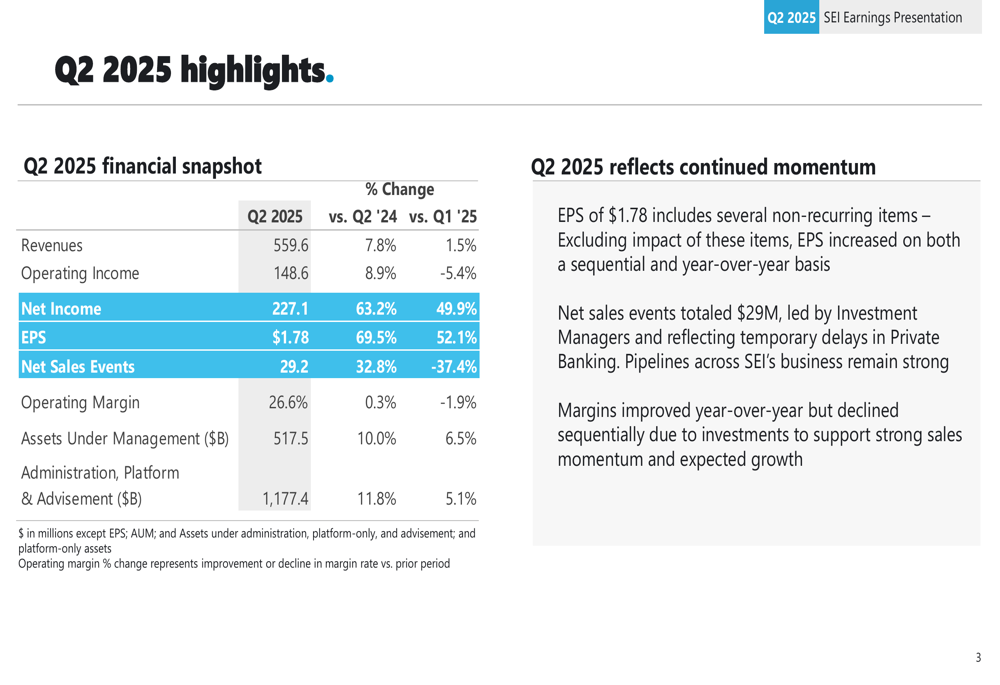
The most dramatic improvement came in net income, which surged 63.2% year-over-year to $227.1 million, and earnings per share, which jumped 69.5% to $1.78. However, these figures include significant non-recurring items that boosted results.
A detailed breakdown of the EPS components reveals that the $1.78 figure includes a $0.60 gain from the sale of FOS and a vendor settlement, along with $0.02 of non-recurring expenses:
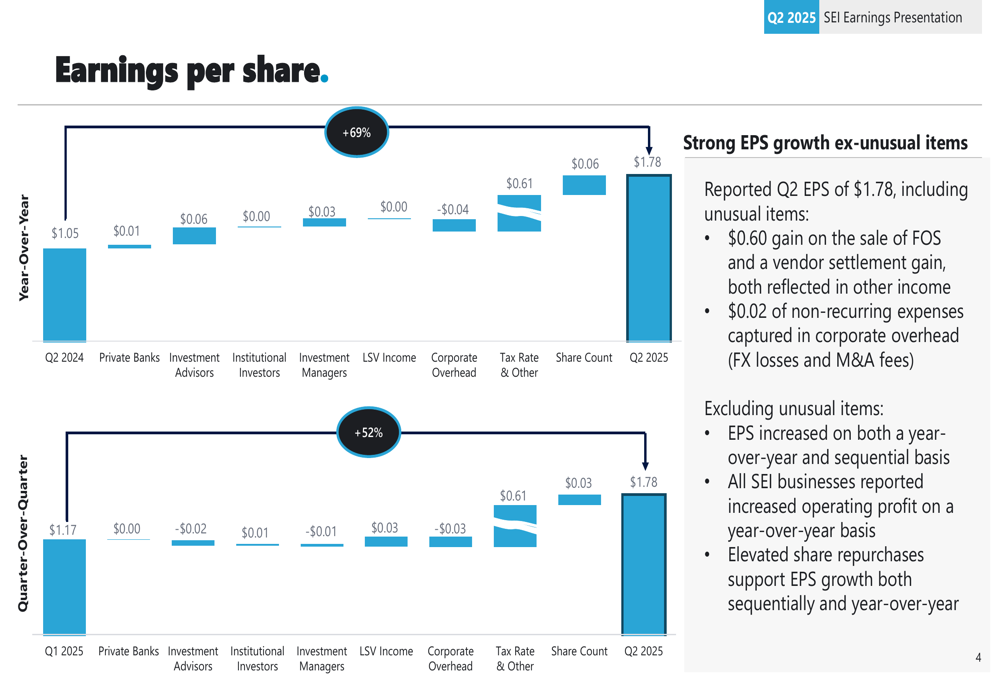
Even excluding these unusual items, SEI’s EPS still showed growth both year-over-year and sequentially. The company attributed this performance to increased operating profit across all business segments compared to the prior year, supported by elevated share repurchases.
Segment Performance Analysis
SEI’s business units delivered mixed results in Q2 2025. The Investment Managers segment emerged as the strongest performer with a 19% increase in operating profit year-over-year, while Private Banking saw revenue growth but operating profit decline.
The segment performance breakdown shows varying trends across the company’s business units:
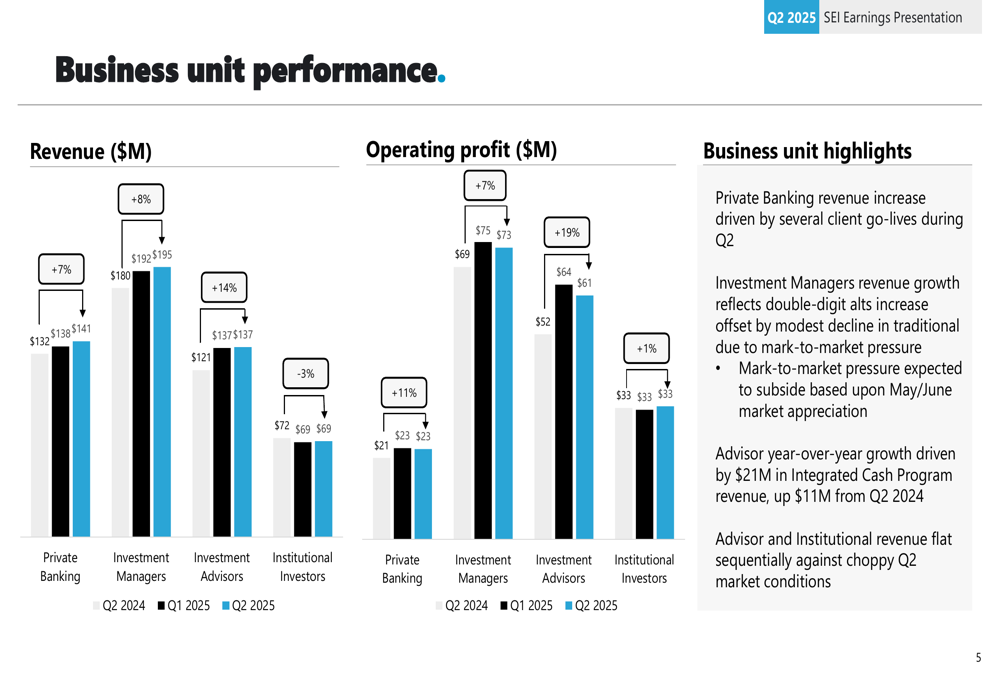
Private Banking revenue increased 8% driven by client go-lives, but operating profit decreased 7%. Investment Managers’ growth reflected double-digit alternative investments performance, partially offset by modest declines in traditional assets due to market pressures. The Investment Advisors segment showed relatively flat revenue with a slight 1% increase in operating profit, while Institutional Investors saw a 3% revenue decline but an 11% operating profit increase.
Operating margins across segments showed similar mixed performance:
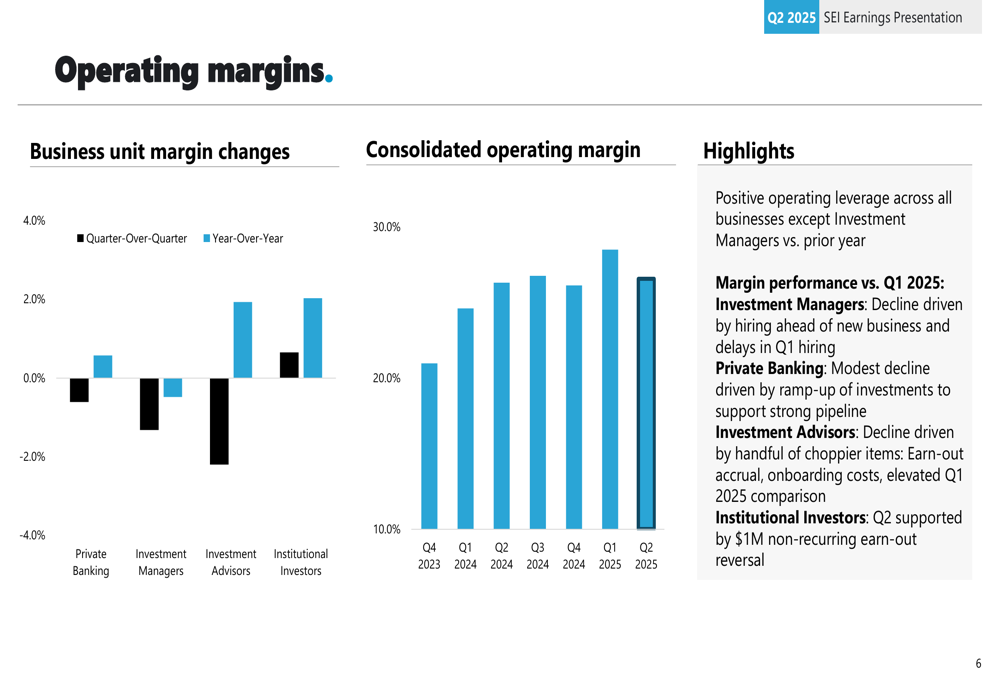
The consolidated operating margin stood at 26.6%, representing a slight 0.3% improvement year-over-year but a 1.9% decline sequentially. This sequential margin pressure was attributed to strategic investments, particularly in the Investment Managers segment where hiring ahead of new business and delays in Q1 hiring impacted results.
Sales Momentum and Asset Growth
SEI reported strong sales momentum with net sales events reaching $29.2 million in Q2 2025, a 32.8% increase compared to Q2 2024, though down 37.4% from the exceptionally strong Q1 2025. On a trailing twelve-month basis, net sales events reached a record $160 million.
The following chart illustrates the company’s sales event trends:
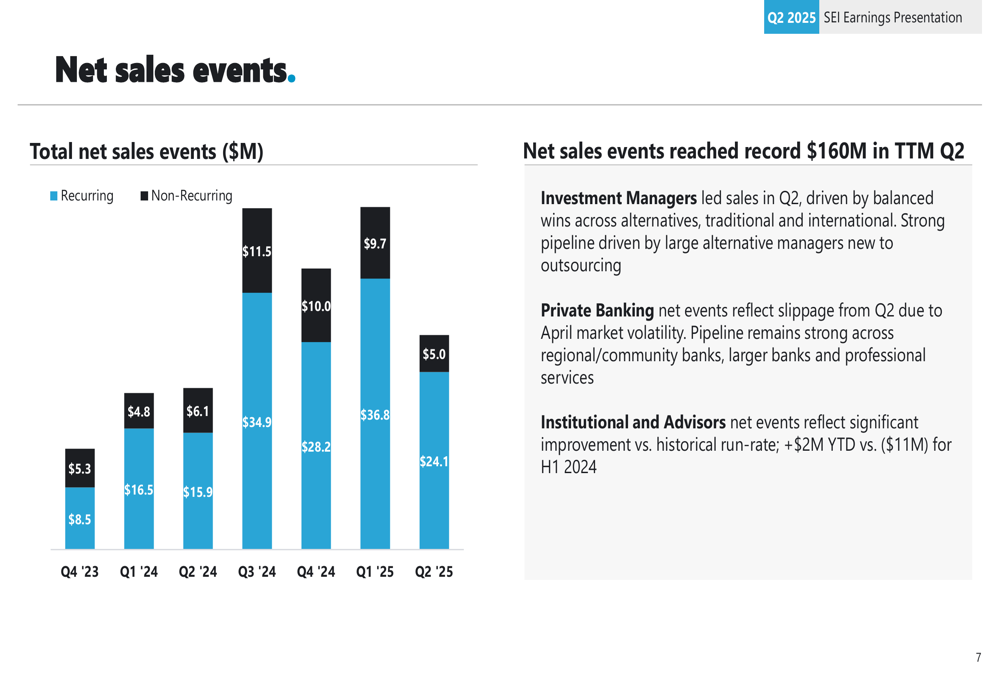
Investment Managers led sales performance, driven by balanced wins across various client types. Private Banking net events reflected some slippage from Q2, while Institutional and Advisors segments showed significant improvement compared to historical run rates.
Client assets continued to grow, with Assets Under Management (AUM) reaching $517.5 billion, up 10.0% year-over-year and 6.5% sequentially. Assets Under Administration (AUA) grew to $1,177.4 billion, representing an 11.8% increase year-over-year and 5.1% from the previous quarter.
The asset growth is visualized in the following chart:
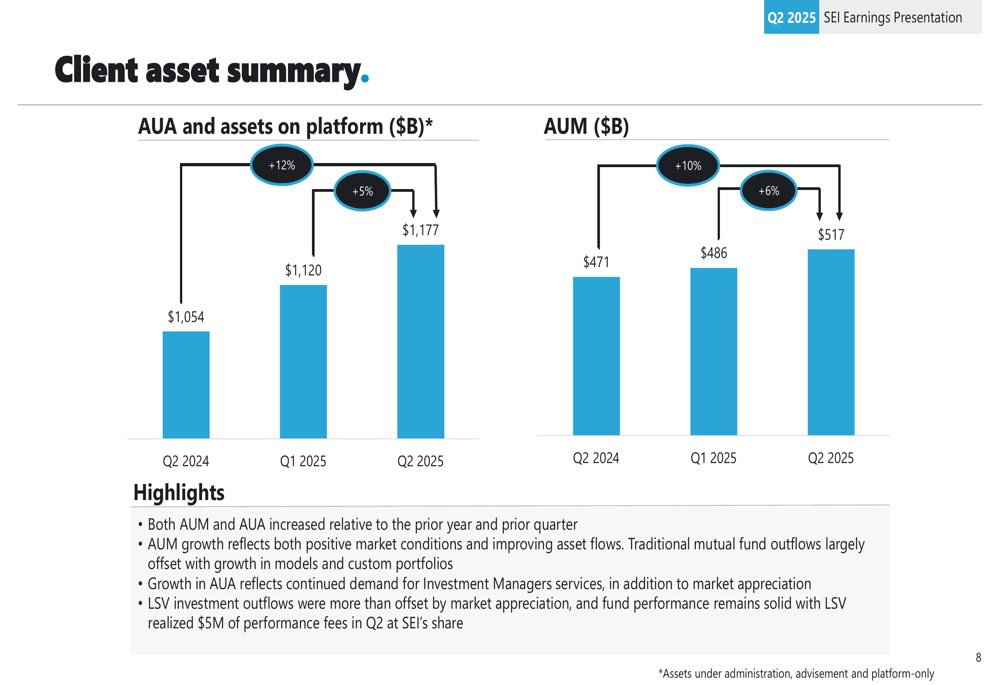
The company noted that AUM growth reflected positive market conditions and asset flows, while AUA growth demonstrated continued client demand. LSV investment outflows were more than offset by market appreciation, with LSV realizing $5 million of performance fees in Q2 (at SEI’s share).
Capital Allocation & Strategic Initiatives
SEI maintained its strong capital position with $746 million in cash and no long-term debt as of Q2 2025. The company continued to return significant capital to shareholders, with $61 million spent on share buybacks and $181 million on dividends during the quarter.
The capital allocation strategy is illustrated in the following chart:
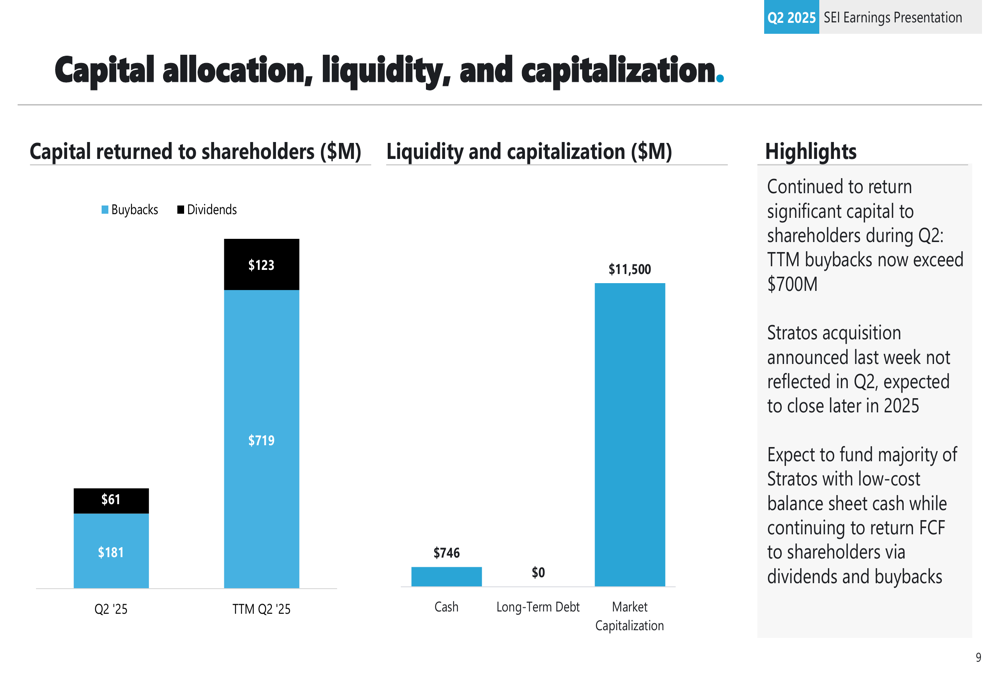
On a trailing twelve-month basis, SEI returned over $842 million to shareholders, with buybacks exceeding $700 million. The company’s market capitalization stood at $11.5 billion.
A significant strategic development highlighted in the presentation was the announced acquisition of Stratos, which is expected to close later in 2025. SEI plans to fund this acquisition with its balance sheet cash while continuing to return capital to shareholders through dividends and buybacks.
Forward-Looking Statements
Looking ahead, SEI emphasized that pipelines across its businesses remain strong, suggesting continued growth potential. The company is positioning itself for long-term growth through strategic investments, despite the short-term impact on margins.
The planned Stratos acquisition represents a significant strategic move that could further strengthen SEI’s market position, though the financial impact is not yet reflected in the current results. Management indicated that this acquisition would be funded through existing cash reserves while maintaining the company’s commitment to shareholder returns.
While SEI’s presentation highlighted strong year-over-year growth, investors should note that a significant portion of the EPS growth came from non-recurring items. The sequential decline in operating margin, particularly in the Investment Managers segment, bears watching as the company balances growth investments with profitability.
Full presentation:
This article was generated with the support of AI and reviewed by an editor. For more information see our T&C.